The Canadian emissions quandary: Has this ship sailed?

Climate scientists often say stopping climate change is like stopping a supertanker. The ship has a lot of momentum, so you can’t just slam on the brakes at the last minute.

The analogy is referring to the physics of the climate system itself, but also holds true for the sources of greenhouse gas emissions. The technology exists to dramatically reduce greenhouse gas emissions but we can’t implement it all today over lunch.

In Canada, the emissions supertanker has been charging along despite repeated warnings of the iceberg ahead. After years without serious coordinated federal action, a promise to meet an ambitious emissions target, no matter how well-intentioned, no matter how grounded in scientific analysis, now looks unrealistic.

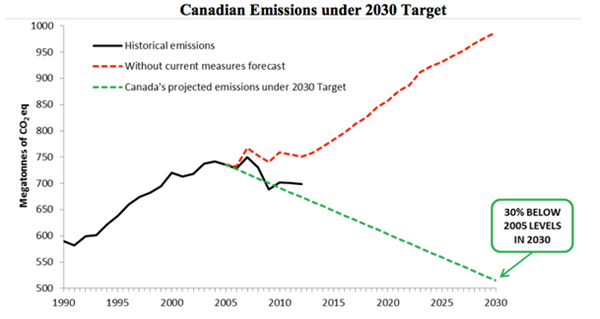
Here are the emissions since 1990 together with the Environment Canada projection to 2030, the various proposed emissions targets, and some coarse reduction scenarios.

Cdn emissions with Bill C619

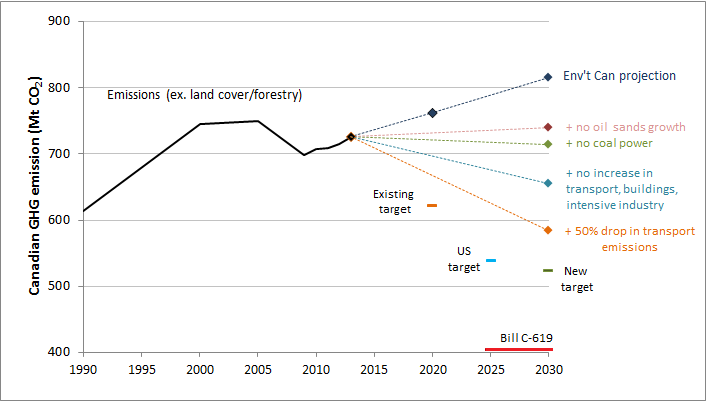
Most analysts argue that the current government’s policies and plans are not close to sufficient to reach the existing target (17% below 2005 levels by 2020) or the new target (30% below 2005 levels by 2030). The emissions target from the “Climate Change Accountability Act” Bill C-619 (34% below 1990 levels by 2025, now 2025-2030), which the NDP pledges to reintroduce if elected, is even more unrealistic. Again, this is not about the scientific value of the target – Bill C619 would put Canada in line with the global goal of reducing emissions sufficiently by 2050 to avoid a high probability of 2 degrees C warming.

It’s clear from the emissions inventory that to reach even the less ambitious current targets, Canada would need to reign in emissions from the oil and gas sector and ramp up efficiency in transportation, buildings and other intensive industries (not to mention forestry – not included in this analysis). Many of the necessary innovations are possible, and some may be encouraged by resource prices and other global factors. It will still be difficult to meet the new 2030 target, let alone the ambitious and likely politically impossible Bill C-619 target.

After twenty years of political rhetoric, the plans are more important than the targets. Canada may not meet the proposed targets but it can at least make some progress and show a serious commitment to addressing climate change.

Has climate change played a role in the Syrian conflict?

This is re-posted from exactly two years ago. Since then, the Syrian refugee crisis has worsened.

20120424_syriadroughtThe Syrian conflict has become a humanitarian tragedy incomparable to others in recent history. Over 2 million people, 10% of the country, have fled during the ongoing conflict according to the UN.

While the proximate drivers of the Syrian conflict are a reaction to an oppressive government, the wave of Arab Spring protests, and other political, social and economic factors, a number of experts have argued that climate change, or at least climate, has served as a “multiplier”.

Links between climate change and the Arab Spring have been suggested for the past couple of years. High wheat prices in 2010-11, driven by droughts in Russia and China, may have contributed to the unrest in Egypt and the overall timing of the Arab Spring protests. In Syria, add on the fact that a severe drought over the past decade has devastated farmers.

From a UN Office of Disaster Risk Reduction report:

Poor and erratic rainfall since October 2007 has caused the worst drought to strike Syria in four decades. Approximately one million people are severely affected and food insecure, particularly in rainfed areas of the northeast – home to Syria’s most
vulnerable, agriculture-dependent families.

Since the 2007/2008 agriculture season, nearly 75 percent of these households suffered total crop failure. Depleted vegetation in pastures and the exhaustion of feed reserves have forced many herders to sell their livestock at between 60 and 70 percent below cost. Syria’s drought break point was the season 07/08 which extended for two more seasons, affecting farming regions in the Middle north, Southwestern and Northeastern of the country, especially the northeastern governorate of Al Hassakeh. 

The drought drove internal migration to the cities, depopulating some rural areas:

The drought is causing a high drop-out rate, families left in the area who cannot afford, or do not want, to move are suffering. Some figures estimated the people lifted their villages to be more than one million people. Thousands of Syrian farming families have been forced to move to cities in search of alternative work after two years of drought and failed crops followed a number of unproductive years. The field survey that conducted by ACSAD/MoLA/UNDP in January 2011 showed that most of the houses on villages are left empty and less than 10% are occupied by old people and children, The younger generations left for thousands of kilometers seeking work.

While the Syrian drought, like any individual event, cannot be definitively attributed to climate change, the Middle East and the Mediterranean region is one place where climate models agree that drought is becoming or will become more frequent due to human-induced climate change. From Hoerling et al. (2012):

The amplitude of the externally forced [ED-meaning “human-caused”], area-averaged Mediterranean drying signal (estimated from the ensemble mean of CMIP3 simulations) is roughly one-half the magnitude of the observed drying, indicating that other processes likely also contributed to the observed drying.

 Naturally, these connections need to be viewed with caution. Climate change is not solely responsible for the Syrian drought, as natural climate variability and ill-conceived land use and agricultural policy clearly also contributed. And the drought itself is only one of many stressors that led to the crisis in Syria. The fact is we will never be able to precisely calculate the contribution of climate change to a geopolitical event or a humanitarian crisis.

Does the inability to provide a precise answer – the drought is 44% due to climate change – matter?

Inability to attribute events to climate change may make adaptation seem impossible. A solution is to not view adaptation as separate from other development activities. For example, the large aid institutions  recommend marrying climate change adaptation and disaster risk reduction. In other words, when working on a program or system to reduce future droughts, consider how climate change may alter the likelihood and nature of future disasters.

Right now, any of that would be a luxury in Syria. Dealing with the everyday humanitarian crisis is paramount. Hopefully, in time the crisis will abate enough to work on rebuilding people’s lives and improving the capacity to deal with future droughts.

Canada’s moving climate target: the numbers

The Canadian government committed to reducing GHG emissions by 30% below 2005 levels by the year 2030. It was immediately derided by some observers as weak and others as ambitious. It is both: weak in terms of international equity, but ambitious given existing Canadian emissions policy, or lack thereof.

But there’s an even more fundamental problem.

Just what is the actual target?

Here’s the chart from Canada’s official submission to the United Nations, technically called an INDC:

canada-emissions-under-2030-target_600x319
The Carbon Brief brought attention to some confusion with the submission. The data in that graph does not include the key category of “land use, land use change and forestry”. Now, it is not that unusual to plot emissions without “LULUCF”, which can fluctuate from year-to-year based on forestry practices, weather, etc. However, the submission states that Canada intends to include LULUCF in calculating future emissions:

Canada intends to account for the land sector using a net-net approach, and to use a “production approach” to account for harvested wood products. Canada will exclude emissions from natural disturbances.

But that’s only the first problem with the data in the Canadian submission.

The graph uses historical data from the national emissions inventory completed in 2014, which includes data from 1990 through 2012 (data available from the UN). The latest Canadian inventory report, however, was published in April. Every time one of these reports is compiled, the historical emissions are recalculated based on changes in national and international methods.

Here’s the comparison of old and new, straight from the report (red line is the newest data):

Figure 8-1 Canada 2015 NIRLet’s be clear — the recalculation is not subterfuge. Revisiting past calculations is standard practice and takes legitimate effort.

The problem is Canada’s own INDC did not use Canada’s own most recent data. Given the recalculation and the confusion about whether LULUCF is included, the 2030 target is a bit fuzzy.

Here’s a comparison of the possible interpretations of 30% below 2005 levels by 2030.

UntitledThe target could be from 515 to 552 Mt. Semantics? No, the difference is more than half the current emissions from the oil sands. The government itself seems to be confused. Just today, the Environment Minister’s communication person stated the target based on the latest data (749 Mt – 225 Mt = 524 Mt) but excluded LULUCF, which seems incorrect.

There seems to be a basic gap in quality and effort between the very professionally done National Inventory Reports and the seemingly haphazard INDC prepared for the United Nations.

Given how challenging it will be for Canada to meet its target, and how little credibility Canada has right now on climate policy, the federal government needs to straighten all this out.

Weather, climate and the “limiting” nutrient in waterways

Nutrients are a good thing. They promote growth of cells in plants and animals. Food manufacturers love to advertise that their products, like breakfast cereals, are chock-full of “key” or “vital” or “healthy” nutrients.

OLYMPUS DIGITAL CAMERA

In waterways, however, you can have too much of a good thing. Load a lake or an estuary with too much of the nutrient that limits productivity and you might choke the system with algae – the process that scientists call eutrophication because we stink at naming things. All that algae eventually decomposes, or is consumed by other organisms that eventually decompose,  which uses up oxygen crucial to other organisms. That’s a rough explanation of what has happened in the Gulf of Mexico at the mouth of the Mississippi River. Nutrients, particularly nitrogen, leach off agricultural fields and empty into the continental shelf, driving the development of a large “hypoxic” or “dead” zone each summer.

The key issue for the algae is the stoichiometry (again, we stink at naming things) or the ratio of the nutrients: the relative availability of key chemical players like nitrogen (N), phosphorus (P) and silica (Si). Say the ratio of nitrogen to phosphorus in the water is greater than what most algae need; they typically 16 nitrogen”s” for every phosphorus. Then phosphorus becomes the “limiting nutrient”. Add more phosphorus and you should get more growth because there’s already enough nitrogen available. Add more nitrogen, no dice, as there’s not enough phosphorus to match the existing nitrogen levels.

Now, past research has shown that thanks to things like fertilizer loading agricultural soils and groundwater full of nutrients, the key determinant of how much actually ends up flowing down a agricultural river is the weather. For example, a study by myself and Don Scavia showed that a wet fall (which “recharges” the groundwater) in the Midwestern U.S. followed by a wet spring means a large flux of nitrogen down the Mississippi, and all else being equal, a large “dead” zone. But most of that type of runoff and nutrient analysis has focused on individual nutrients, when what really matters to the algae, is the ratio between the nutrients.

11283786-large

Mississippi Delta and northern Gulf of Mexico

A recent paper led by my former student Doris Leong looked sensitivity of the nutrient ratios to variability in runoff, and hence rainfall. The idea was that, since N, P and Si come from different sources and have different solubilities and adsorptive properties, the flow of each nutrient in a watershed may respond differently to a change in rainfall and runoff*. We hypothesized that in an agricultural river basin, where there is a lot of nitrogen in a soluble form in the soils and groundwater, the N:P and N:Si ratio in the river should increase during wetter periods. An analysis using data from across the Mississippi River Basin confirmed the hypothesis, particularly for N:P:

A doubling of the discharge by the Mississippi and Atchafalaya Rivers to the Gulf of Mexico is found to increase the N:P by 10% and the N:Si by 4%. Analysis of data from upstream stations indicates that the N:P increases with discharge in subbasins with intensive row crop agriculture and high fertilizer application rates.

The effect suggests that the weather could influence nutrient limitation productivity downstream. It may also subtly influence the relative abundance of different primary producers (e.g. algae) in river or in the coastal zone. For example, research shows that if N:Si reaches well above 1:1, there can be a shift away from the production of diatoms, which require Si to build their shells.

The results of the paper suggest that, if all else is equal, a wetter climate in the central U.S. would mean higher N:P and N:Si in Mississippi water. It is important to note, however, that all else is unlikely to equal. Changes in agricultural practices, river management, erosion control, etc. will also influence the availability and movement of nutrients. From the conclusion:

The flux of nutrient ratios depends on multiple environmental characteristics of a watershed, including land use, land management, climate and geology, and the river network, and it is difficult to determine the relative importance of these different effects. The dominant nutrient species, sediment transport, presence of dams, as well as in-stream uptake of nutrients, all play a role in controlling the movement patterns of nutrients over the landscape and within rivers. High-resolution data and models that incorporate sediment and dissolved nutrient cycling are needed to understand the multiple factors that influence how nutrient ratios respond to changes in discharge. As future climate change drives an increase in hydrologic variability, the predictability of the response of nutrient ratios to discharge may be important to understanding ecosystem responses to climatic change.

* Technically speaking, we modeled the relationship between river discharge and nutrient load as a power law. Thus the hypothesis was that for a given watershed, the exponent in the power law would be different for N, P and Si.

Emissions of Convenience: The other side of oil spills

The fear of oil spills on Canada’s west coast was heightened by the recent small spill of bunker fuel, basically fuel oil, from a container ship parked in Vancouver’s harbour. Amidst all the furor over the recent spill, one question was missing: What would have happened to that fuel oil if it had not leaked into English Bay?VCRD129_Oil_Spill_20150409

It would have been burned, adding CO2 and a number of air pollutants to the atmosphere.

Transporting goods around the world via ships represents around 3% of global greenhouse gas emissions, roughly the same as air travel, or all of Canada. A recent study by Alice Bows-Larkin and others in Nature Climate Change concluded that shipping emissions are going to continue to grow at a rapid pace into the future despite the availability of technological advancements in ship design and energy sources.

The question of tackling greenhouse gas emissions from shipping will be up for debate at the upcoming meeting of the International Maritime Organization (IMO)’s Marine Environment Protection Committee (May 11-15th, 2015) thanks to a push from a surprising source: the Republic of the Marshall Islands. This small Pacific Islands country may sadly be best known to outsiders as the site of U.S. hydrogen bomb tests in the 1950s.

Why are the Marshall Islands leading the charge for regulation of shipping emissions?

Thanks to the weird system of international shipping in which vessels fly the flag of distant countries in order to avoid regulations, the Marshall Islands is legally the home port of 3,400 large vessels. If you live in Vancouver or another port city, look through some binoculars at the back of the supertankers and container vessels and you will likely see one of three names: Panama, Monrovia (the capital of Liberia), or Majuro, the capital of the Marshall Islands.

Unlike most economic sectors, shipping emissions are not part of the U.N. Framework Convention on Climate Change and thus not part of the emissions total for countries. Under the Kyoto Protocol negotiations, the responsibility for shipping emissions was handed to the IMO, similar to how aviation emissions were made the responsibility of the International Civil Aviation Organization.

Majuro

Flooding in Majuro, 2014 (rtcc.org)

The Marshall Islands is using the leverage of its large ship registry to push for a sector-wide emissions target. With most land less than 2-3m above sea-level, the coral atolls of the Marshall Islands are highly vulnerable to climate change. The damaging “king” tides from last year gave a glimpse of the future of the Marshallese. Here’s Minister of Foreign Affairs Tony de Brum:

We are an island nation and shipping is one of our lifelines – we cannot survive without it.  At the same time, carbon emissions, including those from shipping, pose an existential threat to our people and our country.

Right now, the Marshall Islands and others are jockeying for support within the IMO, especially from neighbouring Pacific Island countries. They could use support from places like Canada, which pays attention to shipping fuel only when it spills into our waters.

The federal government has spoken of making Canada a world leader in oil spill response. The recent budget included $13.9 million to fund research on effective response to oil spills, as well as money to help establish an International Maritime Centre in Vancouver.

The next step is to deal with the oil that ships actually burn.