There are more and more data analysis tools nowadays. Sometimes people are so obsessed with these numbers and could bump into the traps unconsciously. As pointed out by Avinash Kaushik in his post “Excellent analytics tip #23: aligh hits, sessions, metrics, dimensions”, one big mistake is to match hit-and session-level metrics and dimensions.
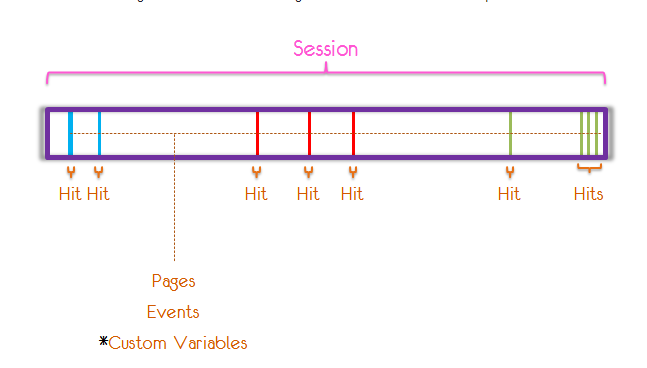
Hit is an individual interaction that you have with the site, yet it can also be an event or a customer variable (if the scope is set to “hit level”). Session, instead, is collecting those hits into one cohesive experience, as shown in the figure below.
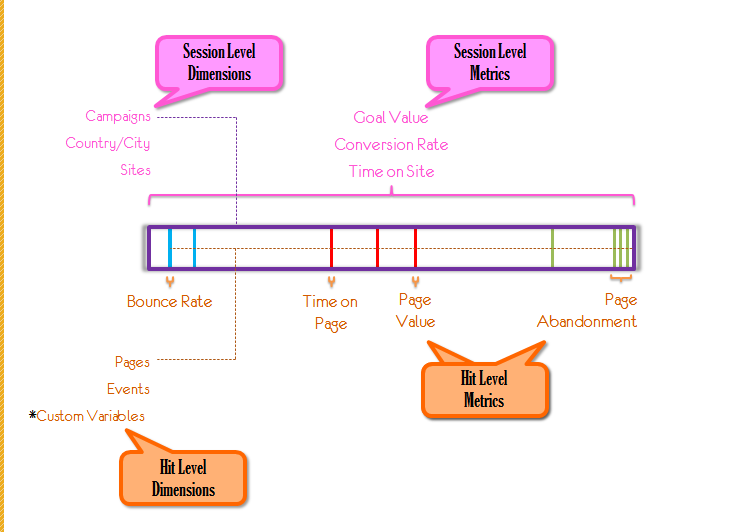
Accordingly, both dimensions have their own metrics: time on page, bounce rate, page value, page abandonment rate etc for the hit, while visits, pages/visit, average visit duration, per visit goal value, cost per acquisition etc. are for the session. These metrics could only correctly measure, and can only accurately be used to reports when they are matching with the dimensions. Otherwise, the following bunch of actions based on the wrongly analyzed data would be nonsense. The following picture provided by Avinash illustrates it clearly.
However, here comes the question: to segment our customers/visitors accurately, we not only need data on hit- or session-level, but from the user-level. We need to find out how many visitors I get, which is totally different from how many visits I get. For example, a consumer visited the website yet doesn’t but anything that day, yet three days later he returned and purchased large sums of goods. How can you analyze this conversion rate using the hit- or session-level metrics?
Fortunately, we have now such power. As posted in Avinash’s blog, Google Analytics is capable to do analysis on three levels: user, session and hit (as shown below)
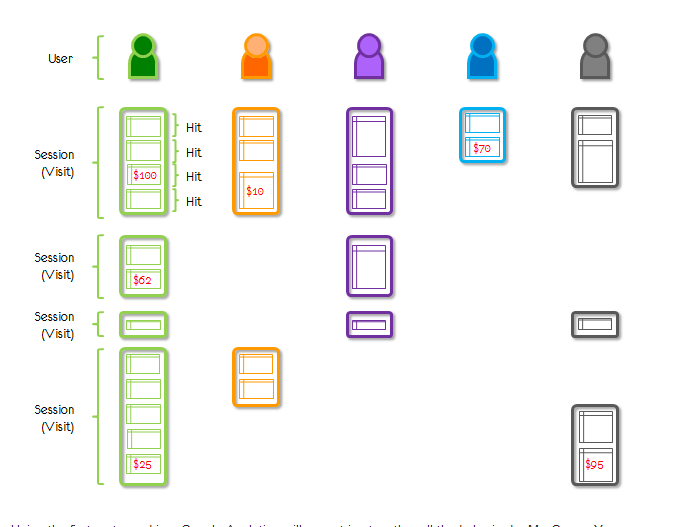
From the user level, you could easily find out answers to which one purchased the most and similar questions. Or you can identify the owned, earned and paid sources that are more likely to drive conversion rates using data from the session level. The same applies to the hit-level data, which you could utilize in site design, improving internal site search and so on.
What’s more, another cool new capability in GA is to do cohort analysis. It could create a unique group of customers that share a commonality.
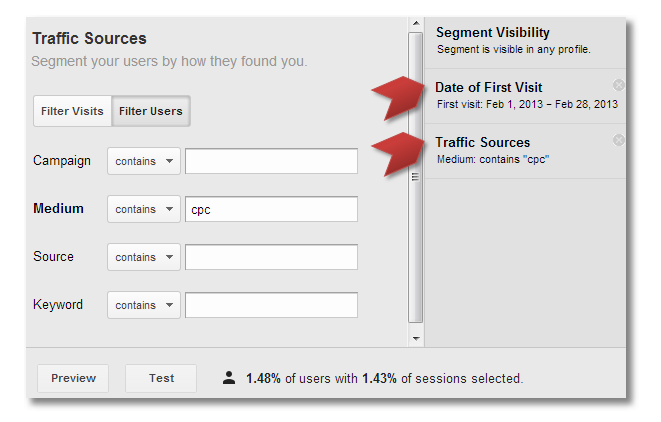
As you see in the figure above, now you can analyze the behavior of this group of people and understand what content they consumed (across visits), what products they might have purchased, how much more social amplification they created (compared to a cohort of users whose first visit to the site was in Feb via organic search!), and other such delightful things. This is especially helpful when you are determining whether a new search strategy, an upgraded AdWords/ AdCenter account structure and other changes are successful.
This technological advance in data analysis is no doubt consistent with the essence of marketing—consumers. The priority from sessions and hits to users can be quite powerful as in today’s business you should focus on a relationship, rather than a single transaction. That’s exactly what the relationship marketing is about.
Sources:
1. Avinash Kaushik (March, 2013). Excellent analytics tip #23: aligh hits, sessions, metrics, dimensions”
Retrieved from
http://www.kaushik.net/avinash/hits-sessions-metrics-dimensions-web-analytics/
2. Avinash Kaushik (September, 2013). Google Analytics visitors segmentation: users, sequences, cohorts!
Retrieved from
http://www.kaushik.net/avinash/google-analytics-visitor-segmentation-users-sequences-cohorts/