We talked about the importance as well as the difficulty in marketing attribution in the earlier post, and now we’ll learn how to uncover the marketing impact of these murky channels. Paul shared his opinions about it in the last session and it would be great to integrate the process better.
Anto Chittilappilly, CTO of the Visual IQ, a marketing intelligence firm that helps companies more efficiently spend their marketing budgets, just shared his insights in the marketing attribution process. http://www.marketingsherpa.com/article/how-to/8-steps-to-measure-impact
Step 1: Define your goal
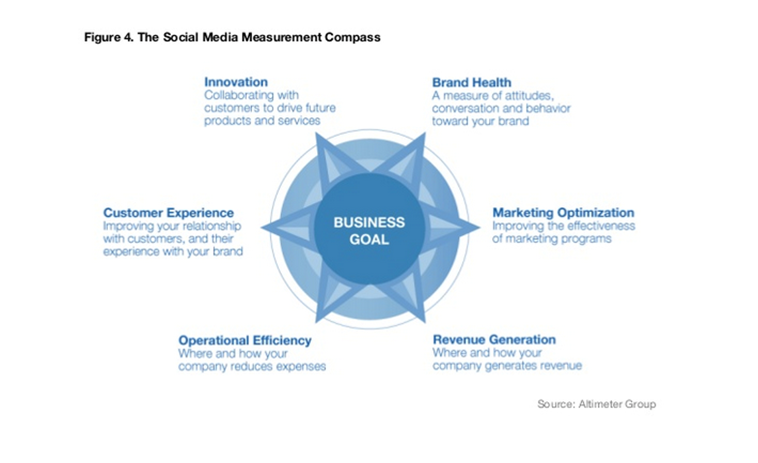
As explicated by Paul, the first question you should ask yourself is “why do I want to do this?’. You will get more insights in the data by defining business objectives and identifying required insights. For example, the figure below shows the various objectives for the social media.
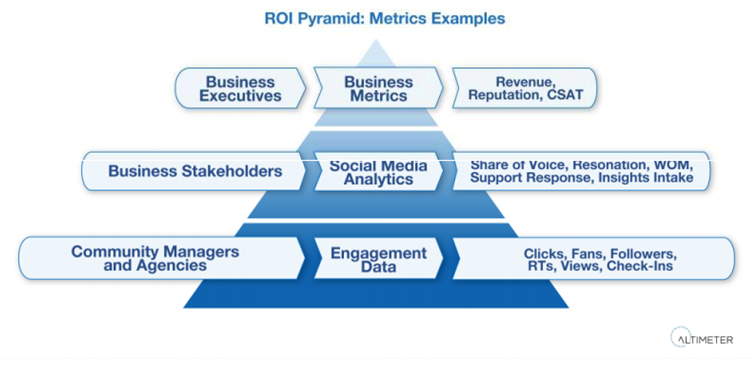
While the article didn’t point out it clearly, I believed that after the identification of business objectives, you should divide the objective into distinct and measurable metrics, or the KPI (Key Performance Indicator). A point worth mentioning is that for different stakeholders, there’d better specific objectives and metrics for them as shown in the figure below.
Step 2: Get executive support
This step is more practical, considering the impacts of multi-exposure attribution, especially if your marketing team has several departments (e.g. social media, print media, SEO).
Step 3: Collect the data
This is arguably the hardest step. While data from online channels is easier to get utilizing data analysis software, getting data from offline channels could be challenging. They normally have aggregate attributes such as Gross rating point and costs. You need to combine this with your customer data as well as third party demographic data.
Step 4: Analyze data on a user level
It is important to analyze data on a user-by-user basis so that you could identify high- and low-value customers. The data could be categorized into:
– User-level conversions and impressions
Channels offering this data show exactly who saw your ads, and exactly who converted.
– User-level conversions only
This type gives limited insight into who saw the ads, but clearly shows who converted. For example, it is easy to track response from a billboard with a unique phone number and a call to action, but it is only possible to estimate its total impressions.
– No user-level data
In these cases Chittilappilly’s team uses panels, surveys and sampling to gauge conversions and impressions
Step 5: Create cross-channel metrics
Television, online advertising, social media and email marketing all have its own reporting metrics, therefore it requires marketers to create universal metrics for comparison.
Two examples that Chittilappilly’s team uses:
– Initial action rate
This metric roughly translates to “clickthrough rate” when applied to online channels, but it is also applicable to offline channels. Any advertisement that causes a consumer to act — perhaps by searching online, contacting a company or clicking an ad — is said to have caused an action.
– End action rate
This metric roughly translates to “conversion” rate, and represents the percentage of people who an ad reached and who fulfilled the ultimate goal of that advertisement.
Step 6: Identify trends
Now it is time to figure out what is behind the data. We should identify which marketing touch points are driving people to high value conversions, as well as the attributes of those touch points.
Attributes might include:
–Type of media
–Frequency
–Time lag
–Offer
–Time of day
Of course, these attributes are likely to have different degrees of impact on purchase intent. Thus you should be able to see which attributes have the most marketing impact, and to numerically compare that impact to other attributes you’ve analyzed, therefore weighing the attributes.
Once the data is analyzed, Chittilappilly’s team creates a set of “true metrics” for each marketing channel to tell marketers how many conversions, impressions and actions each channel truly drove. For example, channels through which conversions are not completed might have a positive conversion rate if they’re statistically shown to improve conversion rates in other channels. These metrics are used to compare channels and optimize a team’s marketing spend.
Step 7: Continually measure and tweak
Keep on collecting new data, adding it to your data base and crunching it. You could utilize them to examine your initial analysis result.
Step 8: Wait for results
Although you can have this process up and running within three to four weeks, have patience. Chittilappilly suggests waiting at least three to four months before seriously considering the results.
Quite a huge project, huh? Fortunately, in our project, the multi-exposure attribution is rarely the case given the small scale of media for Special Olympics of British Columbia. Actually, we adopt the A/B test and experiments with control group to explore our hypotheses, which is no doubt easier.
The real-life case is always a good way to understand and adapt what you have learnt. Below is a case study from Harvard Business Review about attribution model. Take a look and post your comments.
Wes Nichols, “Advertising Analytics 2.0,” Harvard Business Review; March 2013, Vol. 91 Issue 3, pp. 60-68