Use niche keywords to boost search traffic


http://www.marketingcharts.com/wp/television/traditional-media-delivers-low-quantity-but-highest-quality-leads-say-b2b-marketers-25109/

What do you see? Or let’s examine it further.

https://www.marketingsherpa.com/article/search-is-generating-bulk-b2b

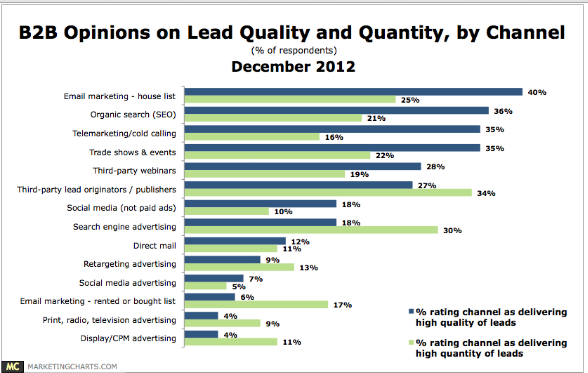
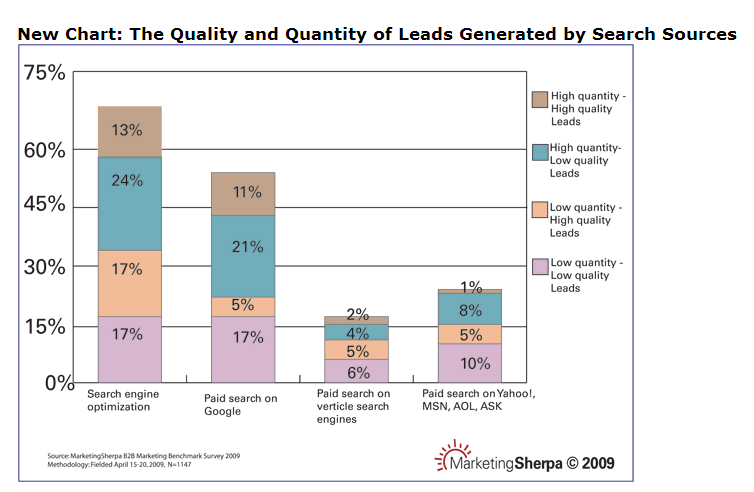
Firstly, the success of a marketing program shouldn’t be judged merely by the quantity, which is often the case, but also the quality of leads produced. And secondly, Search Engine Optimization (SEO) plays an increasingly important role in balancing lead flows because, in many cases, the spigot can be opened or closed to control volume. With regard to the lead quality, marketers should adopt a much more strategic approach to optimizing web pages, carefully aligning the context of keywords with your pages.

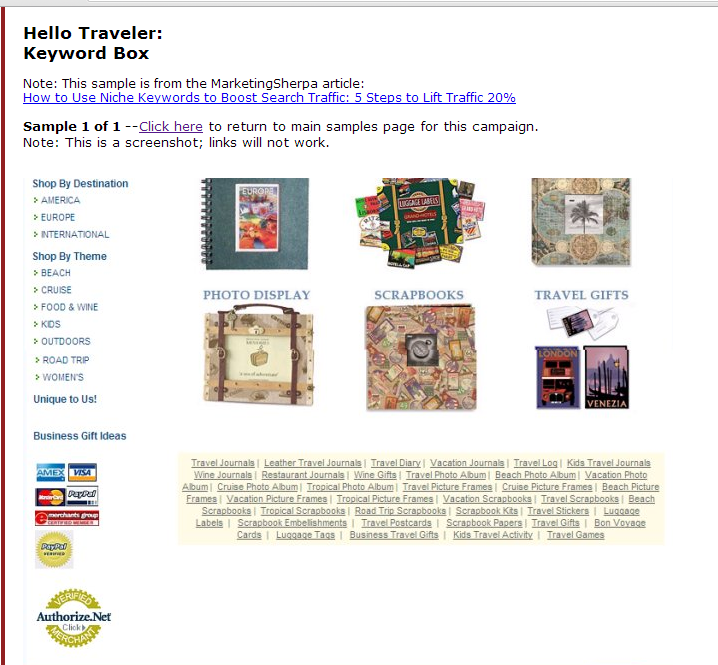
So how to select the keywords? Below is an example of a company called Hello Traveler, which sells travel journals and scrapbooks. However, the competition for general keywords like “travel journey” is stiff– Hello Traveler could hardly get on page 2.

Why not looking into niche keywords?


Step 1: look at inventory and site organization

To begin with, you should start with an examination of your company and try to segment products. In Hello Traveler’s case, they dug into their inventory and made a list of product categories that met the following criteria:

  • Products they sold or could easily sell
  •  Products with less competition
  •  Products that consumers were searching for

And then they came up with a list of categories, such as “beach picture frame” and “cruise photo album”


Step 2: Research the categories

Firstly, check search results and see how many results the words receive in search sites like Google. Obviously, avoid keywords with higher numbers. Apart from the numbers, check the frequency as well. Make sure the keywords are searched for often enough to merit attention. Lots of free search keyword tools are available.

Google Adwords: Keyword Tool:
https://adwords.google.com/select/KeywordToolExternal

WordTracker – free keyword suggestion tool:
http://freekeywords.wordtracker.com/


Step 3: select winners and start grouping

Choose the keywords, or sub-categories that have limited competition but are being searched for regular enough. Then, organize your products based on these categories

As we mentioned in the class about monitoring, you may find new business opportunities in this process. For example, after seeing that people were searching for food and wine travel journals, Hello Traveler decided to “flesh this out into an actual category. We looked around and found enough in the way of food and wine journals, and some other wine ‘gifty’ stuff, to create an actual category.”


Step 4: Create category pages

Then create webpages for each of the new product category. One thing worth mentioning is that

each product page should have at least three sentences of SEO text at the top that describes the category. Also, make sure you include short text descriptions for each product. When the page is spidered by a search engine, you want sufficient content relevant to the keyword.

For example, Hello Traveler’s ‘kid travel activity’ section reads as follows under its primary navigation bar: “The unique perspective of children is always worth chronicling. Because of that, we offer a nice selection of kid’s travel journals, travel games and activity books. You’ll also sometimes find a travel picture frame or vacation photo album designed for the younger set.”


Step 5: Place links on your homepage

The last step is to create links to the category from your homepage. An sample from Hello Traveler is provided blow.


Resources:
1. Traditional Media Not A Good Source of Leads, Say B2B Marketers
Retrieved from http://www.marketingcharts.com/wp/television/traditional-media-delivers-low-quantity-but-highest-quality-leads-say-b2b-marketers-25109/
2. New Chart: Search is Generating the Bulk of B2B Leads – But How Good are They?
Retrieved from
https://www.marketingsherpa.com/article/search-is-generating-bulk-b2b
3. How to Use Niche Keywords to Boost Search Traffic: 5 Steps to a 20% Lift
Retrieved from
http://www.marketingsherpa.com/article/how-to/5-steps-to-20-lift#


Marketing attribution 2

We talked about the importance as well as the difficulty in marketing attribution in the earlier post, and now we’ll learn how to uncover the marketing impact of these murky channels. Paul shared his opinions about it in the last session and it would be great to integrate the process better.

Anto Chittilappilly, CTO of the Visual IQ, a marketing intelligence firm that helps companies more efficiently spend their marketing budgets, just shared his insights in the marketing attribution process. http://www.marketingsherpa.com/article/how-to/8-steps-to-measure-impact

Step 1: Define your goal

As explicated by Paul, the first question you should ask yourself is “why do I want to do this?’.  You will get more insights in the data by defining business objectives and identifying required insights. For example, the figure below shows the various objectives for the social media.

While the article didn’t point out it clearly, I believed that after the identification of business objectives, you should divide the objective into distinct and measurable metrics, or the KPI (Key Performance Indicator). A point worth mentioning is that for different stakeholders, there’d better specific objectives and metrics for them as shown in the figure below.

Step 2: Get executive support

This step is more practical, considering the impacts of multi-exposure attribution, especially if your marketing team has several departments (e.g. social media, print media, SEO).


Step 3: Collect the data

This is arguably the hardest step. While data from online channels is easier to get utilizing data analysis software, getting data from offline channels could be challenging. They normally have aggregate attributes such as Gross rating point and costs. You need to combine this with your customer data as well as third party demographic data.


Step 4: Analyze data on a user level

It is important to analyze data on a user-by-user basis so that you could identify high- and low-value customers. The data could be categorized into:

– User-level conversions and impressions
Channels offering this data show exactly who saw your ads, and exactly who converted.
– User-level conversions only
This type gives limited insight into who saw the ads, but clearly shows who converted. For example, it is easy to track response from a billboard with a unique phone number and a call to action, but it is only possible to estimate its total impressions.
– No user-level data
In these cases Chittilappilly’s team uses panels, surveys and sampling to gauge conversions and impressions


Step 5: Create cross-channel metrics

Television, online advertising, social media and email marketing all have its own reporting metrics, therefore it requires marketers to create universal metrics for comparison.

Two examples that Chittilappilly’s team uses:
– Initial action rate
This metric roughly translates to “clickthrough rate” when applied to online channels, but it is also applicable to offline channels. Any advertisement that causes a consumer to act — perhaps by searching online, contacting a company or clicking an ad — is said to have caused an action.
– End action rate
This metric roughly translates to “conversion” rate, and represents the percentage of people who an ad reached and who fulfilled the ultimate goal of that advertisement.


Step 6: Identify trends

Now it is time to figure out what is behind the data. We should identify which marketing touch points are driving people to high value conversions, as well as the attributes of those touch points.

Attributes might include:
–Type of media
–Frequency

–Time lag
–Offer
–Time of day

Of course, these attributes are likely to have different degrees of impact on purchase intent. Thus you should be able to see which attributes have the most marketing impact, and to numerically compare that impact to other attributes you’ve analyzed, therefore weighing the attributes.

Once the data is analyzed, Chittilappilly’s team creates a set of “true metrics” for each marketing channel to tell marketers how many conversions, impressions and actions each channel truly drove. For example, channels through which conversions are not completed might have a positive conversion rate if they’re statistically shown to improve conversion rates in other channels. These metrics are used to compare channels and optimize a team’s marketing spend.


Step 7: Continually measure and tweak

Keep on collecting new data, adding it to your data base and crunching it. You could utilize them to examine your initial analysis result.


Step 8: Wait for results

Although you can have this process up and running within three to four weeks, have patience. Chittilappilly suggests waiting at least three to four months before seriously considering the results.

Quite a huge project, huh? Fortunately, in our project, the multi-exposure attribution is rarely the case given the small scale of media for Special Olympics of British Columbia. Actually, we adopt the A/B test and experiments with control group to explore our hypotheses, which is no doubt easier.

The real-life case is always a good way to understand and adapt what you have learnt. Below is a case study from Harvard Business Review about attribution model. Take a look and post your comments.


Wes Nichols, “Advertising Analytics 2.0,” Harvard Business Review; March 2013, Vol. 91 Issue 3, pp. 60-68

Marketing metrics 1

The session 6 talked about the measurement of e-marketing, which intrigues me a lot. Since what I have learnt is more about qualitative analysis and strategy in the early phase, instead of the implementation and measurement in the later phase.

An article I find interesting focuses on the marketing metrics for channel attribution process. http://sherpablog.marketingsherpa.com/research-and-measurement/analytics-capturing-why-customers-buy/ Based on the different contribution rates of various media channels, you could attribute the limited marketing budgets to its best. The attribution models are the tools that could help you evaluate the effectiveness of channels. Below are some common models (from Google Analytics https://support.google.com/analytics/answer/1665189?hl=en):

  • The Last Interaction model

The Last Interaction model attributes 100% of the conversion value to the last channel with which the customer interacted before buying or converting.

When it’s useful: If your ads and campaigns are designed to attract people at the moment of purchase, or your business is primarily transactional with a sales cycle that does not involve a consideration phase, the Last Interaction model may be appropriate.

  • The Last Non-Direct Click model

The Last Non-Direct Click model ignores direct visits and attributes 100% of the conversion value to the last channel that the customer clicked through from before buying or converting. Google Analytics uses this model by default when attributing conversion value in non-Multi-Channel Funnels reports.

When it’s useful: Because the Last Non-Direct Click model is the default model used for non-Multi-Channel Funnels reports, it provides a useful benchmark to compare with results from other models.

In addition, if you consider direct visits to be from customers who have already been won through a different channel, then you may wish to filter out direct visits and focus on the last marketing activity before conversion.

  • The Last AdWords Click model

The Last AdWords Click model attributes 100% of the conversion value to the most recent AdWords ad that the customer clicked before buying or converting.

When it’s useful: If you want to identify and credit the AdWords ads that closed the most conversions, use the Last AdWords Click model.

  • The First Interaction model

The First Interaction model attributes 100% of the conversion value to the first channel with which the customer interacted.

When it’s useful: This model is appropriate if you run ads or campaigns to create initial awareness. For example, if your brand is not well known, you may place a premium on the keywords or channels that first exposed customers to the brand.

  •  The Linear model

The Linear model gives equal credit to each channel interaction on the way to conversion.

When it’s useful: This model is useful if your campaigns are designed to maintain contact and awareness with the customer throughout the entire sales cycle. In this case, each touchpoint is equally important during the consideration process.

  • The Time Decay model

If the sales cycle involves only a short consideration phase, the Time Decay model may be appropriate. This model most heavily credits the touchpoints that occurred nearest to the time of conversion.

When it’s useful: If you run one-day or two-day promotion campaigns, you may wish to give more credit to interactions during the days of the promotion. In this case, interactions that occurred one week before have only a small value as compared to touchpoints near the conversion. The Time Decay model allows you to appropriately credit touchpoints during the day or two leading up to conversion.

  • The Position Based model

The Position Based model allows you to create a hybrid of the Last Interaction and First Interaction models. Instead of giving all the credit to either the first or last interaction, you can split the credit between them. One common scenario is to assign 40% credit each to the first interaction and last interaction, and assign 20% credit to the interactions in the middle.

When it’s useful: If you most value touchpoints that introduced customers to your brand and final touchpoints that resulted in sales, use the Position Based model.


However, easier said than done. The real-life situation can be more complicated.

Imagine this. Tim first interacted with my brand when his friend shared a product review on Facebook. Then he visited my Facebook page to dig more, and left. Weeks later, Tim saw my new product on the Facebook page and was quite interested. He opened the Google.com to compare similar products and a PPC ad appeared to convince his choice. Later he decided to search for some promotion code so that he could get a good bargain. Finally, he used the code from an affiliate and completed the transaction on my website.

Many marketers looking at this process will attribute the sale to the natural search and/or affiliate channel, since the customer found the brand in natural search and converted through an affiliate promotion. Moreover, the models above rely on Web cookies, which cause underrepresentation on social media and other mediums that are frequently accessed from mobile apps and offline channels. Therefore, while some channels didn’t result the channels directly, they are indispensable distributors of the sale.

In the next post, we’ll handle the issue in more details.

Data analysis on social media

Use in social media is soaring. Over 900 million people worldwide check their Facebook account on a month account, while there are more than 150 million active users in Twitter. And LinkedIn has claimed that it had more than 160 million users, with two new members joining every second.

More and more people are offering up posts and tweets about their likes and dislikes. The idea of using this data for consumer insights is increasingly enticing to marketers. They are listening to what is being said about their products, brands and competitors, plucking the latest trend, and searching for ways to take advantage of all this data.

This reminds me of what we are taught in the course of E-business Strategy. The Internet provokes 1st and 2nd order effects. The 1st order effect brings in increased efficiency and effectiveness by reducing transaction costs, as we see in ebay. What’s interesting is the 2nd order effect, which is a qualitative shift with unintended consequences. Take the example of GHX in Canada. GHXC tries to integrate the suppliers and hospitals in the same platform for opener and more efficient transactions. Yet GHXC is more than just an exchange, it’s a resource for business intelligence: it could offer vastly new services such as demand forecasting, benchmarking, market trend analysis etc, namely, the 2nd order effect.

However, these social media are not so interested in the companies to the same extent. They are slow in making data analysis and reluctant to share information with firms. In the post of “Why Social Networks Are Cool on Sharing (Their Data)”, Jack Neff identified three reasons for this. Firstly, they have not yet figured out a “value exchange” that would make consumers or business professionals willing to trade their personal data. Another one is the intensifying privacy concerns. Anyway, no one enjoys being watched 24-7 by the “big brother”. Most importantly, they are more focused on the advertising than the less lucrative market research. According to the American Marketing Association’s Honomichl Report, the annual U.S. revenue in market research is $ 17 billion to $ 18 billion in recent years, far less than the $ 130 billion to $ 150 billion spent last year in advertising research. Just like any other form of media, such as print, TV, magazines, the revenue in advertising is the key issue.

Another reason for this in my opinion is that the data in social media is far more complicated and fragmented than these specialized B2C websites. With millions of users and numerous casual data, it can be so difficult for the social media to fully process what is feasible in regard to capturing, managing, analyzing and creating social intelligence in order to take action on this user-generate content.

So what could companies do then? Fine-tune their ability to monitor social media network is clearly under way for many companies, as we discussed in the class. But in Judith Aquino’s post of “Transforming Social Media Data into Predictive Analytics”, he argued that companies should go one step further, fusing social media with predictive. A good example will be MTV’ss new show “Teen Wolf”. MTV turned to Networked Insights, a professional social analytics firm, for help

fine-tuning its market efforts. Based on the social conversations about Teen Wolf and other teen topics that the analytics firm tracked on Facebook and Twitter, Networked Insights provided several insightful suggestions for MTV. The show turned out to be a big hit, attracting a total of 2.17 million views. As said by Burrel, MTV’s vice president of consumer marketing, “Teen Wolf was probably the best social engaged-type program that we had put together because we were using social data and social insights to help drive marketing decisions. “

This is just a tip of the iceberg. Social analytics firms like Networked Insights are booming and helping companies to better tap into the social intelligences. However, despite the promises, there are several pitfalls to keep in mind. Firstly, the comments on social media networks represent the perceptions of only one portion of a company’s customer base, or even their target customers seldom use social media. Therefore, it is important to have a good understanding of your target customers at the very beginning, and then look carefully at the audience mix in social media and determine if it is the target group. Anyway, it is not always fans who are following you. Furthermore, some companies are so relying on software analytics that they neglect the context and nuances of how people feel and what they really mean in a conversation. It is important to bear in mind that social media is a dialogue and relationship venue; the deepest value comes from actually having conversations with your customers, listening patiently and respectfully.

In a word, social data is an additional, powerful tool in the marketing tool pool, not a replacement, not to mention a cure-all.


Resources:
1. Jack Neff (May, 2011). “Why Social Networks Are Cool on Sharing (Their Data)”
Retrieved from http://adage.com/article/digital/social-networks-cool-sharing-data/227337/
2. Judith Aquino( November, 2013). “Transforming Social Media Data into Predictive Analytics”
Retrieved from
http://www.destinationcrm.com/Articles/Editorial/Magazine-Features/Transforming-Social-Media-Data-into-Predictive-Analytics-85687.aspx


From visits to visitors


There are more and more data analysis tools nowadays. Sometimes people are so obsessed with these numbers and could bump into the traps unconsciously. As pointed out by Avinash Kaushik in his post “Excellent analytics tip #23: aligh hits, sessions, metrics, dimensions”, one big mistake is to match hit-and session-level metrics and dimensions.

Hit is an individual interaction that you have with the site, yet it can also be an event or a customer variable (if the scope is set to “hit level”). Session, instead, is collecting those hits into one cohesive experience, as shown in the figure below.

Accordingly, both dimensions have their own metrics: time on page, bounce rate, page value, page abandonment rate etc for the hit, while visits, pages/visit, average visit duration, per visit goal value, cost per acquisition etc. are for the session. These metrics could only correctly measure, and can only accurately be used to reports when they are matching with the dimensions. Otherwise, the following bunch of actions based on the wrongly analyzed data would be nonsense. The following picture provided by Avinash illustrates it clearly.


However, here comes the question: to segment our customers/visitors accurately, we not only need data on hit- or session-level, but from the user-level. We need to find out how many visitors I get, which is totally different from how many visits I get. For example, a consumer visited the website yet doesn’t but anything that day, yet three days later he returned and purchased large sums of goods. How can you analyze this conversion rate using the hit- or session-level metrics?

Fortunately, we have now such power. As posted in Avinash’s blog, Google Analytics is capable to do analysis on three levels: user, session and hit (as shown below)


From the user level, you could easily find out answers to which one purchased the most and similar questions. Or you can identify the owned, earned and paid sources that are more likely to drive conversion rates using data from the session level. The same applies to the hit-level data, which you could utilize in site design, improving internal site search and so on.

What’s more, another cool new capability in GA is to do cohort analysis. It could create a unique group of customers that share a commonality.


As you see in the figure above, now you can analyze the behavior of this group of people and understand what content they consumed (across visits), what products they might have purchased, how much more social amplification they created (compared to a cohort of users whose first visit to the site was in Feb via organic search!), and other such delightful things. This is especially helpful when you are determining whether a new search strategy, an upgraded AdWords/ AdCenter account structure and other changes are successful.

This technological advance in data analysis is no doubt consistent with the essence of marketing—consumers. The priority from sessions and hits to users can be quite powerful as in today’s business you should focus on a relationship, rather than a single transaction. That’s exactly what the relationship marketing is about.

Sources:

1. Avinash Kaushik (March, 2013). Excellent analytics tip #23: aligh hits, sessions, metrics, dimensions”

Retrieved from

http://www.kaushik.net/avinash/hits-sessions-metrics-dimensions-web-analytics/

2. Avinash Kaushik (September, 2013). Google Analytics visitors segmentation: users, sequences, cohorts!

Retrieved from

http://www.kaushik.net/avinash/google-analytics-visitor-segmentation-users-sequences-cohorts/

Keeping your Twitter service open two hours longer

A research analysis of 35 top airline brands on Twitter conducted by WaveMetrix showed how staying open two hours later could result in a drastic improvement in customer service, almost a 25% boost. (http://wave.wavemetrix.com/content/airlines-show-how-keeping-your-twitter-service-open-two-hours-longer-can-boost-i-01101)

Social media such as Facebook and Twitter has become a powerful tool for customer relationship management these days. As we discussed about the funnel in class, more and more companies are shifting from the “traditional” shape to the “trumpet” one.

In today’s fast-pacing world, people are getting increasingly impatient and place high priority on time. Providing prompt assistance for customers during and after the purchase could not only contribute to building loyalty and repeat purchases (keep customers), but also driving positive purchase intent buzz and attracting new customers (grow customers). The latter is particularly obvious for the social media since they are transparent and open to everyone in the world. Thus companies which deal with customer responses timely and appropriately will no doubt possess competitive advantages. Just consider the negative example of “broken guitar” in United Airline.

Yet there are numerous comments and responses every day, given the limited resources and time, how to tackle them effectively and efficiently? The social media “triage”, a response model we discussed in class provides a good answer as shown below.


But what we’d like to discuss now is from another perspective—data analysis. As we see in the article “airlines show how keeping your Twitter service open two hours longer can boost its customer service effectiveness by 25%”, 77% consumers tweet at airline brands fairly consistently from 9 a.m to 9 p.m. Since normally airlines’ Twitter services end on 5 p.m, consumers who post in the evening tend to be kept waiting, sometimes over 6 hours. And the next day when community managers start working, they have such a backlog of tweets to deal with. What’s worse, it triggers a knock-on effect for dealing with new tweets throughout the day, decreasing the customer service effectiveness largely.

So what could we do with these data? Clearly, 24-7 Twitter service providing a consistent service whatever the time proves to be a good way, such as DeltaAssist. Yet 24-7 service may be beyond some airlines with limited resources. Based on the data analysis, extending from 5 p.m to 7 p.m could easily result in greatly increased effectiveness. Actually, 21% of all those kept waiting for over 6 hours for a response tweeted between 5 p.m and 7 p.m. Just a little change, you could left your competitors far behind. This is exactly the happy middle EasyJet and AirFrance adopted.

The data analysis of your customers bring our attention to the macro principles of e-marketing as stressed in our first lecture—the POST framework. Apart from the traditional segmentation criteria such as socio-demographics and psychographics, the advent of Internet and social media brings in the new technographics / socialgraphics criteria.

–Where are your customers online?

–What are your customers’ social behaviors online?

–What social information or people do your customers rely on?

–What is your customers’ social influence? Who trusts them?

–How do your customers use social technologies in the context of your products?

Or in the airline case, when are your customers online. Learn to watch and get a deeper understanding of your customers with the advanced data analysis technologies. Then based on such understanding, develop corresponding strategies. For example, many B2C websites will analyze the buying habits of their customers, and then recommend relevant products to them. If you just buy a flight ticket to Hawaii in Kayak, you could receive the emails about discount or coupons for hotels or car renting in Hawaii a few days later. There are lots of analysis tools such as Google Adwords, Google Analytics and so on, which I will cover in the following posts.

However, this analysis only focuses on the Twitter services. As we know, airlines mostly adopt various customer service management channels, such as e-mails, telephone, facebook etc, both online and offline. Therefore, we have no clue at the moment whether airlines that only provided limited Twitter service provide 24-7 telephone service or else. It is highly possible that customers could still get high satisfaction by making a call. Furthermore, we also don’t know the percentage of customers using Tweet service. If it is just a small or even tiny percent, airlines do have a reason not to put too much effort on this channel. Of course, there is no denying that Tweet users are booming and airlines could by no means neglect this channel. This poses an interesting topic about the integration of various CRM channels, which we will explore in the later posts.


Reference:

Ed Bristow (August, 2013). Airlines show how keeping your Twitter service open two hours longer can boost its customer service effectiveness by 25%.  Retrieved from

http://wave.wavemetrix.com/content/airlines-show-how-keeping-your-twitter-service-open-two-hours-longer-can-boost-i-01101