
- Home
- Assessment & Feedback
- Grading & Learning Analytics
Grading
This section describes best practices for grading student work.
Setting up Assessments in Canvas
Use the built-in Canvas features to make marking and calculating grades easier
Assignments
The following can be configured in every Canvas assignment:
- the number of points
- how the grade is displayed (i.e. points, percentage, complete / incomplete)
- whether the assignment counts towards the student’s final grade
Quizzes
Every Classic Quiz created is set as a “Graded Quiz” by default. This means that instructors must indicate a correct answer for each question.
Alternatively, a “Graded Survey” can be used to collect responses which do not need to be marked — anyone who submits will get full credit.
Group Weights
Instructors can create different “groups” within Assignments to organize student tasks.
A weight can be configured for each group. For example, there can be a “Midterm” group worth 25% of the student’s grade.
Canvas will follow these values to calculate each student’s final mark accordingly.
For instructions on how to add group weights, please see here: How do I weight the final course grade based on assignment.
SpeedGrader
SpeedGrader allows instructors to view and grade assignment submissions in one place. It makes evaluating assignments quick and easy. NOTE: multiple people should not grade assignments at the same time, because SpeedGrader does not automatically update with the latest information for each submission.
Interface
Using SpeedGrader, instructors can quickly:
- See how many assignments have been graded so far
- See the average score for the class
- Cycle through each student’s work
- Annotate student work
- Add comments and feedback
Learning Analytics
Learning Services at UBC Sauder is on a never-ending journey to increase our capacity to collect, measure, and analyze learning data, all in the service of more informed teaching and learning decision-making across the school and, ultimately, faculty and student success.
The research and practice of learning analytics continue to evolve in the presence of learning technology environments. These digital environments create “trace data” (i.e., records of activity) that will never show the whole picture about the learner experience but can be useful nonetheless. Techniques and tools developed in the field of learning analytics provide insights that allow continuous improvement of teaching and learning.
Examples of How We Can Help
- Guide the process of embedding data-driven decision-making into current teaching practices
- Help explore what data is available to answer questions about teaching and learning in courses, cohorts, and programs
- Suggest practices in course design and tool selection that will provide data that answers questions about teaching and students
- Develop reports to make sense of existing but disparate data or to extend the reporting built-in to Canvas
Our Approach
We believe in helping you answer questions about your students and courses, and do so in various ways. We can help you understand what tools are currently available at UBC, such as Canvas New Analytics.
When Sauder instructors have new questions, we work with them to determine: what data is (or isn’t) available from Canvas, how to access that data, and what it can (or can’t) tell you. This may take the form of a quick conversation, one-off analysis, or developing a pilot project to answer your specific questions.
We believe in an iterative approach to Learning Analytics that allows us to help you answer your questions and where possible develop tools that will help others answer those same questions as well. Wherever possible we believe in an open-source approach to the development of our tools. Below are two examples of projects where we have expanded from an individual question to the development of dashboards that may provide useful insights into student activity.
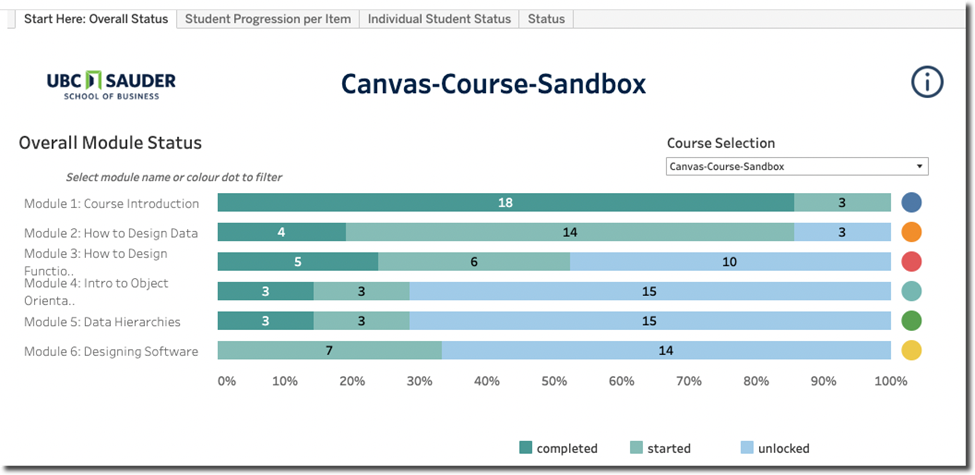
Canvas Module Progress
With Canvas, you can create module requirements and track student progress through Canvas Module Progress. However, the Canvas interface only allows you to view the progress of individual students and not the entire class. In this case, we have developed a dashboard to view student progress at the individual level or the class level.
An interactive demonstration version of this dashboard is available here.
Get Help – For access to the Canvas Module Progress dashboard for your course or any questions about Learning Analytics, please contact Jonathan Bird, Learning Services Learning Eco-Systems Support and Solutions Manager at jonathan.bird@sauder.ubc.ca
Video Analytics
If you use Panopto for your course recordings or sharing media with your class, we are working to develop useful dashboards and visualizations to analyze and understand student engagement. This project is still in the development phase, but we would be happy to collaborate to improve our existing tools alongside you and to explore what questions you may want to answer about student engagement with your videos.
Getting Help
For more information, please contact our Learning Services team by emailing help@sauder.ubc.ca.