In-class mapping exercise. An eagle’s flight path over time. Eventually the eagle left the site and flew off into the forest.

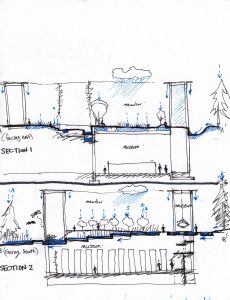
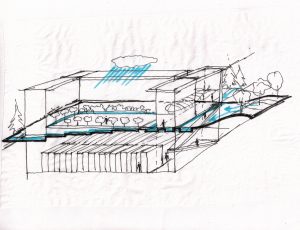
A visit to Beaty Biodiversity Museum. I started with a plan of wetness and jotting down observations. The two sections and axonometric show how water moves through the site.

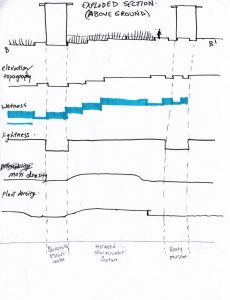
A map of environmental conditions across a site section, cutting through the stormwater feature. The map shows how the environmental conditions influence plant density across the site. The y-axis for lightness and density plots relative quantities.