In Class Exercise – documenting my apartment

Take Home Assignment – Analysing the CIRS building on campus

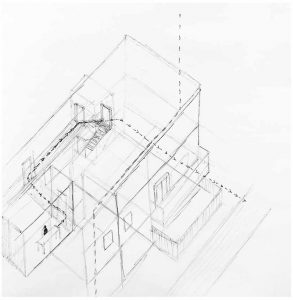
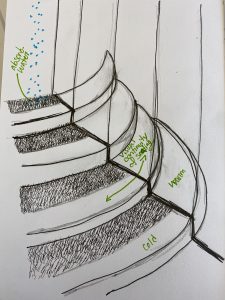
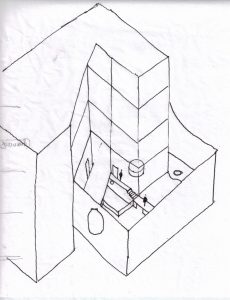
looking at light and shade on the interior staircase
where does the light come from

building systems, water flow and green systems
In Class Exercise – documenting my apartment
Take Home Assignment – Analysing the CIRS building on campus
looking at light and shade on the interior staircase
where does the light come from
building systems, water flow and green systems
In-Class Exercise

CIRS Building Analysis


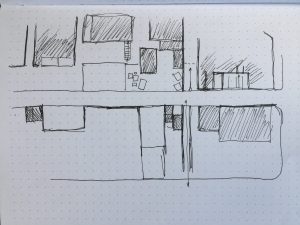
In-class Exercise
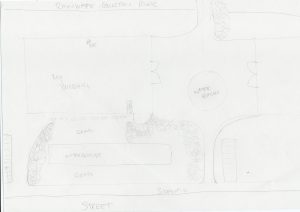
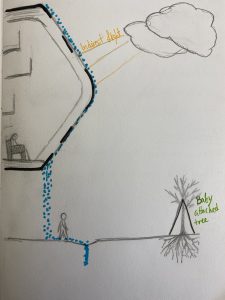
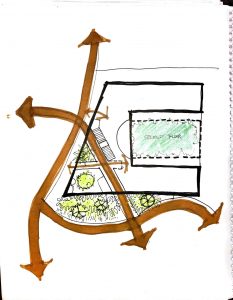
Communicating how to get to street from office closet, while beginning to map rainwater.
Assignment 4
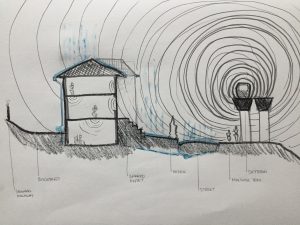
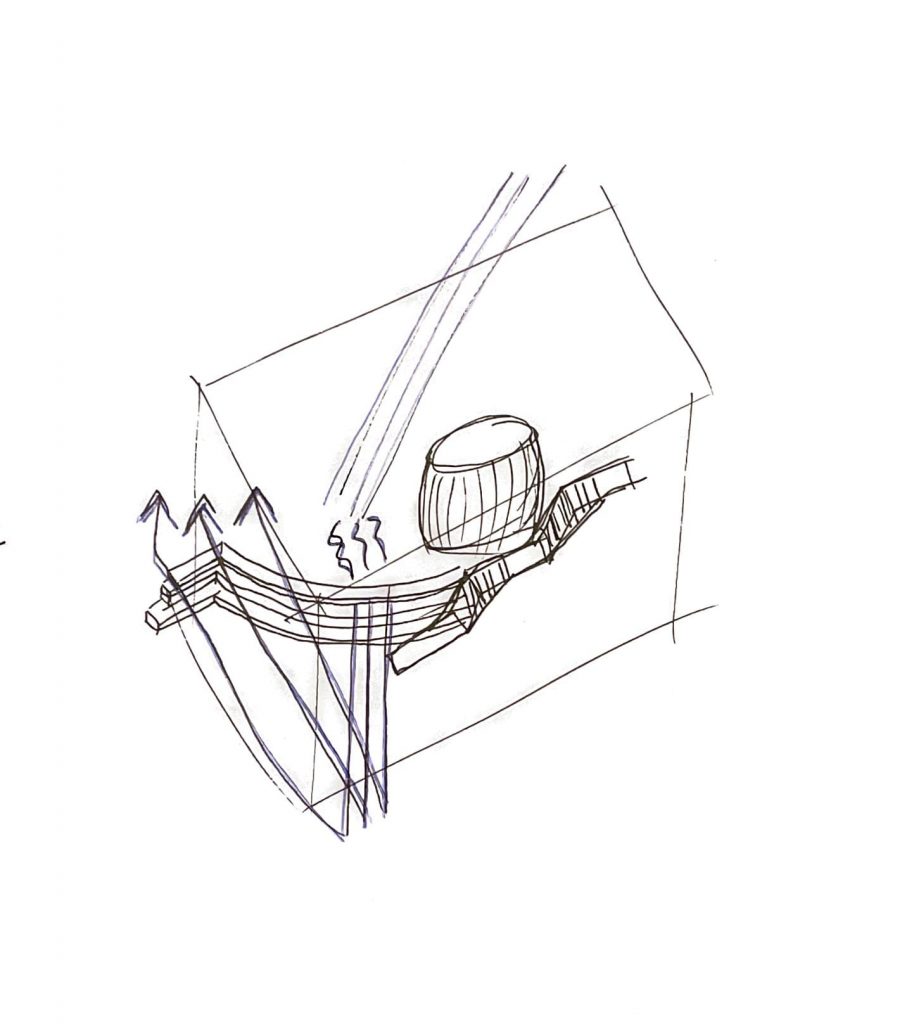
Analyzing sound and water at the Nest.
Week 4 in-class exercise

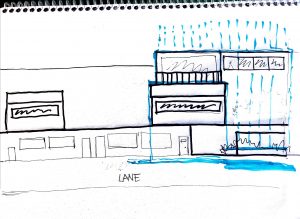
Rain and north light in the Nest Building
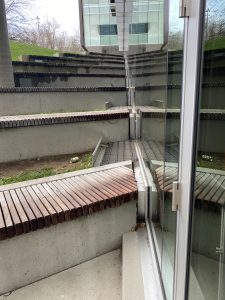
Continuous seating inside-outside. There is grass to absorb rain outside.
back, I noticed it is a visual continuity, it seems like the curtane wall is dividing the seating stairs with probably a layer of insulation.
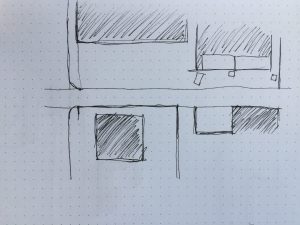
Circulation to get in the Nest.
 Edit —->
  After going

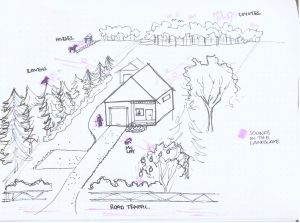
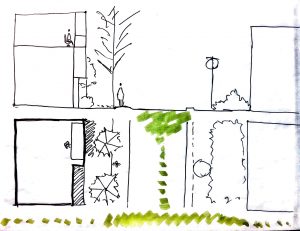
In Class Exercise – Preliminary plan of house
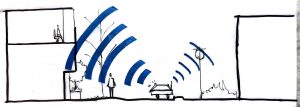
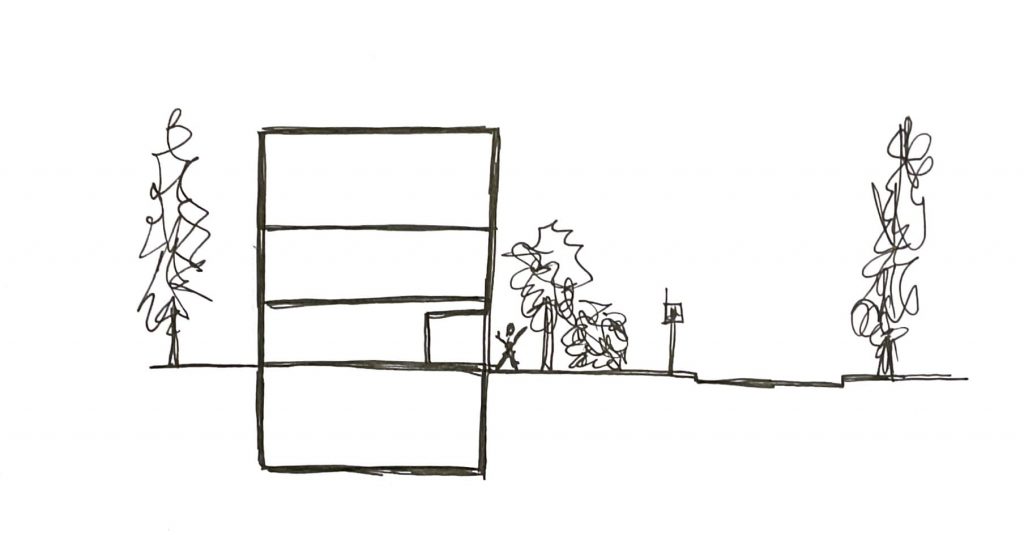
In class exercise: sound section
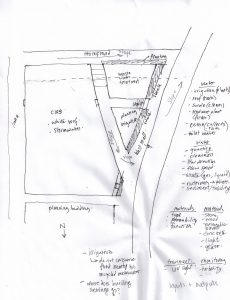
Assignment: preliminary sketch plan (east end of lane)
Assignment: preliminary sketch (west end of lane)

Assignment: Preliminary sketch – axonometric
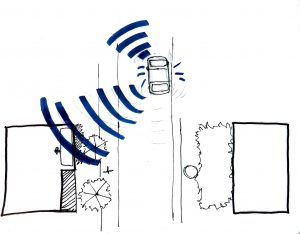
Assignment: final sketch. “Vehicle traffic and servicing in a laneway”
In-Class exercise 4: mapping sound outside my apartment in section
Assignment 4: Analyzing the Nest

Sun and Shadows

Movement

Water
In-class exercise
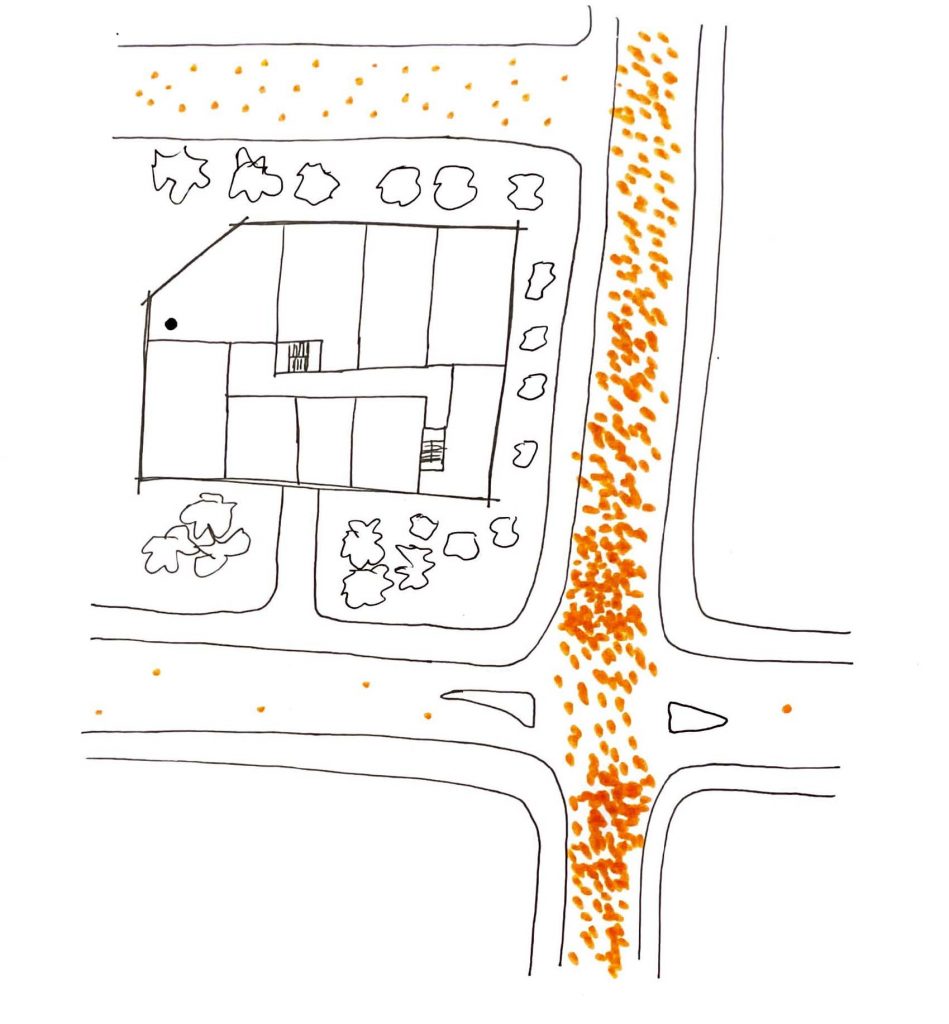
Vehicle sound near my room & rainwater movement
Revised
CIRS Building
Main Circulation
Second floor with a small open garden

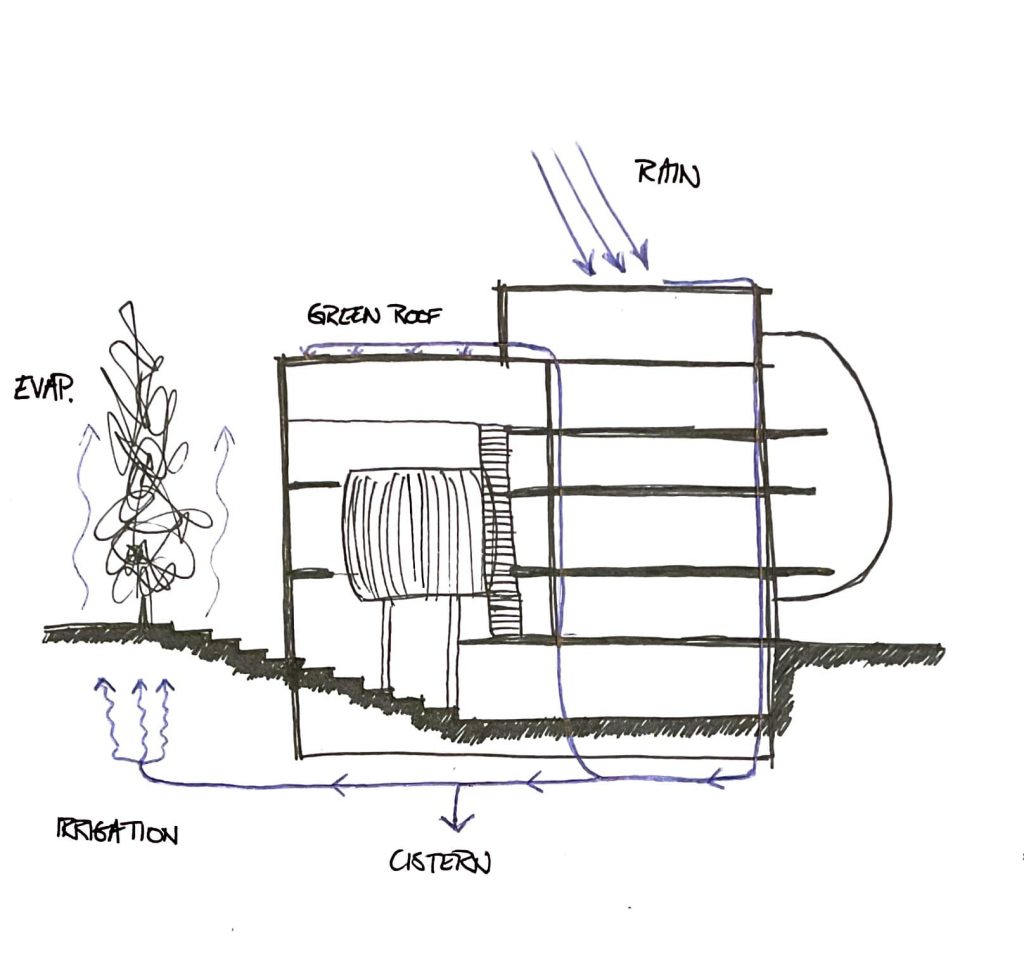
Rainwater collecting & infiltration system

In class exercise:
1. mapping noise intensity
2. section of my apartment building
3. drainage axo

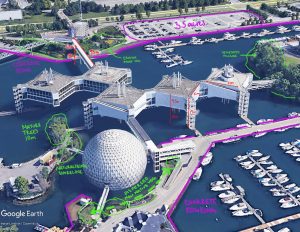
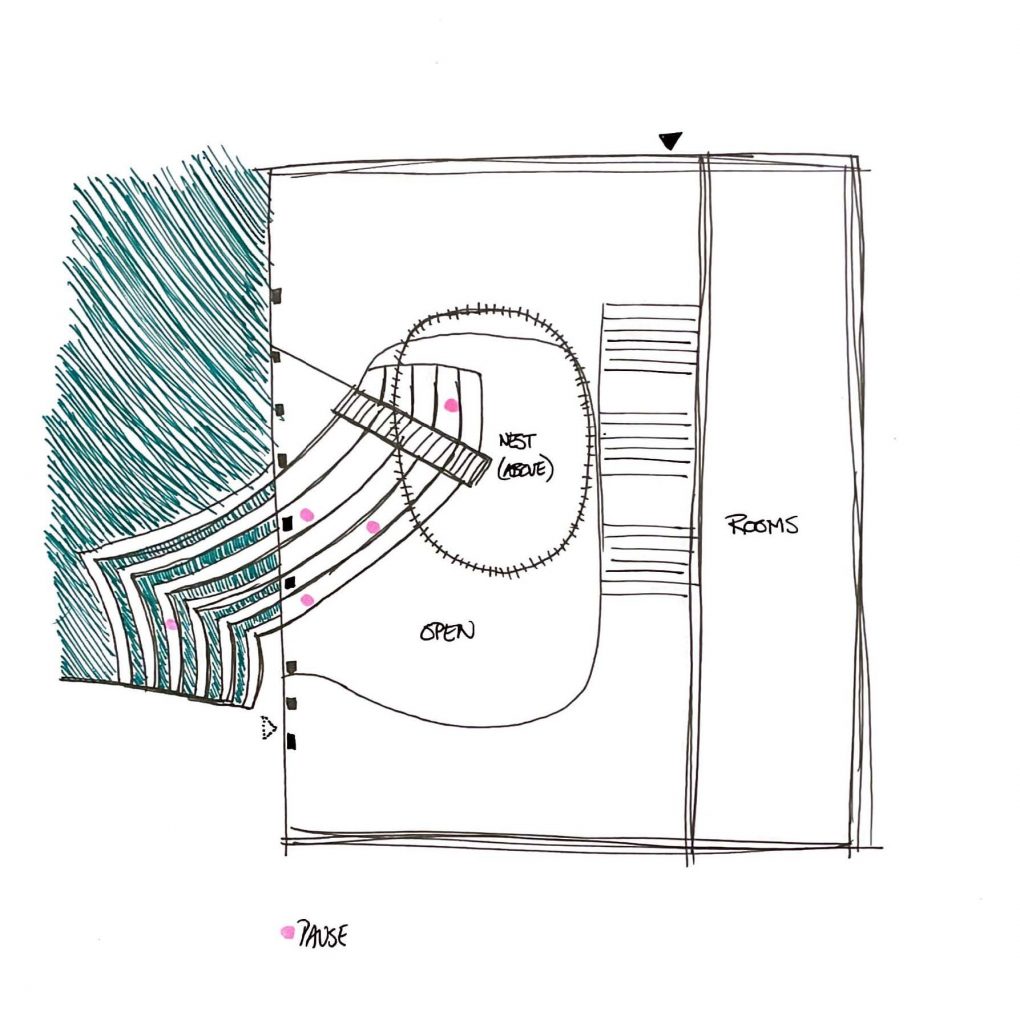
UBC Nest
Plan marking moments of pause
Practicing axo sketches to better understand inside/outside relationship and drainage

Drainage section
Overall drainage axo

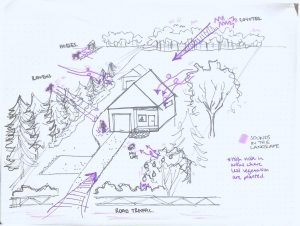
In-class exercise: A drawing of a route from my home to the street, showing temperature change from outside to inside. In this exercise I learned that a multis-ensorial map can help reveal microclimates or other invisible things that wouldn’t otherwise be obvious without having observed them using other the senses (besides sight).

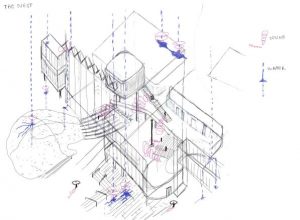
A visit to CIRS Building. I started with plans and a section to get a lay of the land. (It was raining so the paper got wet).


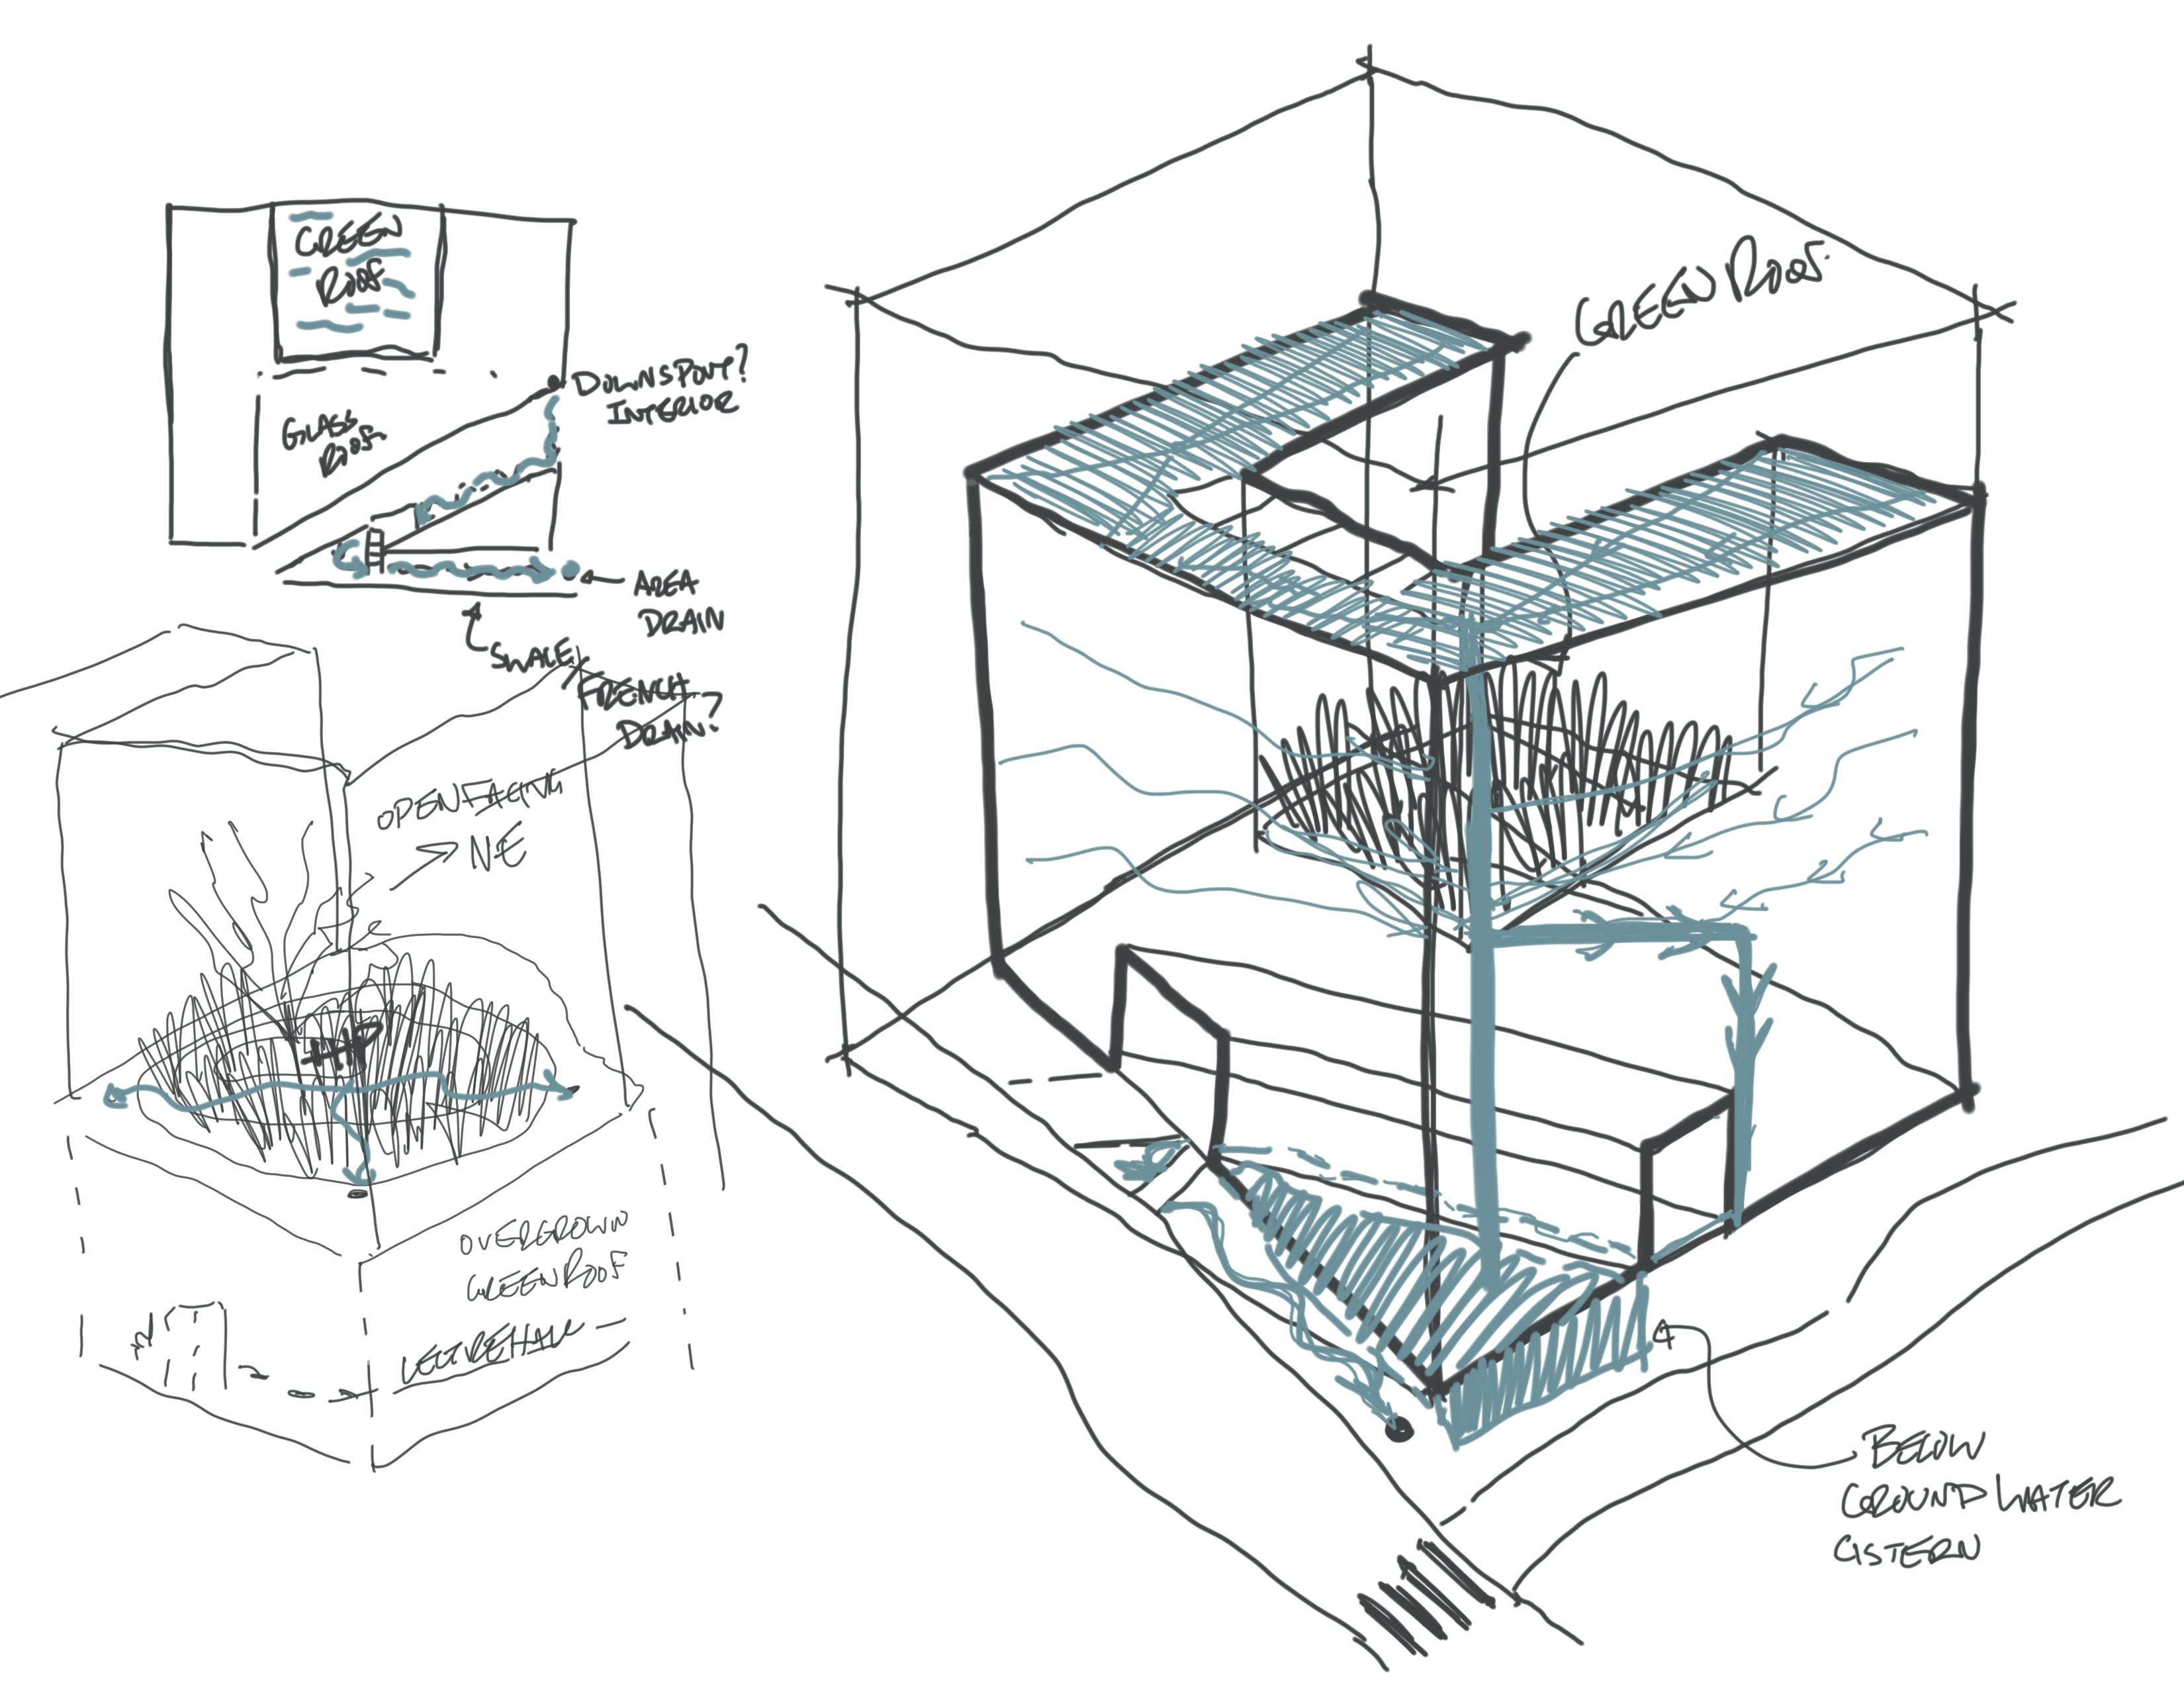
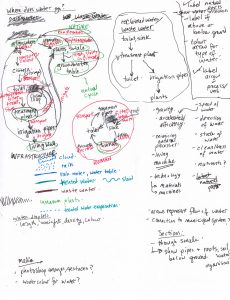
I drew the plants in the wastewater treatment plant on site at the Solar Aquatics Lab. Some of the plants seemed droopy and unhealthy, while others reached for the light. I also started with some mind-mapping of where the water moves through the building/landscape system. Putting the processes and cycles into words first helped to plan out and simplify the final drawing.

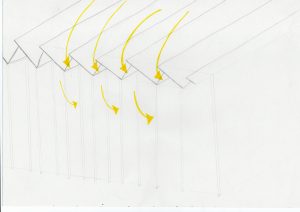
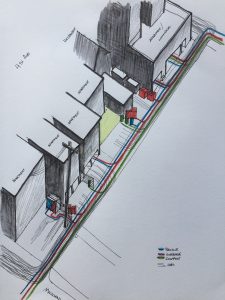
Draft sketches. Setting up the axo and choosing the section cuts was the trickiest part.
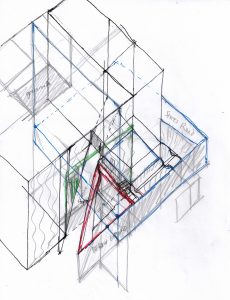
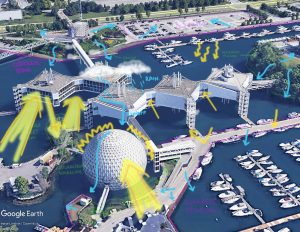
Water at, above, and below ground: The three colours of arrows represent different types of water: rain water, waste water and treated water. The diagram shows how rain water collects on the white roof, flows through the built infrastructure (roof, cistern, toilets, on-site treatment plant, irrigation system, and bioswale) and through natural system components (atmosphere, water table, soil and plants).