03

Lauren Wolfe Assignment 3

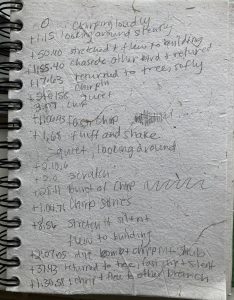
At home exercise, the Beaty Biodiversity Museum

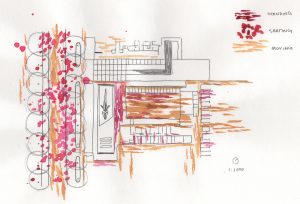
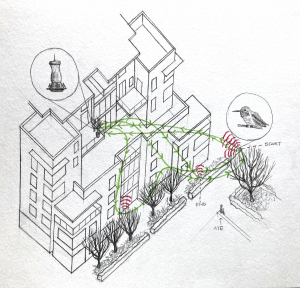
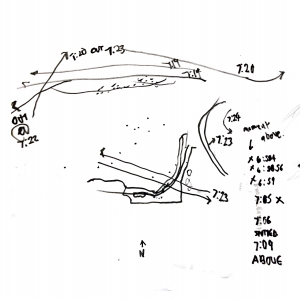
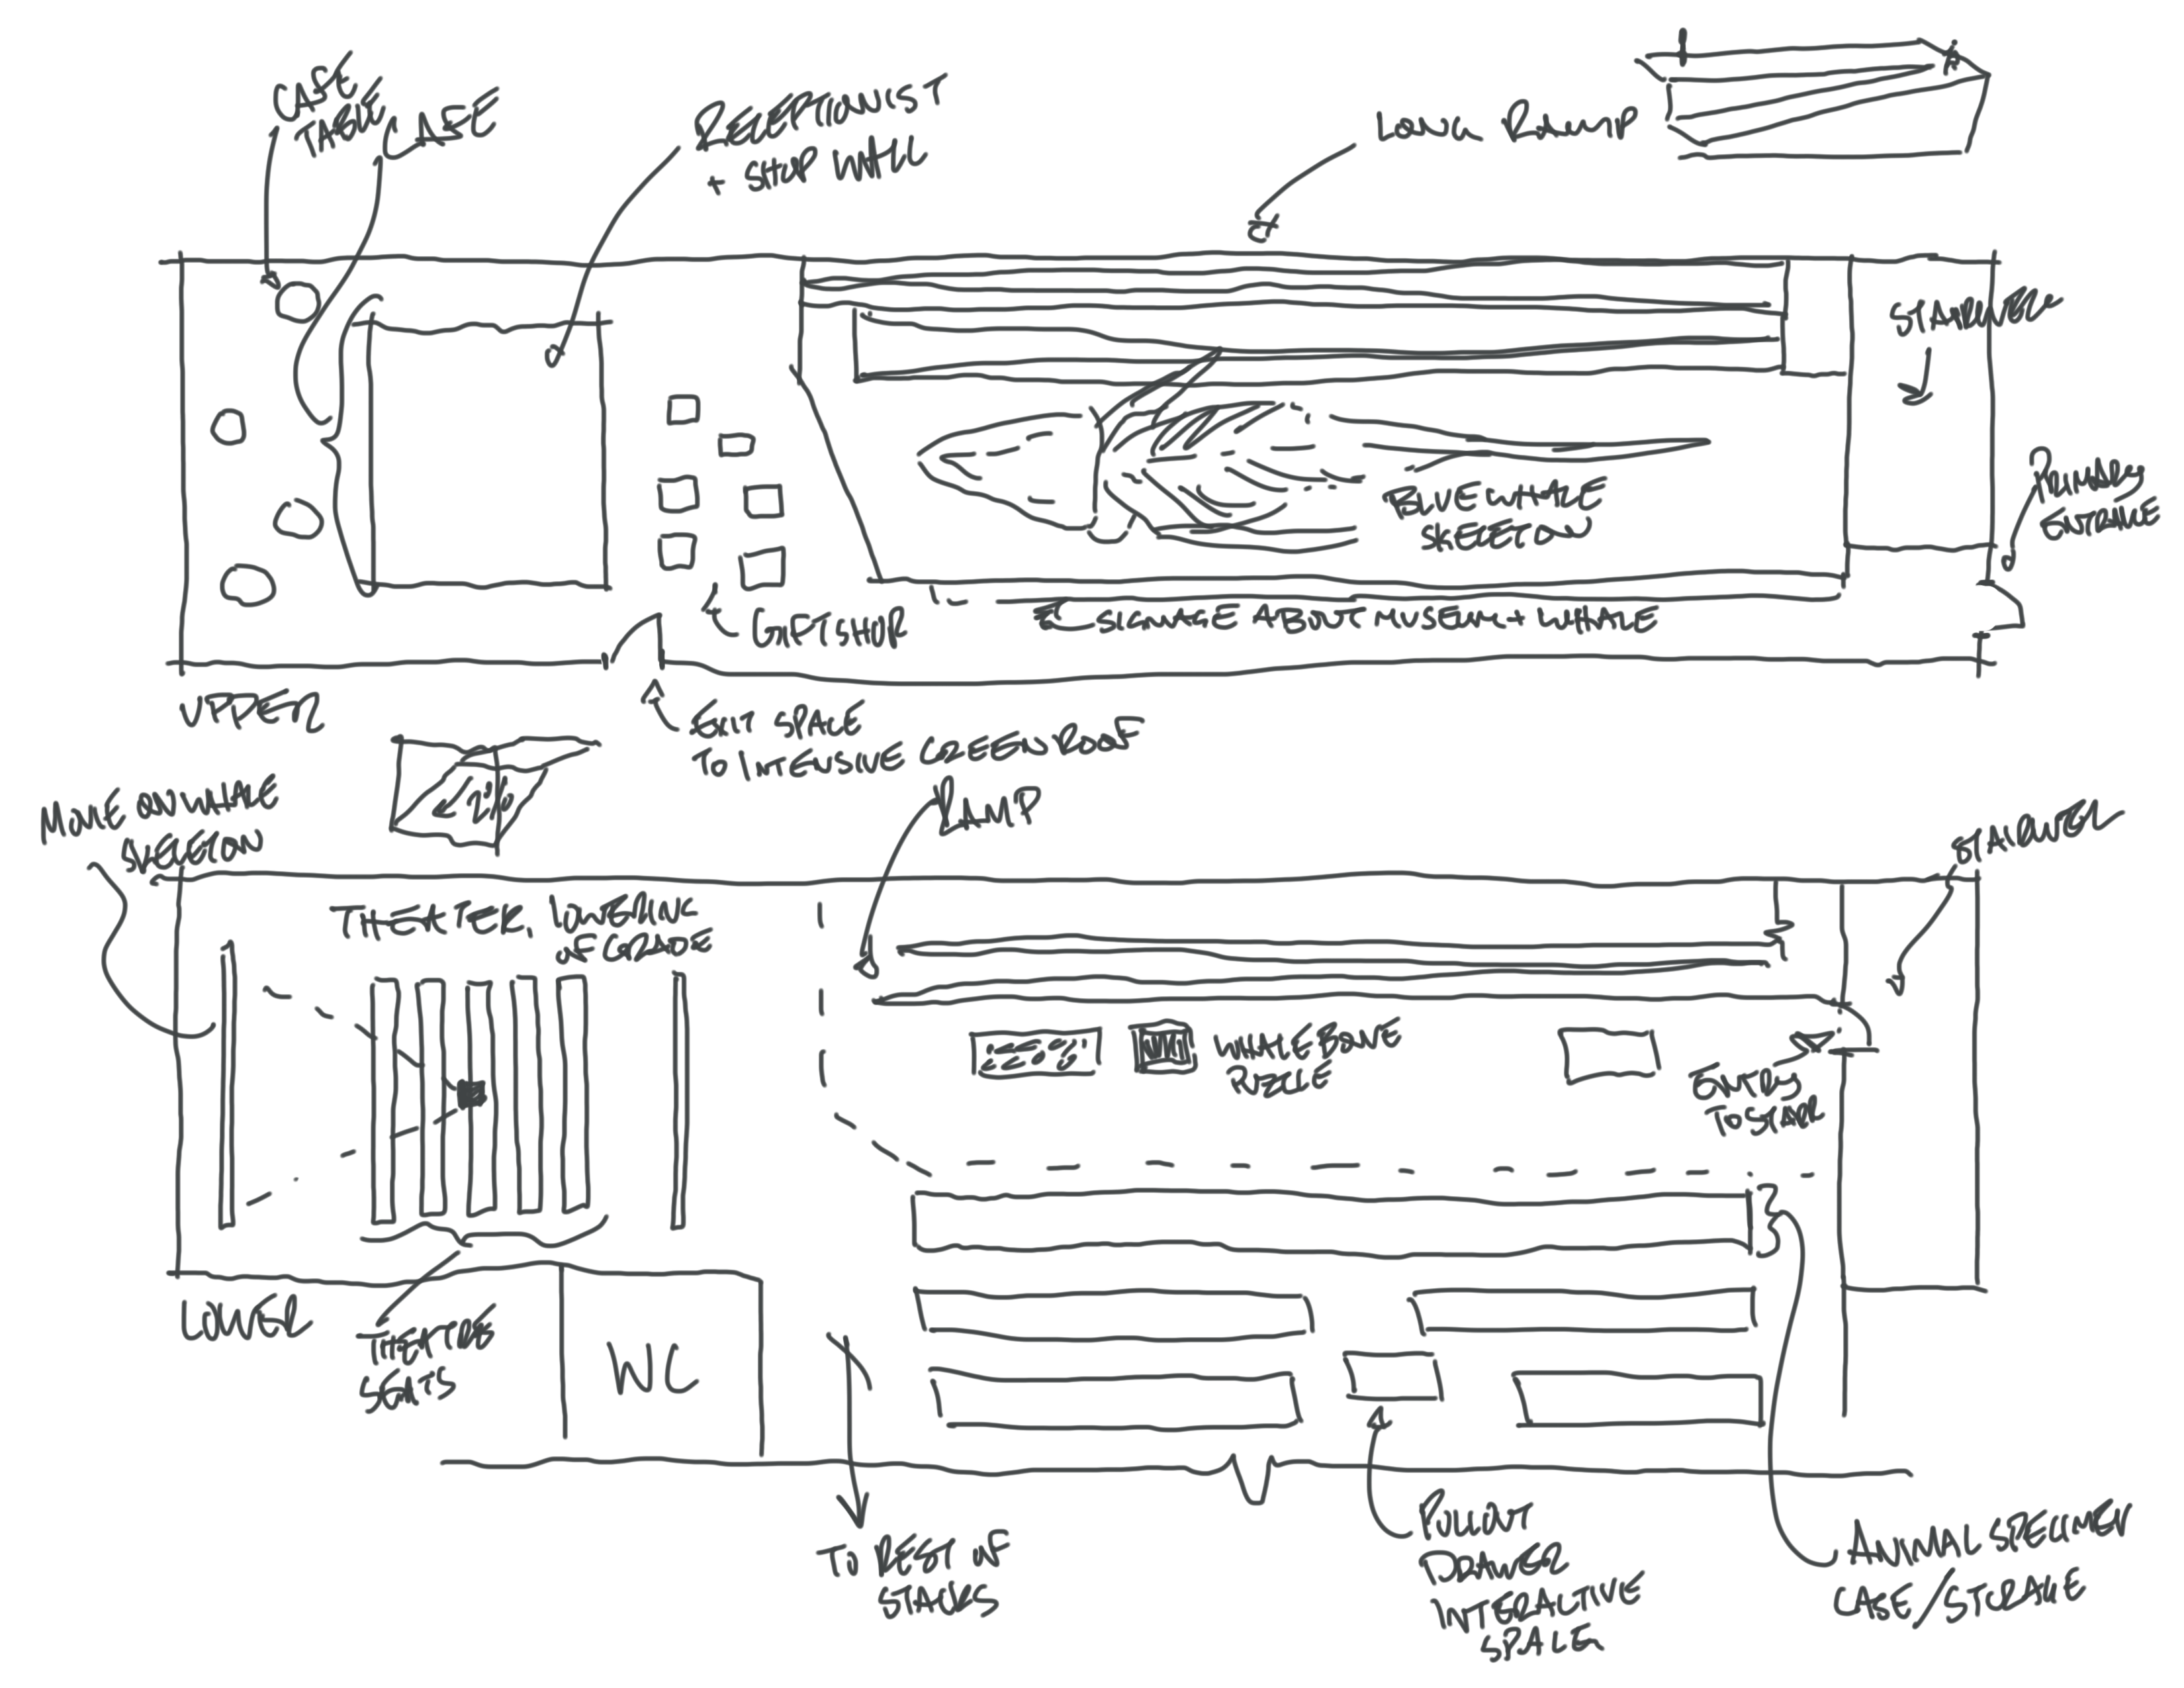
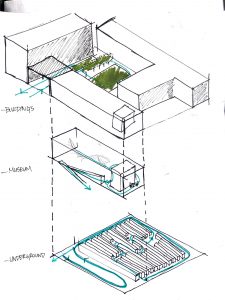
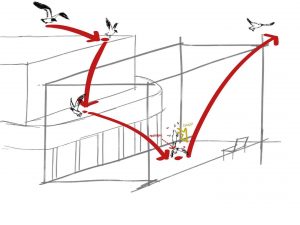
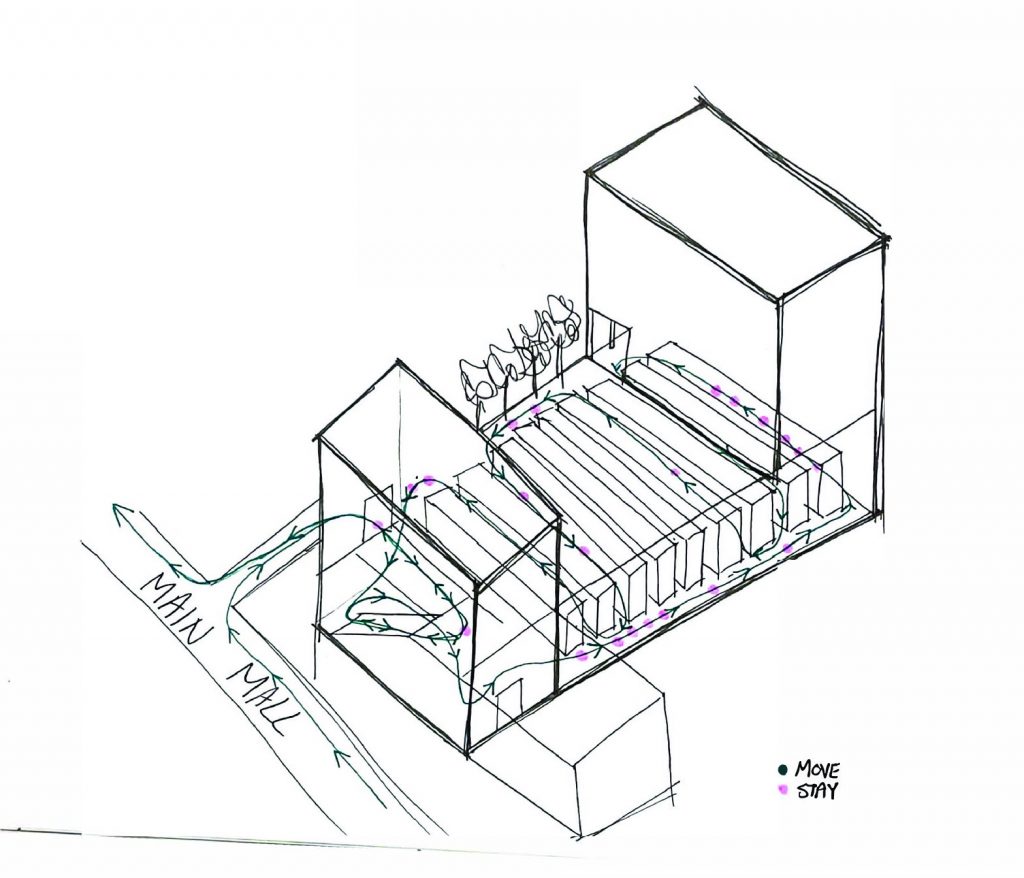
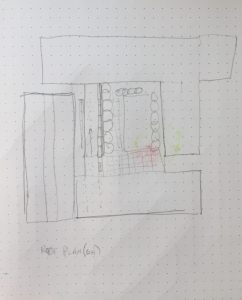
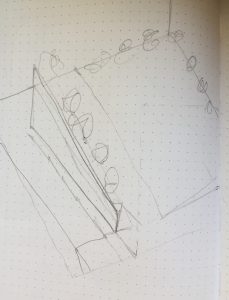
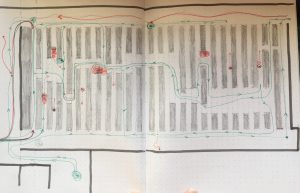
The museum was not busy when I went there, so I wasn’t able to track movement of people visually. What I did find was the experience of hearing other people as they came near me and then move further away. Because the rows of exhibits make it hard to see beyond your row it amplifies this feeling of hearing people around you. The blue arrows track my movement through the space, and the colours track different noise moments I experienced during my visit.

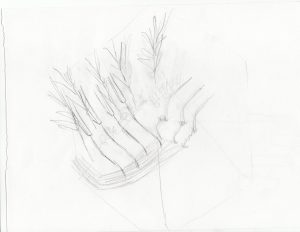
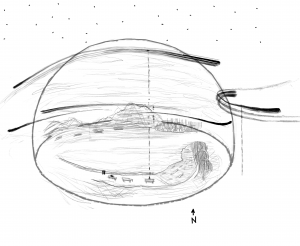
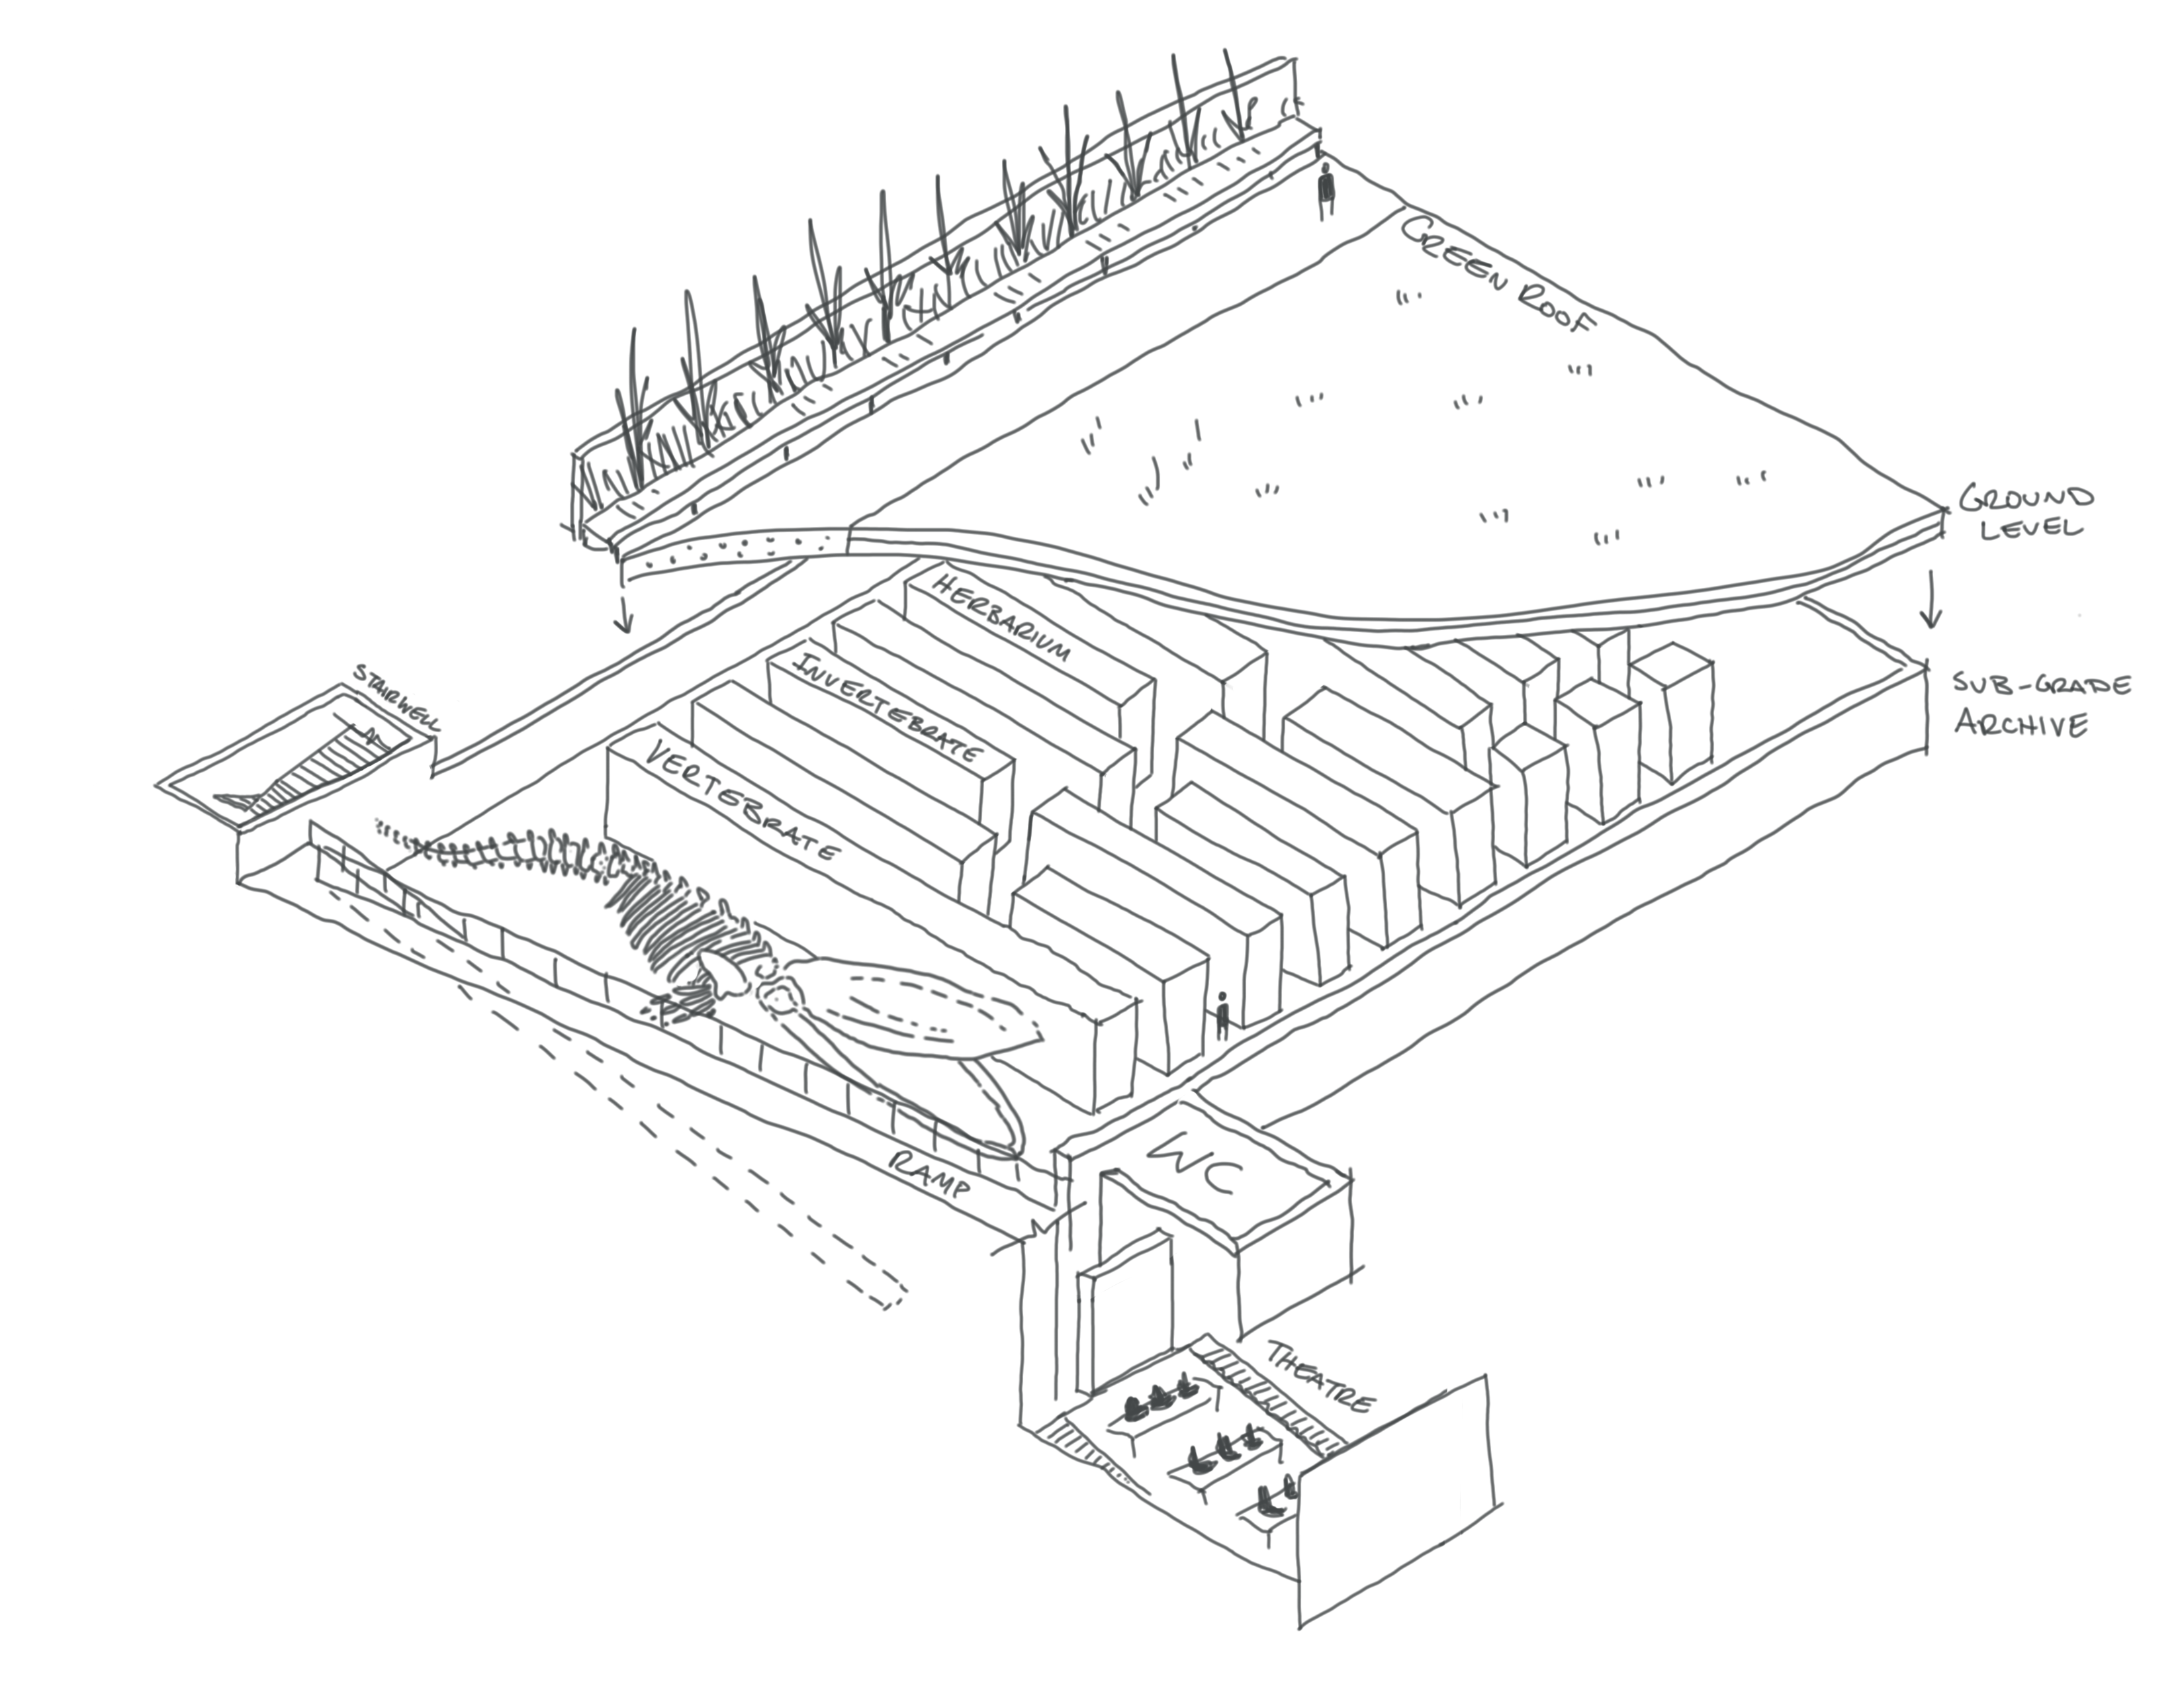
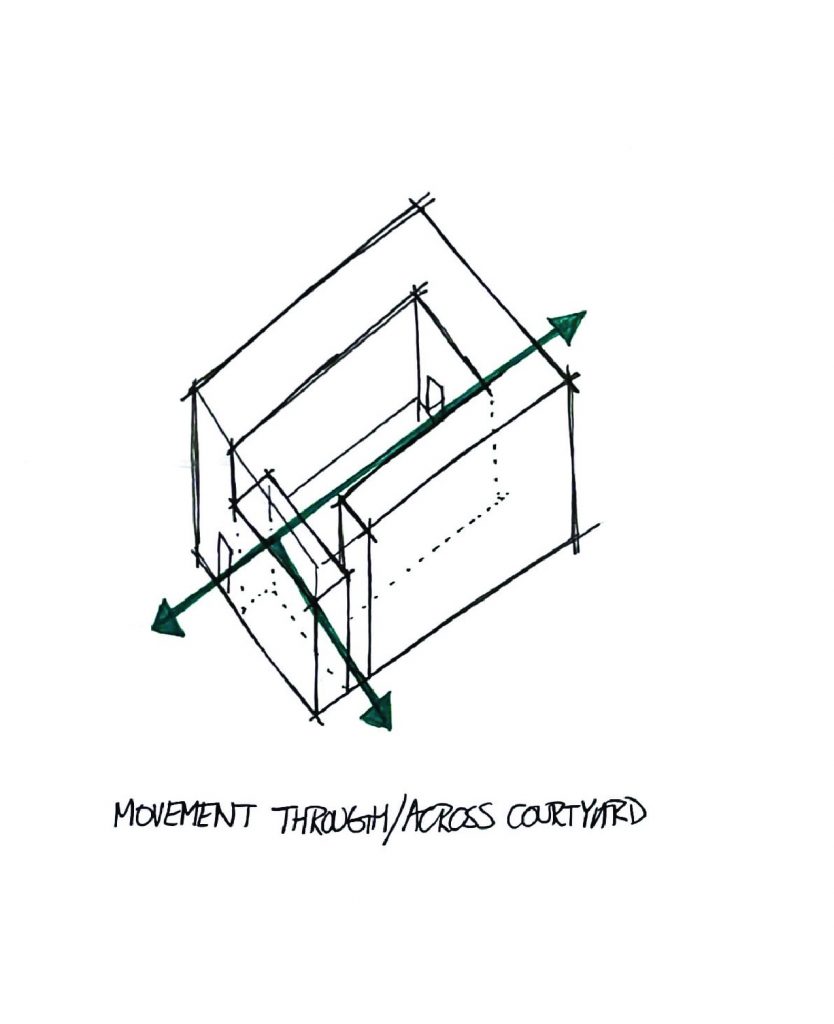
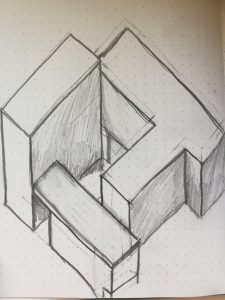
Below I was looking at circulation through the whole space. It was my first visit and I was surprised to come down the ramp, leaving the airy top floor and find myself in this cramped basement full of narrow rows of tall looming cases.


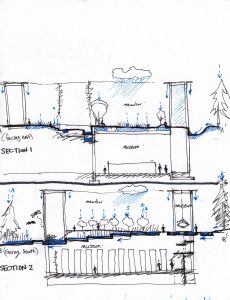
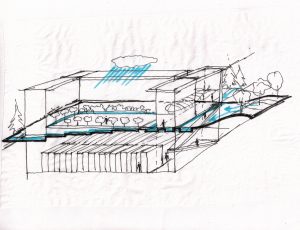
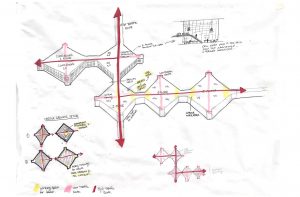
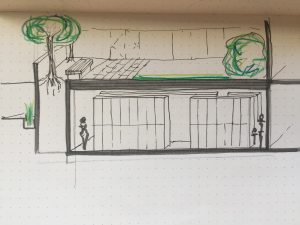
In-class exercise diagramming rain.

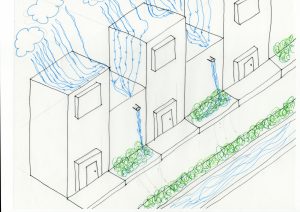
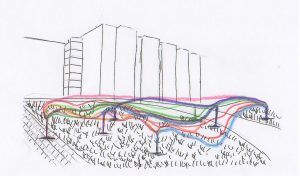
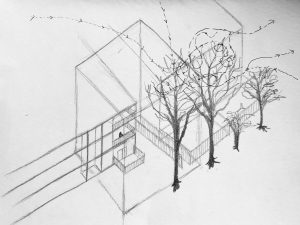
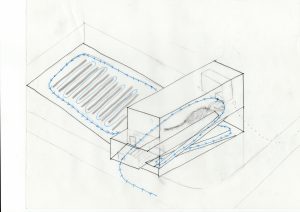
  1. My final attempt at drawing rain water flow from the roof of these townhomes near my house.
  2. I redrew this version based on feedback in class trying to make it more clear, and link the falling rainwater with the collection channel.

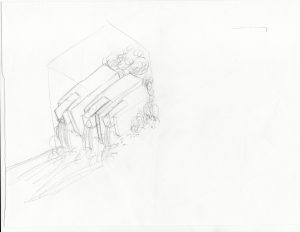
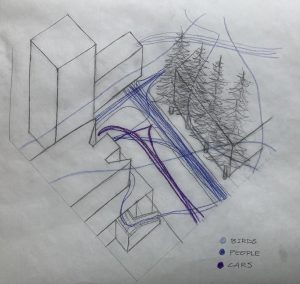
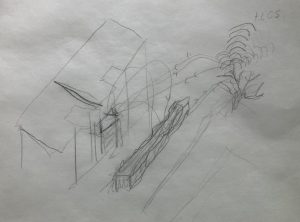
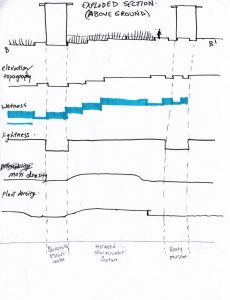
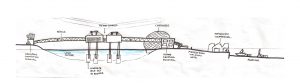
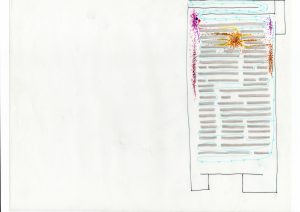
My first attempt at drawing water flow. This is a water feature near my house and part of rainwater collection system. I realised it isn’t very diagrammatic so I moved on to trying to draw the flow of rainwater.

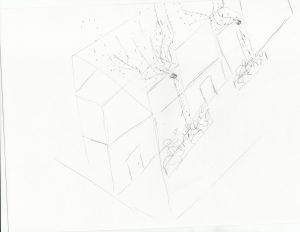
Below is my first attempt at drawing rain more diagrammatically, and I did not like it at all, so I tried again on some building across from this one (see above.)

Week 3

In-Class Assignment

Tracking traffic, birds and people outside my building.

Assignment 3
During in-class assignment, I really enjoyed tracking birds’ movements and figured I would do it again with a hummingbird that I’ve noticed outside my apartment – it is there in the same spot everyday. I turned on my stopwatch and noted every time the bird was chirping, silent, flying to the bird feeder on a balcony, etc. I found it hard to represent time in the spatial diagram, so I drew a separate sound diagram. However, it would be interesting to figure out how to combine the two.


Notes from watching


Draft sketch


Sound diagram


Final diagram

Kristian Lebitania- Assignment 3

In-class exercise

I mapped airplanes at Kitsilano Beach Tuesday Evening. Sitting on a bench, I observed several planes and their paths in the span of 30 minutes. The most significant planes I noticed first were the ones that flew directly overhead. They were only minutes apart on the same path and direction. For 10 minutes I spotted no planes until another group of planes came from the opposite direction on another path. During this time I also spotted planes north of the mountains that ran east and west.

In this map I try to achieve the plane paths and their movement in the sky. Using thick lines, the pressure of lines show the direction of the path and a sense of time (I thought about jets during the day that leave vanishing smoke paths). I also tried to convey the auditory experience of the planes by showing clearer and heavier lines for the paths nearest to me. I thought the use of a dome rather than a cube would better show my site experience because it was dark out and the landscape, water, and shoreline were the only clear reference points to map out the plane’s location in the atmosphere (showing sense of plane path location with vertical dotted lines).


Assignment 03

In-class mapping exercise. An eagle’s flight path over time. Eventually the eagle left the site and flew off into the forest.

A visit to Beaty Biodiversity Museum. I started with a plan of wetness and jotting down observations. The two sections and axonometric show how water moves through the site.

A map of environmental conditions across a site section, cutting through the stormwater feature. The map shows how the environmental conditions influence plant density across the site. The y-axis for lightness and density plots relative quantities. 


Assignment 3 – Mapping

I started by doing a series of sketches to get a sense of the space, followed by two maps.  The first was in plan, documenting the pauses of people inside the gallery (it was not easy to observe movement because of the layout of the shelves).  The final version looks at my movement up to and through the space.

Roof plan with courtyard landscaping.

Orthographic sketch of the courtyard.

Orthographic sketch of building massing.

Approximate section with orthographic projection.

Plan view map. Green lines represent my movement and pauses; red lines are the movement and pauses of people I observed.

Orthographic map showing my approximate movement into and around the building.