February 2022

Assignment 04

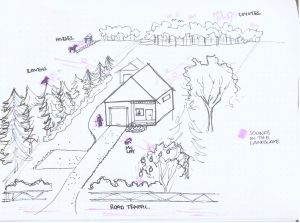
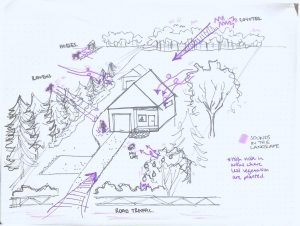
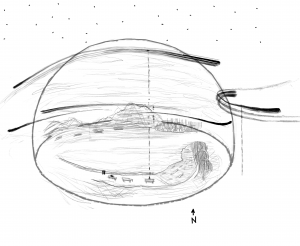
In-class exercise: A drawing of a route from my home to the street, showing temperature change from outside to inside. In this exercise I learned that a multis-ensorial map can help reveal microclimates or other invisible things that wouldn’t otherwise be obvious without having observed them using other the senses (besides sight).

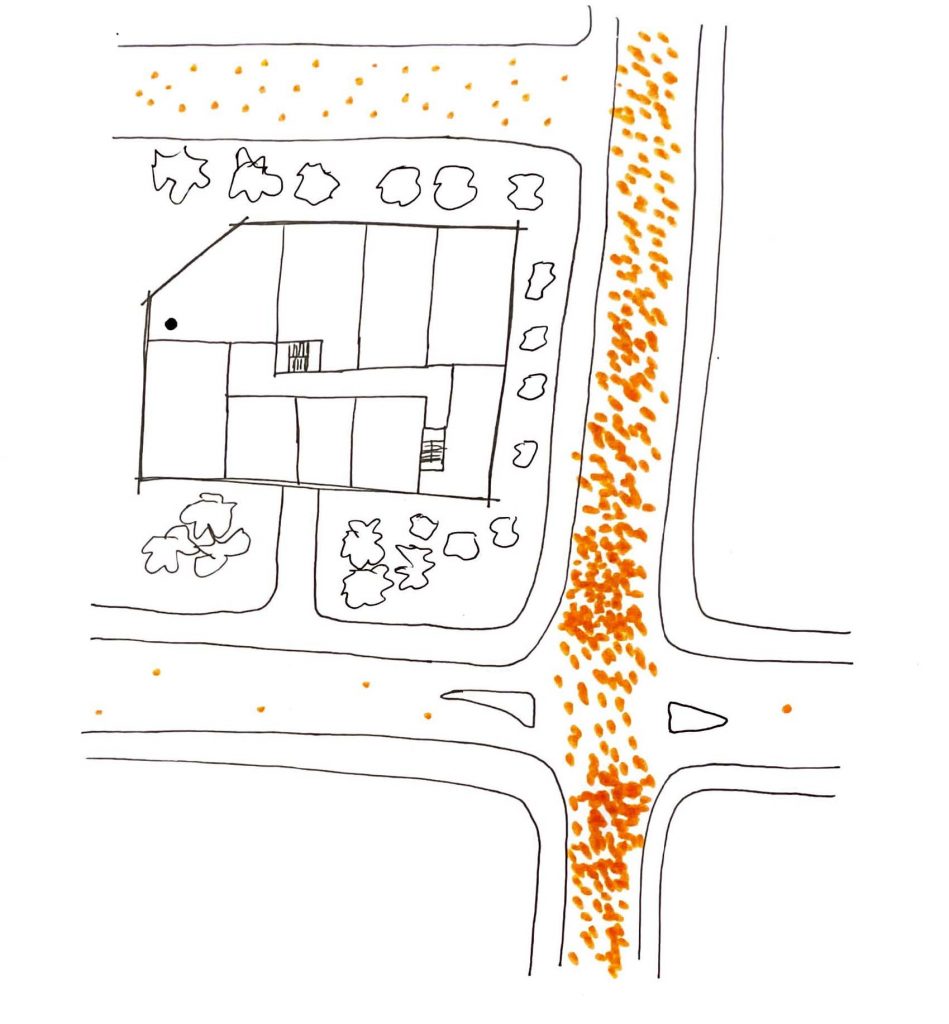
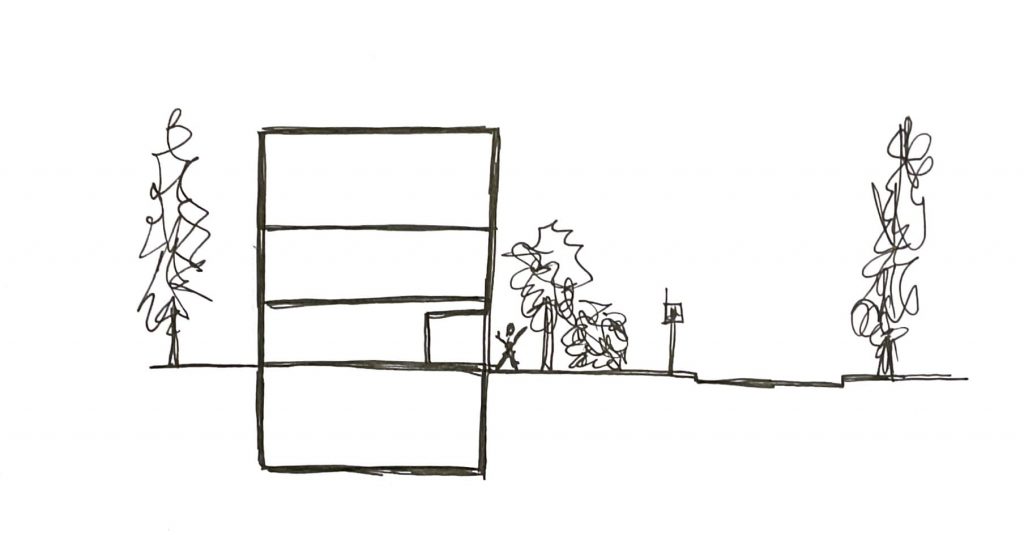
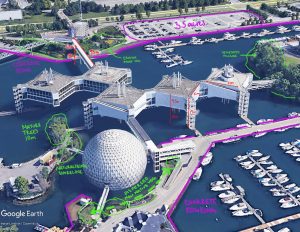
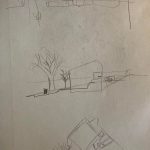
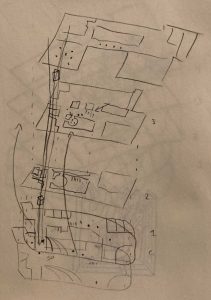
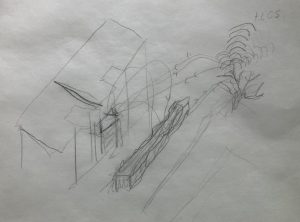
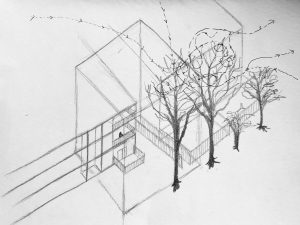
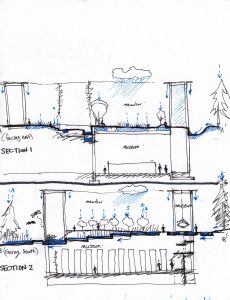
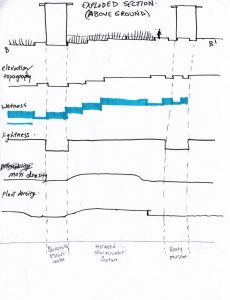
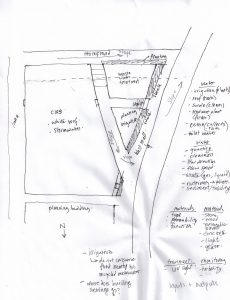
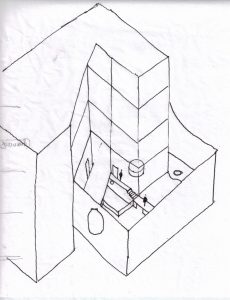
A visit to CIRS Building. I started with plans and a section to get a lay of the land. (It was raining so the paper got wet).

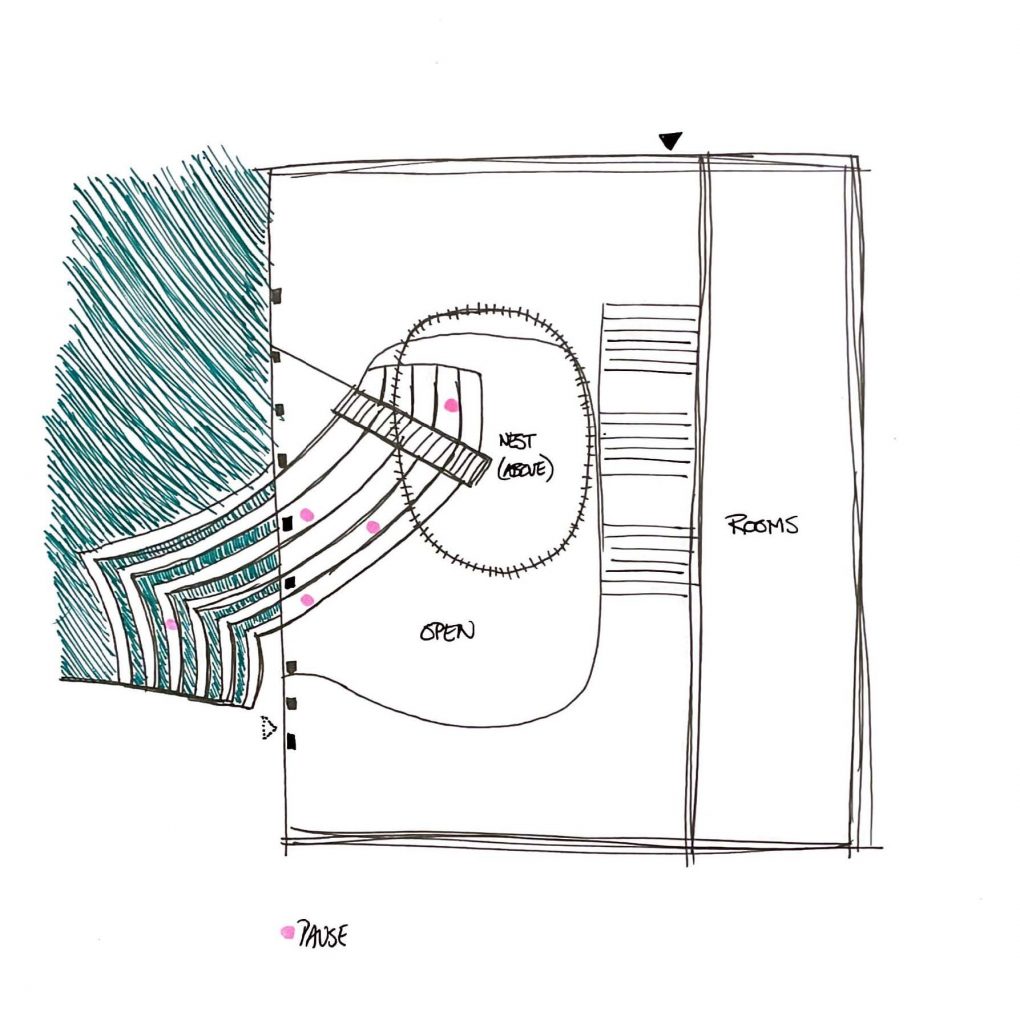
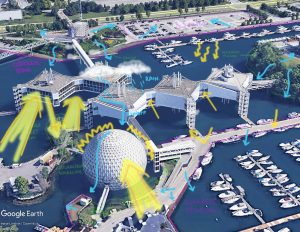
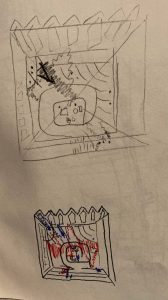
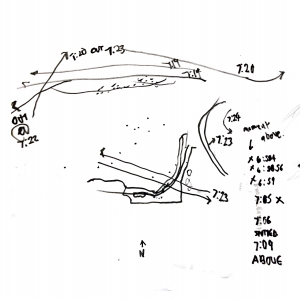
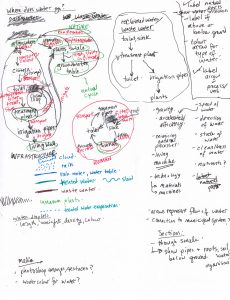
I drew the plants in the wastewater treatment plant on site at the Solar Aquatics Lab. Some of the plants seemed droopy and unhealthy, while others reached for the light. I also started with some mind-mapping of where the water moves through the building/landscape system. Putting the processes and cycles into words first helped to plan out and simplify the final drawing.

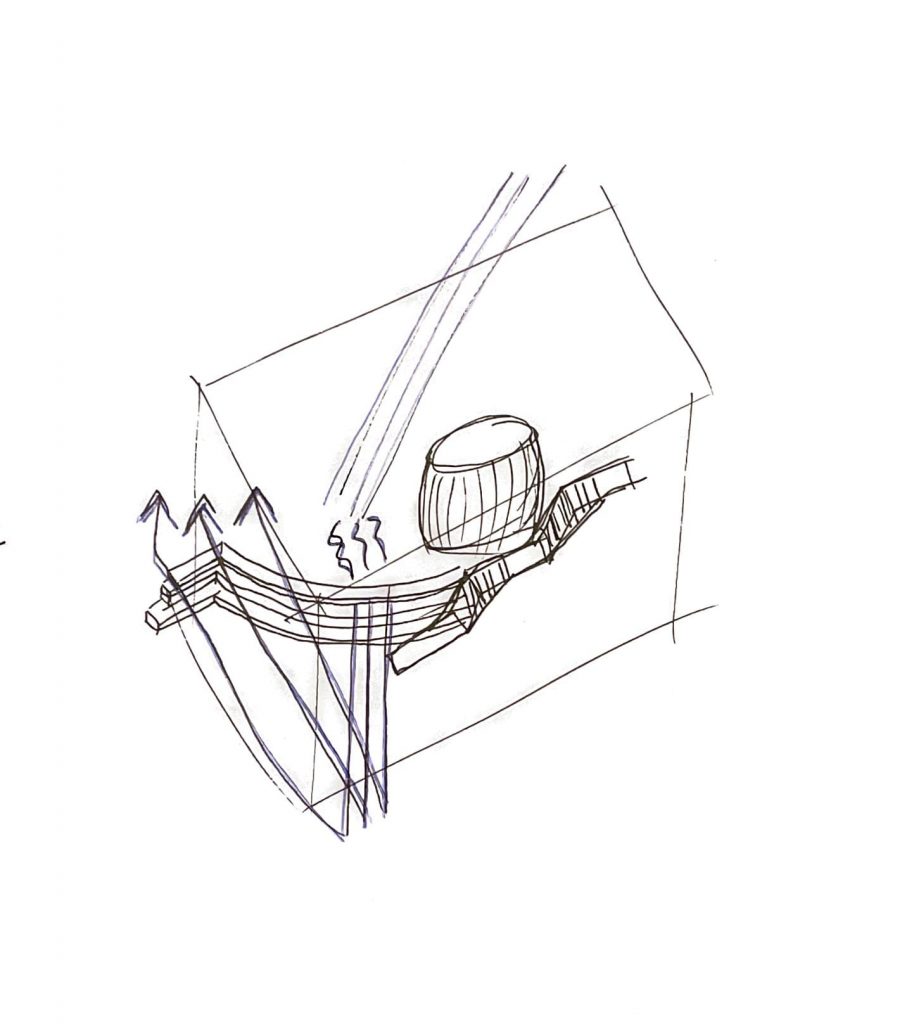
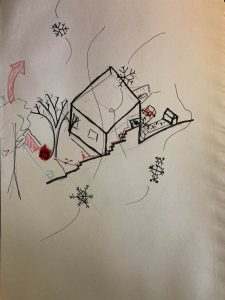
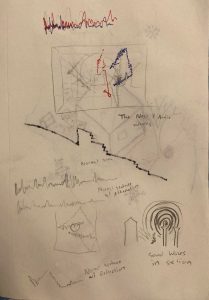
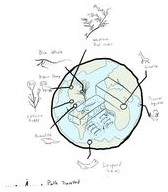
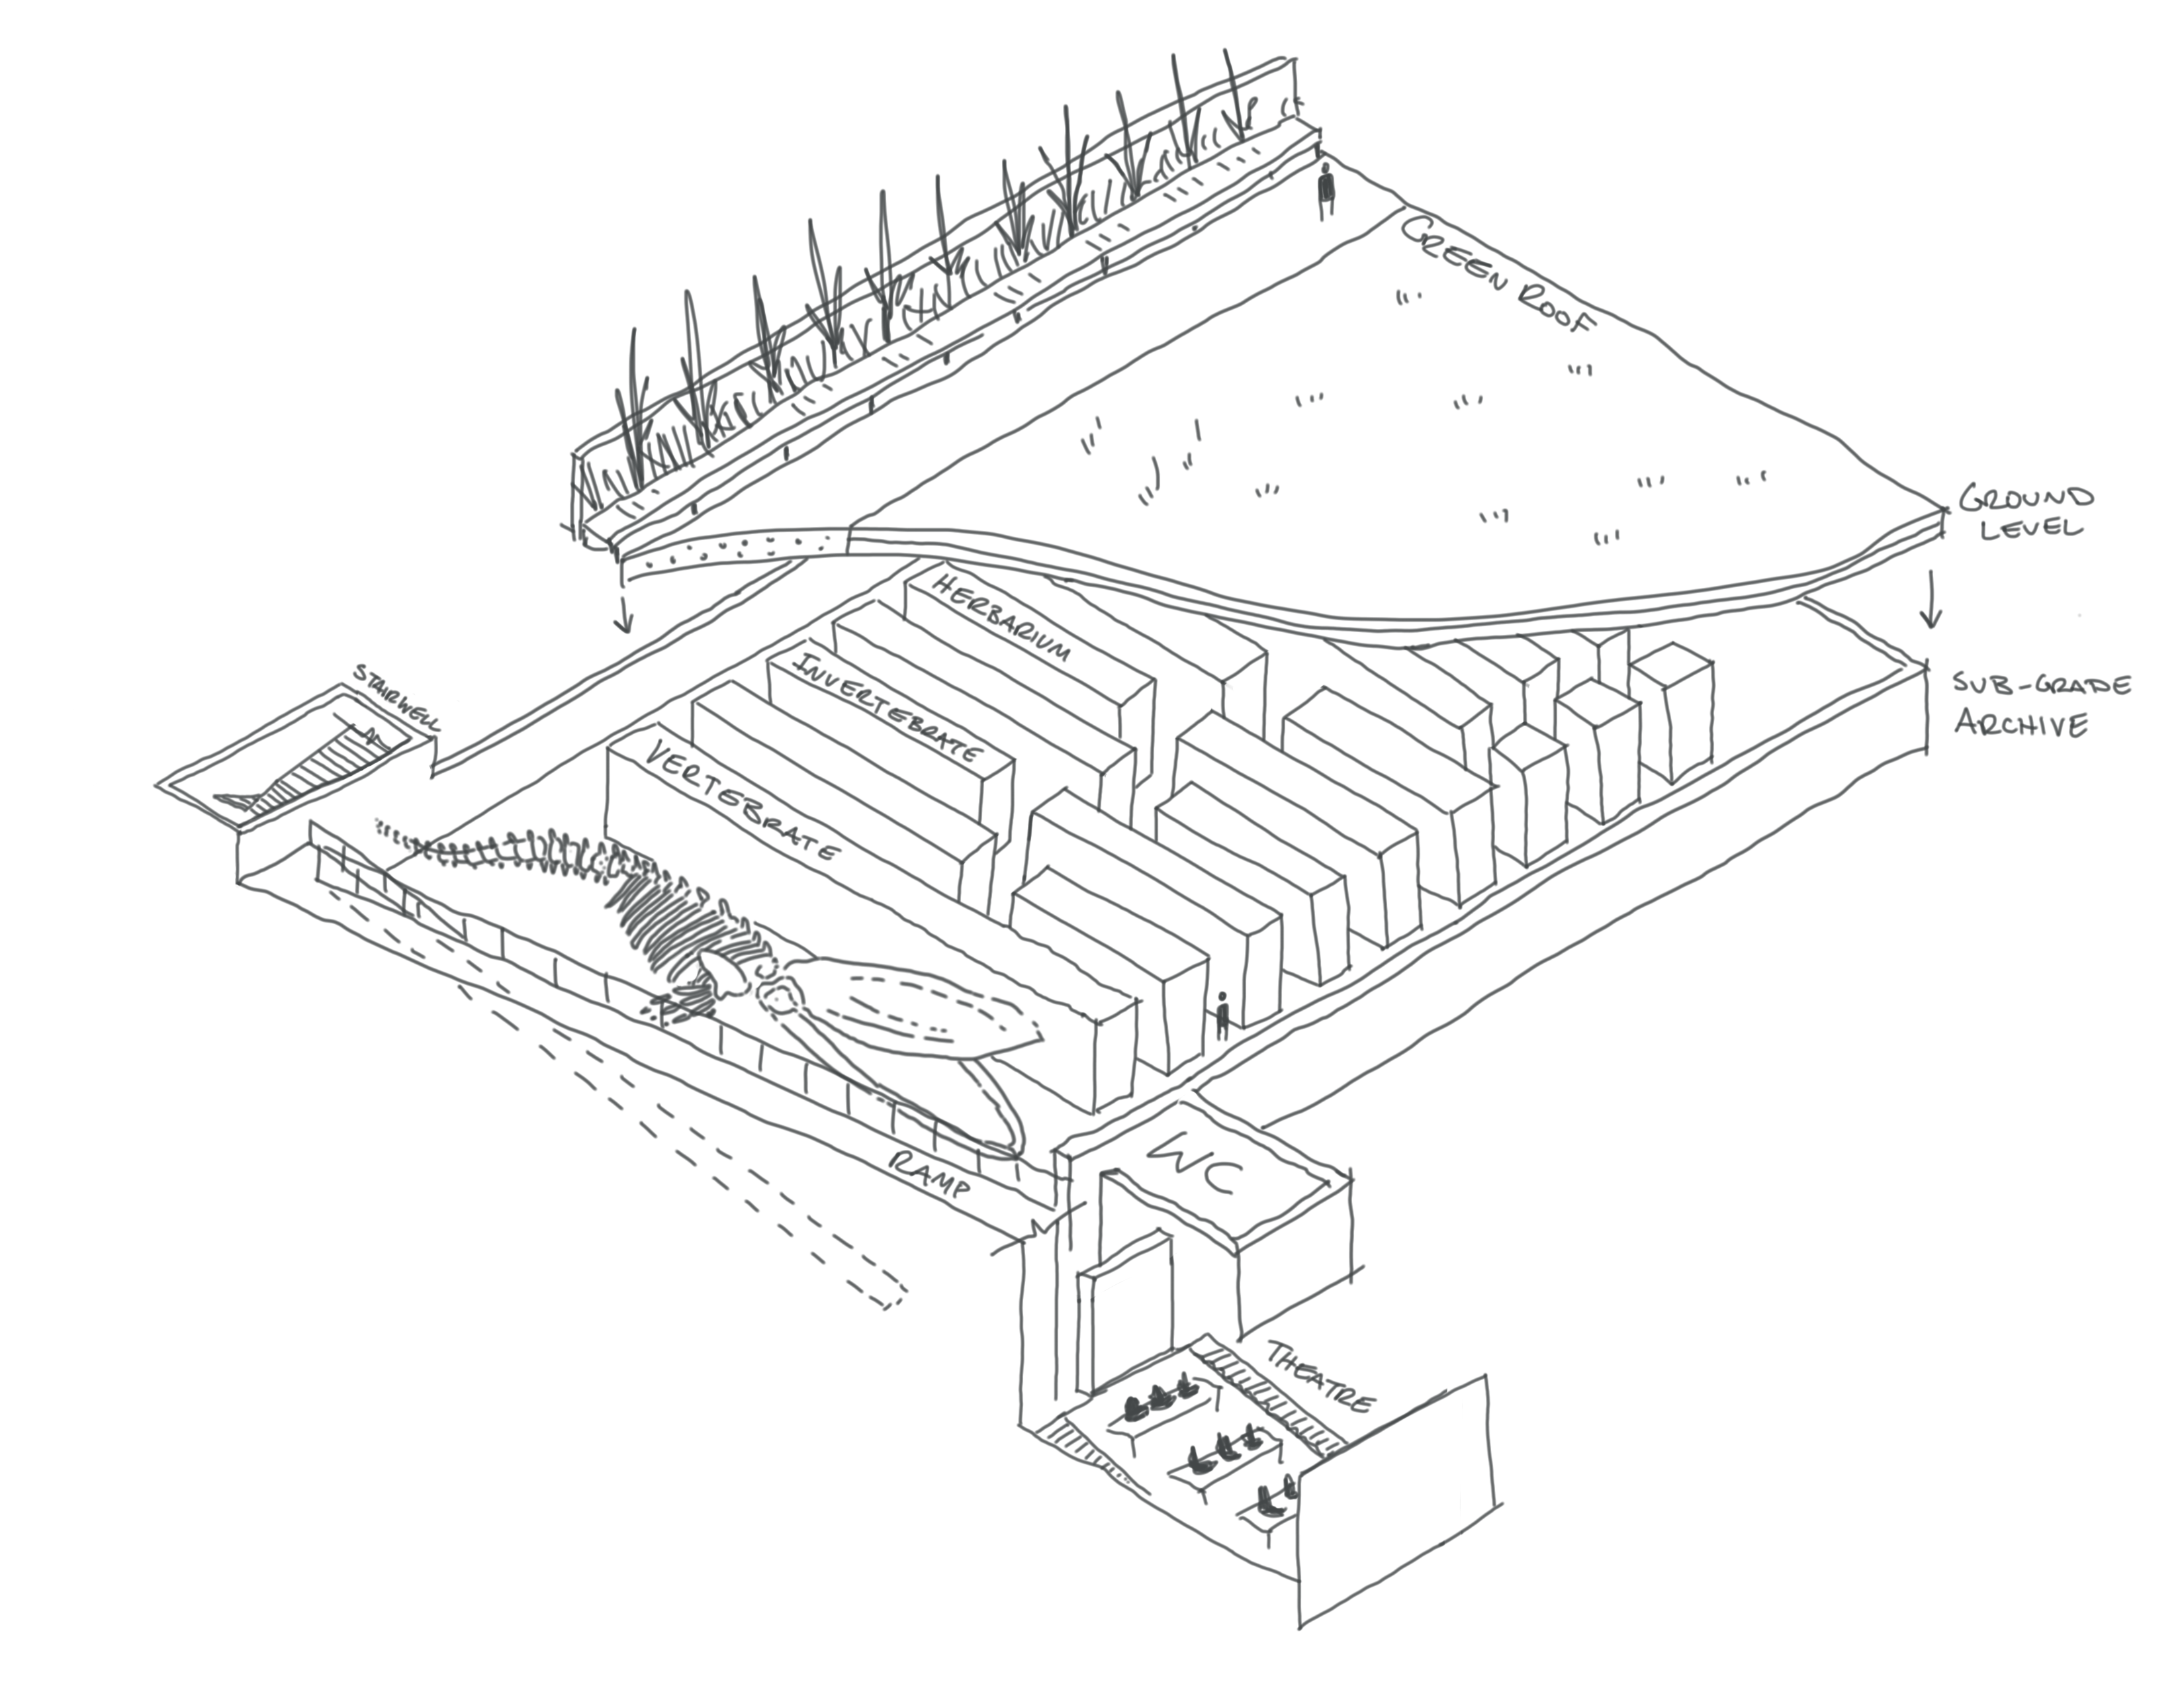
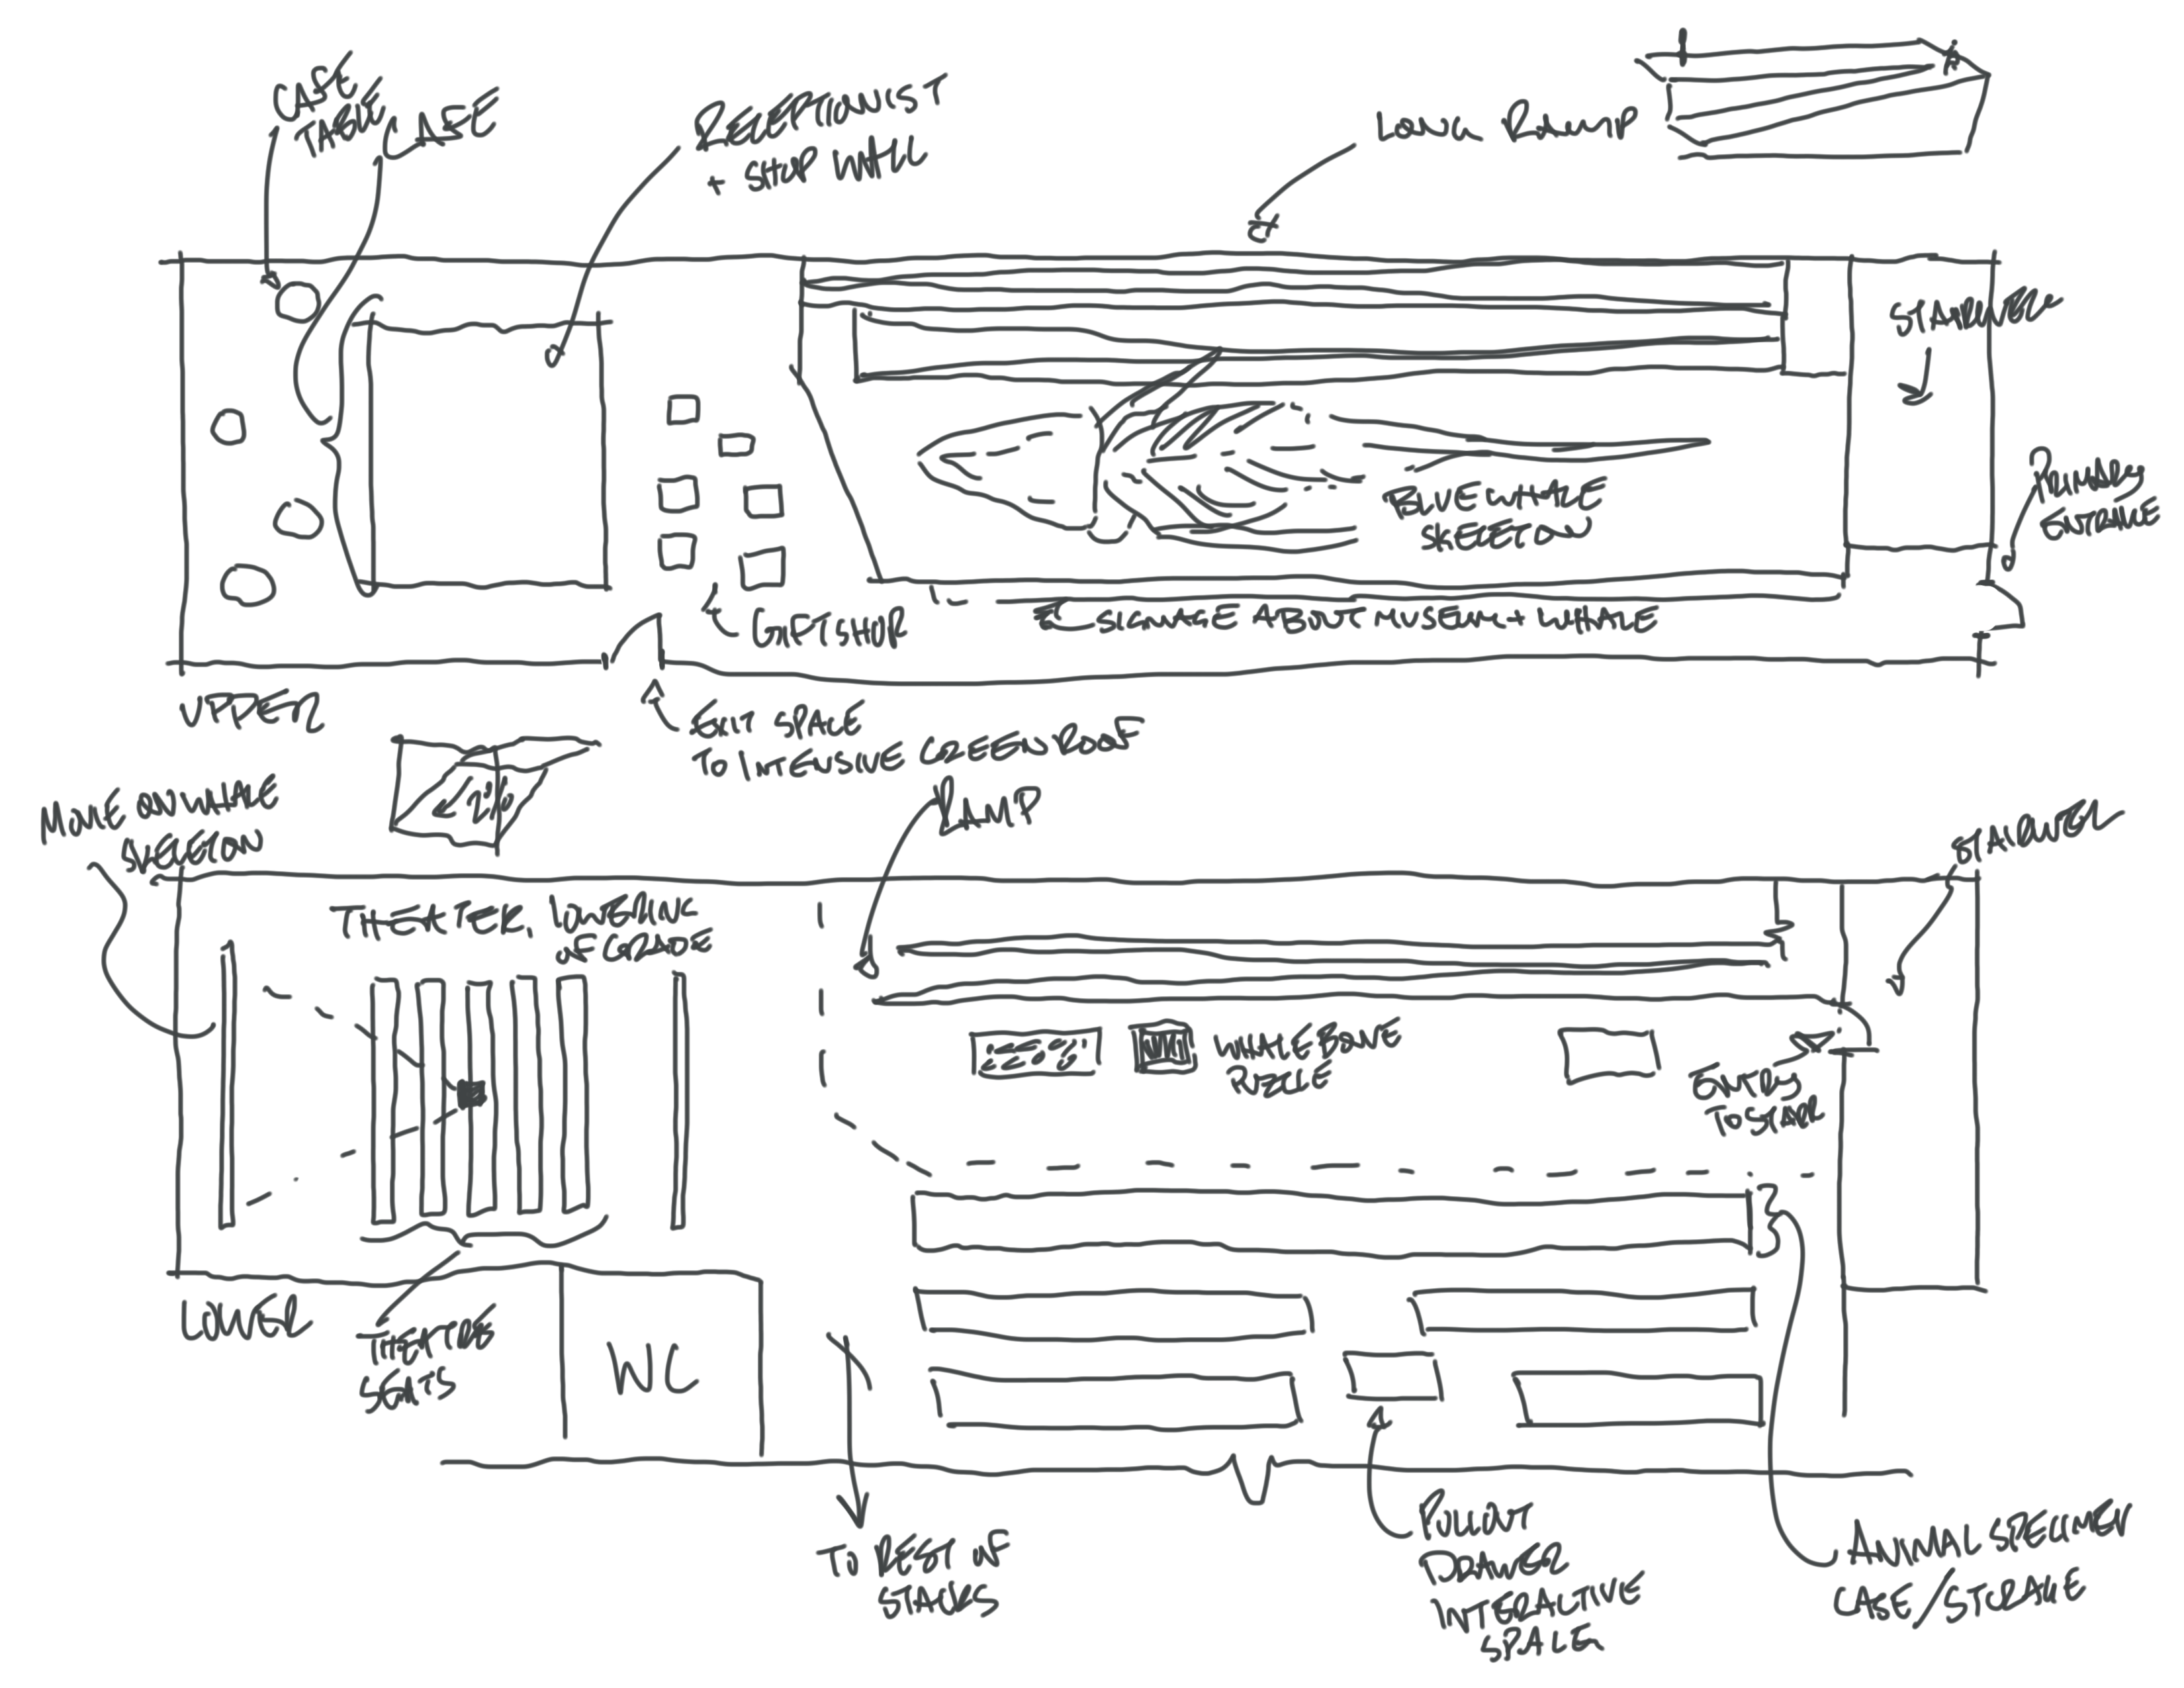
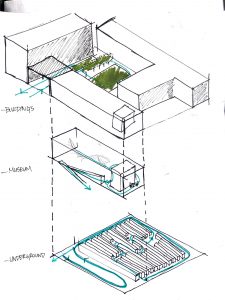
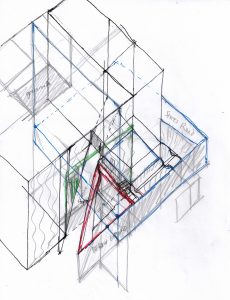
Draft sketches. Setting up the axo and choosing the section cuts was the trickiest part.

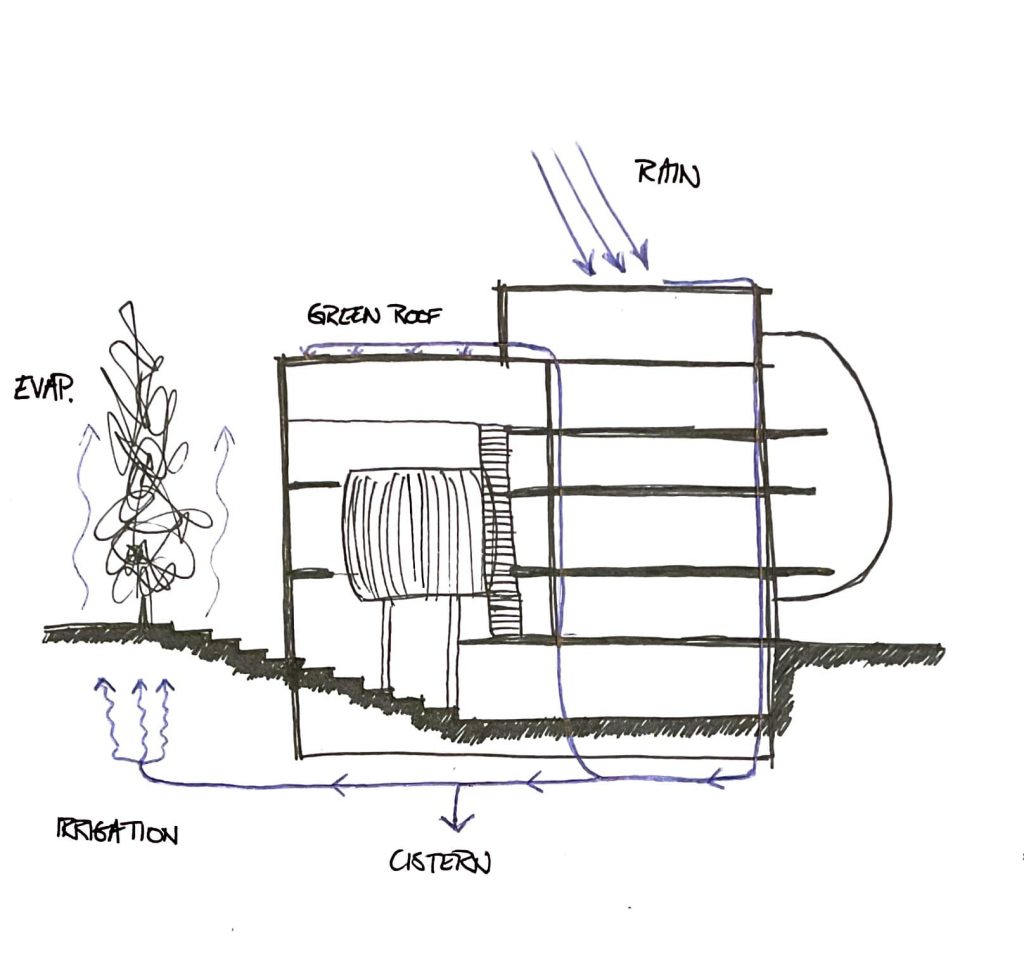
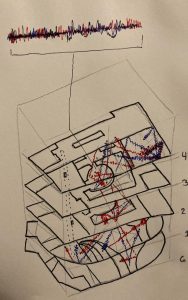
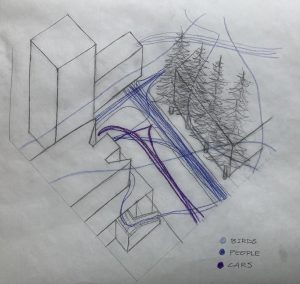
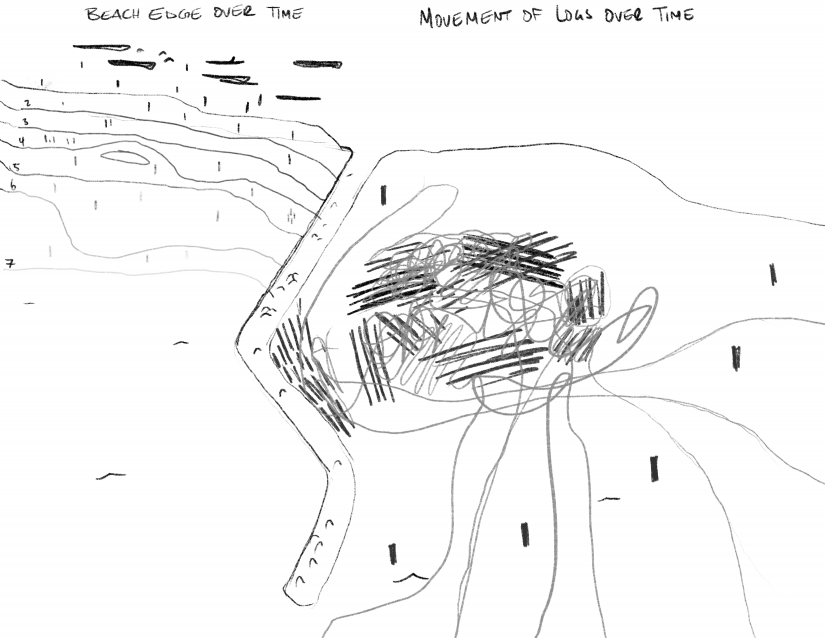
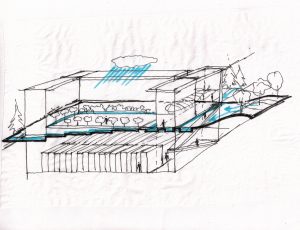
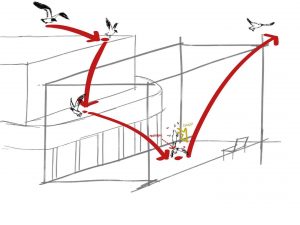
Water at, above, and below ground: The three colours of arrows represent different types of water: rain water, waste water and treated water. The diagram shows how rain water collects on the white roof, flows through the built infrastructure (roof, cistern, toilets, on-site treatment plant, irrigation system, and bioswale) and through natural system components (atmosphere, water table, soil and plants).

A4 – Chris Rothery – Analyzing Sound

From the in class exercise:

Before leaving home I spent some time thinking about the representation of sound waves. I really liked the mapping shown in class (by laureen I think?) for sound, but as the child of an audio engineer – who was reading the audio waveform of their own voice on old school analog oscilloscopes at the age of like 6 or something: I had to think about sound as a wafevorm, with its amplitude and directionality, bouncing off of hard surfaces. So drawing it here was my first experiment with that form of linework.

When I got into the nest, I noticed a big sign by the door I was by with axonometric floorplans for wayfinding. I took this as a convenience and as inspiration for the format of my drawing. This process work focused on getting the floorplans about right and analyzing sources and direction of sound.

From the top floor, looking down on the suspended classroom – which is the part of the Nest that I actually always assume inspired the name “nest” – I decided to try a 2d perspective plan view, because it kind of felt like the natural drawing to try this in.

ultimately, the final stacked axonometric felt the most satisfying though.

I also wanted to retouch the globe drawing from the beaty biodiversity museum as suggested. I tried the digital drawing process here. I have mostly good feelings about the result.

Week 3

In-Class Assignment

Tracking traffic, birds and people outside my building.

Assignment 3
During in-class assignment, I really enjoyed tracking birds’ movements and figured I would do it again with a hummingbird that I’ve noticed outside my apartment – it is there in the same spot everyday. I turned on my stopwatch and noted every time the bird was chirping, silent, flying to the bird feeder on a balcony, etc. I found it hard to represent time in the spatial diagram, so I drew a separate sound diagram. However, it would be interesting to figure out how to combine the two.


Notes from watching


Draft sketch


Sound diagram


Final diagram

Kristian Lebitania- Assignment 3

In-class exercise

I mapped airplanes at Kitsilano Beach Tuesday Evening. Sitting on a bench, I observed several planes and their paths in the span of 30 minutes. The most significant planes I noticed first were the ones that flew directly overhead. They were only minutes apart on the same path and direction. For 10 minutes I spotted no planes until another group of planes came from the opposite direction on another path. During this time I also spotted planes north of the mountains that ran east and west.

In this map I try to achieve the plane paths and their movement in the sky. Using thick lines, the pressure of lines show the direction of the path and a sense of time (I thought about jets during the day that leave vanishing smoke paths). I also tried to convey the auditory experience of the planes by showing clearer and heavier lines for the paths nearest to me. I thought the use of a dome rather than a cube would better show my site experience because it was dark out and the landscape, water, and shoreline were the only clear reference points to map out the plane’s location in the atmosphere (showing sense of plane path location with vertical dotted lines).


Assignment 03

In-class mapping exercise. An eagle’s flight path over time. Eventually the eagle left the site and flew off into the forest.

A visit to Beaty Biodiversity Museum. I started with a plan of wetness and jotting down observations. The two sections and axonometric show how water moves through the site.

A map of environmental conditions across a site section, cutting through the stormwater feature. The map shows how the environmental conditions influence plant density across the site. The y-axis for lightness and density plots relative quantities.