This report has been prepared in order to assess the potential relationship between being an ethnic minority and negative perceptions of the LGBT community. The “American National Election Study” dataset was utilized in order to produce this statistical report using measures from 2016. The primary independent variable, ethnic minority, is operationalized through a binary self-identification of ethnic minority status (vismin). Additionally, the dependent variable is perceptions of the LGBT community – quantified by an index comprising of feeling thermometers towards gay/lesbians and transgender people (ftlgbt).
Minority groups often hold stronger cultural values and beliefs in comparison to their native white counterparts. More often than not, established traditional values tend to be culturally embedded in ethnic belief systems, and thus conflict with acceptance of the LGBT community. As a result, we can theorize that traditional principles within ethnic communities negatively impacts their perception of the LGBT community.
In order to get an accurate estimate of this relationship, it is vital to control for other possible, confounding variables that may alter the relationship between ethnic minority status and perceptions of the LGBT community. For this study, one confounding variable I controlled for was education (educ) – 1 operationalized as the highest level of formal education the respondent received. Minorities often face systematic racial barriers resulting in lower levels of education in comparison to their Caucasian counterparts. Education levels are also linked to the dependent variable, LGBT perception, as education exposes people to rational ways of thought. Since homophobia and transphobia are fundamentally irrational ideologies, an increase in education may increase tolerance towards the LGBT. Thus, decreased education levels among minorities, in addition to anti-LBT sentiment experienced by less educated people may depict false causality, and therefore must be controlled for. I also controlled for ideology, as measured by the respondent’s placement on a Liberal to Conservative scale between 1 to 7 (lcself). A person’s political ideology often dictate whether they support the LGBT community, therefore affecting our dependent variable of LGBT perceptions. In relation to the independent variable, visible minorities are slightly more liberal, therefore controlling for party identification avoids any suppression of our true results.
After controlling for these two confounding variables, I can hypothesize that being an ethnic minority is associated with negative perceptions of the LGBT community. Prior to conducting research, it is useful to describe our key variables, their measures and scales. An index consisting of the feeling thermometer towards gay/lesbians and feeling thermometer towards transgenders measures the concept of my dependent variable, LGBT perceptions. By recoding and combining these variables, we create an index on a scale of 0 to 100 (with 100 being maximum “warmness”). The primary independent variable, ethnic minority, is operationalized through a measure of respondents’ self-identification as either White or of other ethnicities. It should be noted that this study follows the premise that the ethnic majority is white. Education, the first controlled variable, is measured by the highest level of formal education respondents attain where 1 is no high school completion and 6 is post-grad. A limitation exists within the measure as it does not capture “life experience” but rather institutionalized education. The final measure, political ideology, is measured by asking respondents to place themselves on a scale of 1 to 7 where 1 “Very Liberal” and 7 is “Very Conservative”. The measure aims to capture where respondents lie in relation to the political spectrum, with the assumption that the closer they lie towards Liberal ideology, the more likely they will possess positive LGBT perception.
After analyzing the initial data, it was found that ethnic minorities make up 27% of respondents, whereas white respondents consist of the remaining 73%. It is noteworthy that a smaller sample size of minority data may limit the accuracy of our study. Despite this, we found that on average, respondents had a mean of 54 on the LGBT feeling thermometer, with a minimum of 0 and a maximum of 100 – indicating slightly positive leaning LGBT feeling, although not significant considering our scale. Additionally, the standard deviation of 31 tells us that LGBT perceptions are quite polarized, and a histogram confirms that most respondents answered at a 0, 50 or 100 on the feeling thermometer. In regards to education, it is noteworthy that 34% completed high school and 57% of respondents had formal education past their high school diploma, thus indicating a slightly more educated sample size. Lastly, our mean of political ideology sits at 4 (on a scale of 1 to 7) with the highest percentage of respondents answer “Neither Liberal or Conservative” (27%). Moreover, the standard deviation of 2 indicates a fairly spread range of answers on a normal distribution, therefore our sample of respondents are not significantly leaning on either ends of the political spectrum.
After running a difference of means test for the data, we can analyze the relationship between ethnic minorities and LGBT perceptions. It was found that ethnic minorities, on a scale of 0 to 100, had an LGBT feeling thermometer of 54.7. In comparison to their white counterpart’s mean of 53.2, minorities had a warmer LGBT feeling thermometer by 1.5. With consideration of our scale, however, these results deem statistically insignificant. A p-value of 0.490 tells us that we would observe a relationship this big or bigger in nearly 49% of samples of this size due to random chance, if there was no relationship between these two variables. Thus, we cannot be confident that these results are reflected in our population.
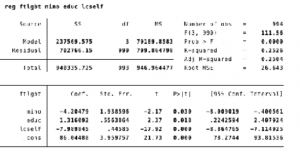
In order to control for the individual influences of each independent variable on LGBT perceptions, a multiple regression test was run (Appendix A). Not surprisingly, political ideology appears to have the largest effect on LGBT feeling thermometer. A one-point increase on the 7-point ideology scale (with higher values meaning more conservative) is associated with a 7.9 decrease in the LGBT feeling thermometer. That is to say, moving one point in the positive direction (remember: positive means towards conservative) decreases the LGBT feeling thermometer by 7.9 – a sizeable decrease considering our scale and therefore indicates a modest-strong relationship. The p-value of 0.0001 tells us that we would observe a relationship this big or bigger in only 0.0001% of samples due to random chance. Education levels also appears to have a slightly positive effect in the predicted direction. A one-unit increase in education levels on a scale of 1 to 6 (with 6 being higher education), is associated with a 1.3 increase on the LGBT feeling thermometer. The coefficient is not statistically significant in reference to our scale, and even a jump from 1 (No high school completion) to 6 (Post-grad) would increase LGBT perception in the positive direction by only 6.6. The p-value of 0.018 means that we would find a regression coefficient this large in 1.8% of samples of this size due to randomness of sampling alone. Consequently, we can infer that these results are statistically significant. Lastly, when we ran a multivariate regression controlling for ideology and education, we see a dramatic change from our initial difference of means test. Being an ethnic minority is associated with a 4.2 decrease in LGBT perceptions on a scale of 0-100, with 100 being maximum LGBT “warm” feeling. The coefficient is moderately generous on our scale, and indicates a modest relationship. The p-value of 0.030 also indicated we would find a coefficient of this magnitude in less than 3% of samples, if there was no relationship. Hence we can be confident in this result and reject the null hypothesis at the 0.05-level.
In conclusion, the null hypothesis stating that there is no relationship between being an ethnic minority and negative LGBT perceptions can be rejected. As the multiple regression data shows, there exists statistically significant relationship when we controlled for education and political ideology. Our data infers that ethnic minorities, in comparison to white respondents, possess overall lower LGBT perceptions.
Note: While I initially wanted to control for religiosity, no measures within the ANES 2016 small data set operationalized this 1 measure validly.
Appendix A: