Contours
Characteristics of Contour Lines
Contour lines are a graphic device used for hundreds of years to describe three-dimensional land form through a two-dimensional drawing or image. As a graphic, they have a long and rich history (check out the Great Lines website from Karen Rann for a look into their history) and they are still in wide use in the design and construction industries today. Even for designers working through digital models in which three-dimensional land form is represented as surfaces and meshes, contour lines provide an efficient way to visualize more information (ie, slope, drainage, relative heights, etc.) from a three-dimensional model without relying on simulated light or rendering. They also remain critical for translating designs into contour plans that contractors can use to construct earthwork.
Contours are horizontal section profiles:
Every contour line forms a closed polygon, even if its full extents are not shown within the boundary of your drawing or survey:
The steepest slope from any point on a contour line is the perpendicular line (the shortest line) to the next contour line down (ie, where the greatest vertical change is achieved in the shortest horizontal distance). Consistent with the preceding point, water flows along the shortest line (the perpendicular line) between contours until it reaches a low point (LP) / depression / water body:
Contour lines also follow these general rules:
-
- "The steepness of slope increases as the distance between contour lines decreases." (Strom, 2013)
- "Equally spaced contour lines indicate a constant / uniform slope." (Strom, 2013)
- "Contour lines never cross except where there is an overhanging cliff, natural bridge, or other similar phenomenon." (Strom, 2013)
- "Contour lines never divide or split." (Strom, 2013)
Strom, Steven, Kurt Nathan, and Jake Woland. 2013. Site engineering for landscape architects. Hoboken: John Wiley & Sons.
Graphic Standards for Contour Lines
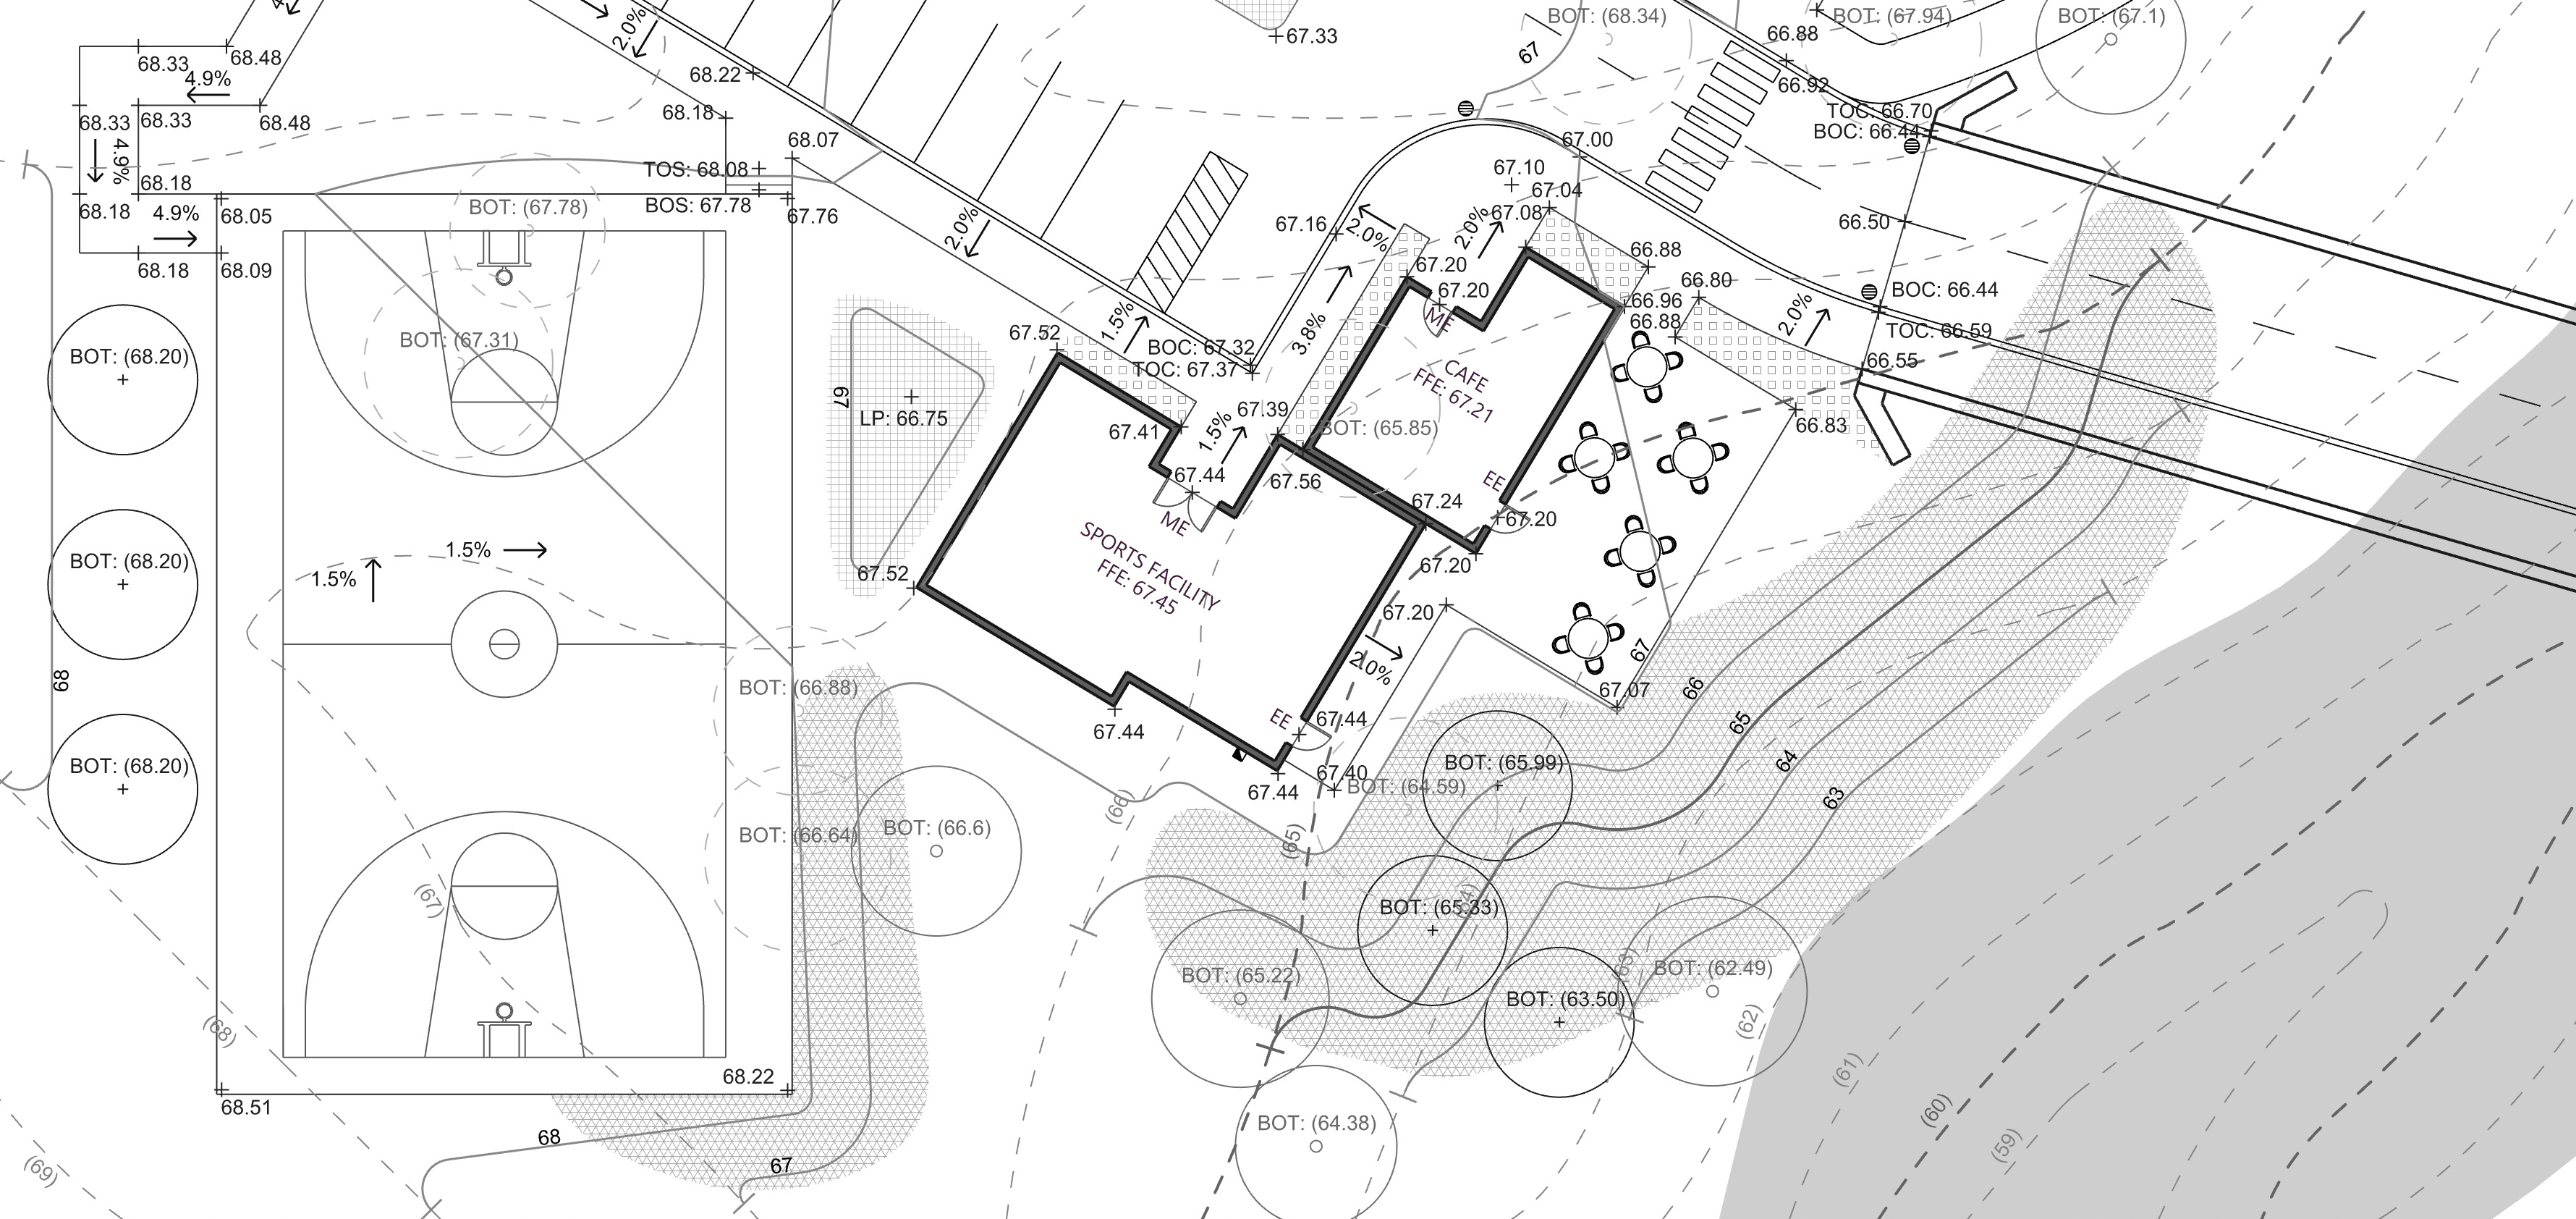
Below is a snapshot of a proposed grading plan. Plans can get busy and messy and the key is to achieve balance between information and graphic clarity. Appropriate usage of line-weights, line-types, hatching and symbols is crucial in making readable contour plans.
Some key graphic principles:
-
-
- Every fifth contour is bold.
- Contours should generally be expressed as whole numbers (except when using 0.5m or 0.25m contours, in which cases the smallest decimal possible should be used).
- Contour labels always go on the uphill side of the contour.
- Spot elevations should be labeled with a consistent graphic where contour lines are insufficient to express the landform; identified to the hundredth of a decimal.
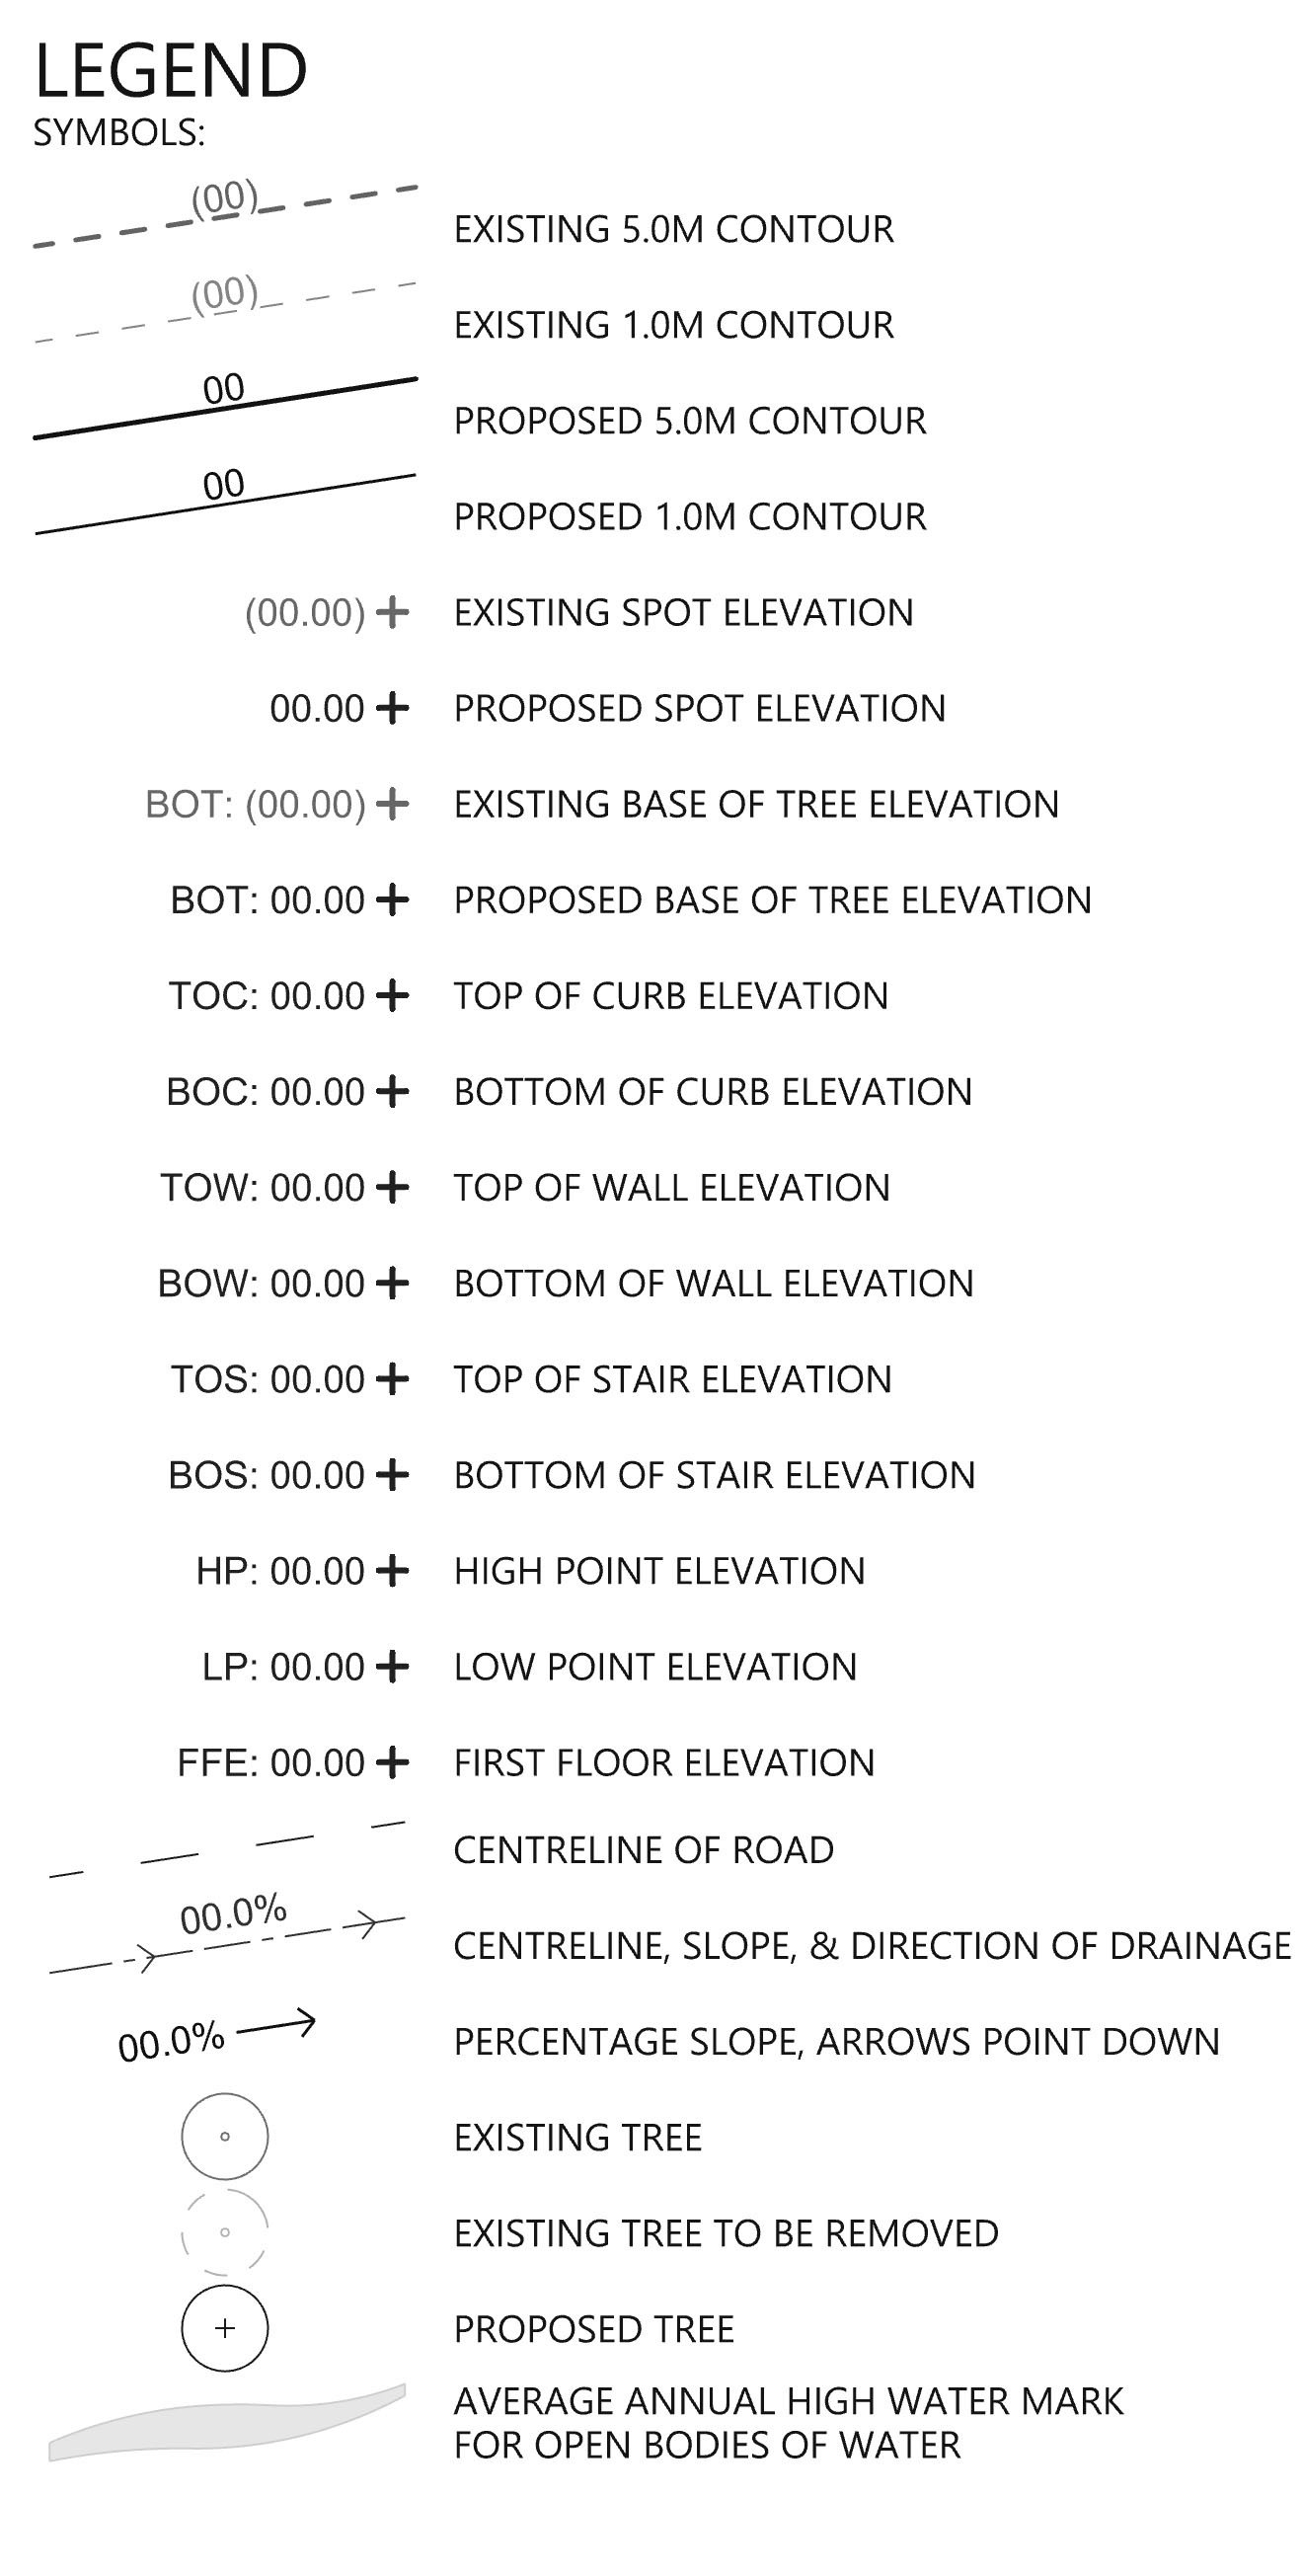
-
The legend is an integral part of any grading & drainage plan. It explains the content in the plan and insures the plan's intent is clear. The legend below demonstrates typical symbols and abbreviations used in a grading & drainage plan.