Introduction to Elevations
Elevations through Surveys & Interpolation
A topographic map or digital model is fundamental to most interventions in the built world. The topographic map is used to interpret, visualize, analyze, and design the landscape as well as to site program / buildings / other features. Topographic data is acquired through numerous methods, but the grid is a commonality between most digital methods (eg, LiDAR) and more traditional methods (eg, rod & level). The overview below provides a summary of the process to go from a grid-based survey of elevations to a topographic contour map.
To produce topographic base data, a grid is laid out across a site. The spacing of the grid depends on the survey method, the extent of the site, and the desired resolution of information (ie, a smaller grid spacing will provide a more detailed reading of the site topography). The surveyor will measure the elevations of the points on the grid in reference to a common datum or a site marker (often called a benchmark or 'point of beginning'). The information at each grid intersection is referred to as a "spot elevation".

While the spot elevation information is crucial, it is hard to visualize the topography with just a grid and set of elevation numbers. Generally, you will either want to generate a contour plan through interpolation or create a digital model by transposing the points to their correct elevations and creating a mesh or NURBS surface through the points.
While it sometimes happens that you will need to measure spot elevations to field-check site conditions for a design proposal, you should generally rely on the legal survey for all elevation information. More commonly, you will need to translate survey-provided elevation data into something you can visualize and design with. The focus in the next section will be on interpreting (through interpolation) grid-based elevation data. Check the videos in the Links/Other Resources section below for more detailed information on common surveying methods.
Interpolation Method
Interpolating topographic survey information provides us with a visual base to design with. Traditionally, this has meant locating regular contour intervals between survey points (eg, 1 meter, 0.5 meter, 1 foot, or 6 inch contour intervals). Interpolation can also include, however, the creation of a mesh or 3D surface through the survey points.
The basic equation to manually interpolate additional elevation points is described below, where the proportion of horizontal distance is assumed to be the same as the proportion of elevation (or vertical) distance:
d / D = e / E
or, to solve for the location of an interpolated point, the equation can be written as:
d = ( e / E ) * D
in which:
D = distance between survey points
E = total elevation change between survey points
e = elevation change between a survey point and a contour crossing
d = distance from survey point to an intermediate point
An example of the interpolation process is described below:
 For any given grid of elevations, you can interpolate (estimate) approximately where other elevations occur between the given points. Keep in mind that interpolated points are estimates only -- you cannot hold your surveyor accountable for discrepancies between field conditions and elevations or contour lines that you interpolate yourself.
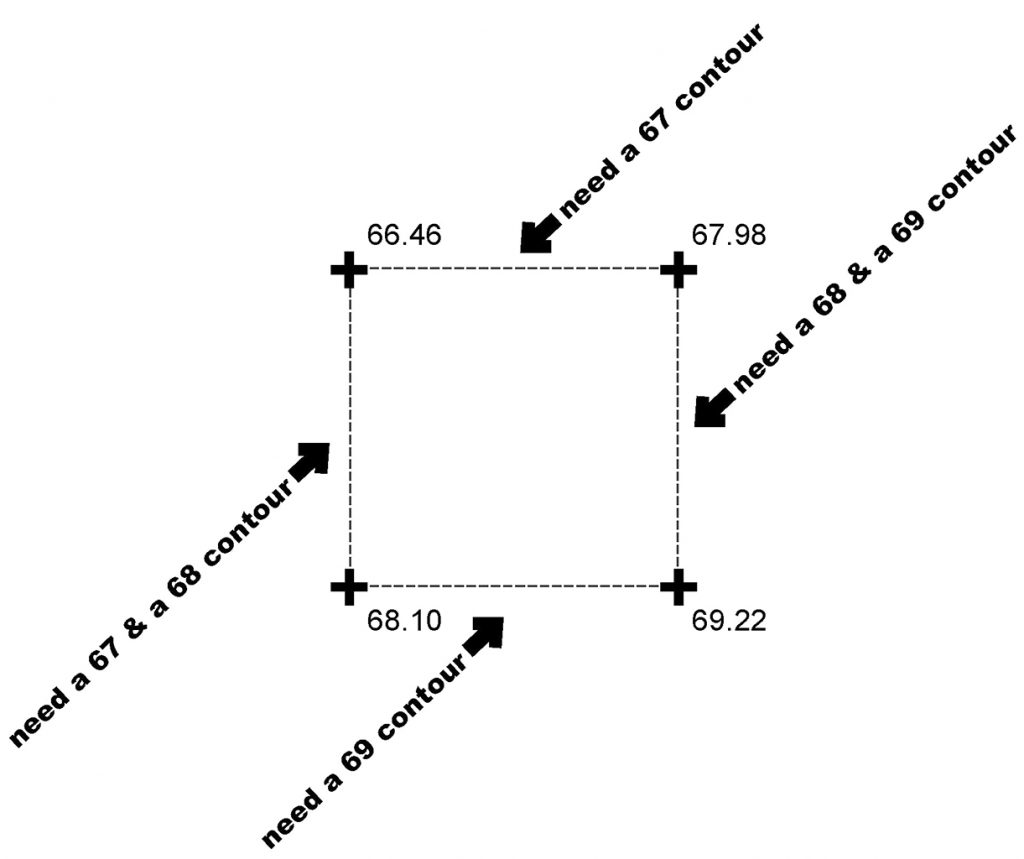
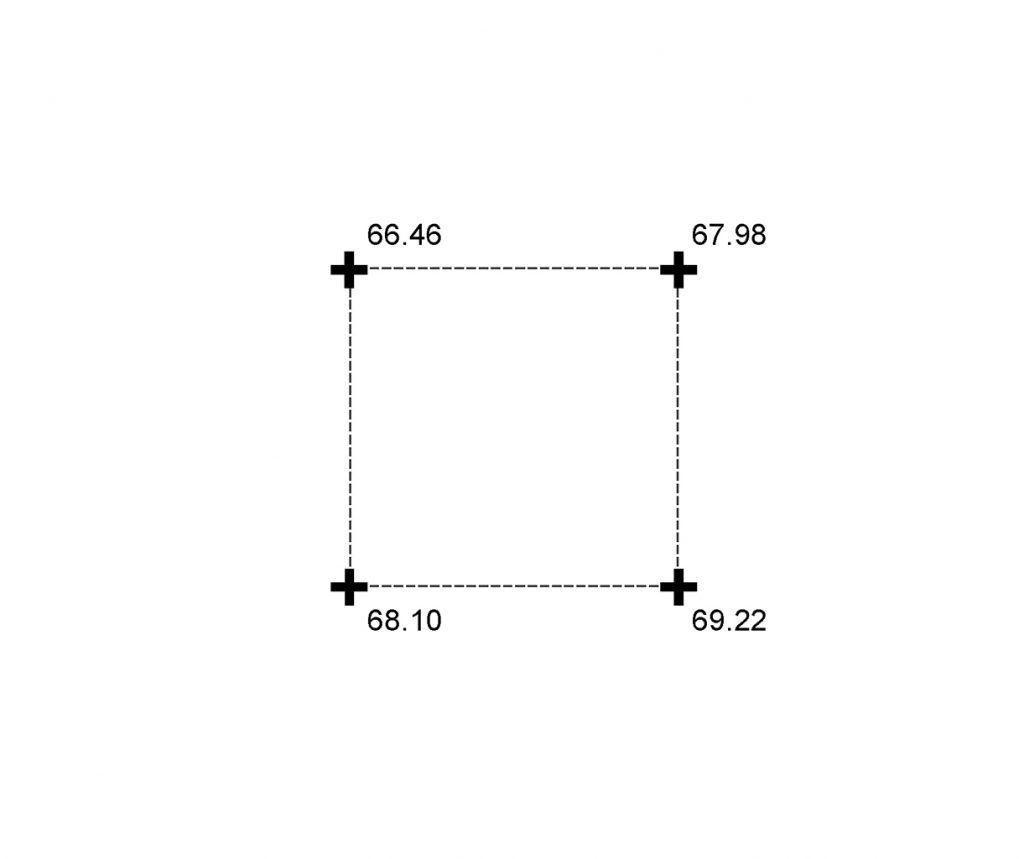
Step 1: Identify Contours -- check the given spot elevations for the occurrence of contour line crossings. Here, a 10-unit square grid is provided and we are interested in a 1-unit contour interval. We can see where to expect the contour lines to cross the survey grid simply by comparing the given elevations.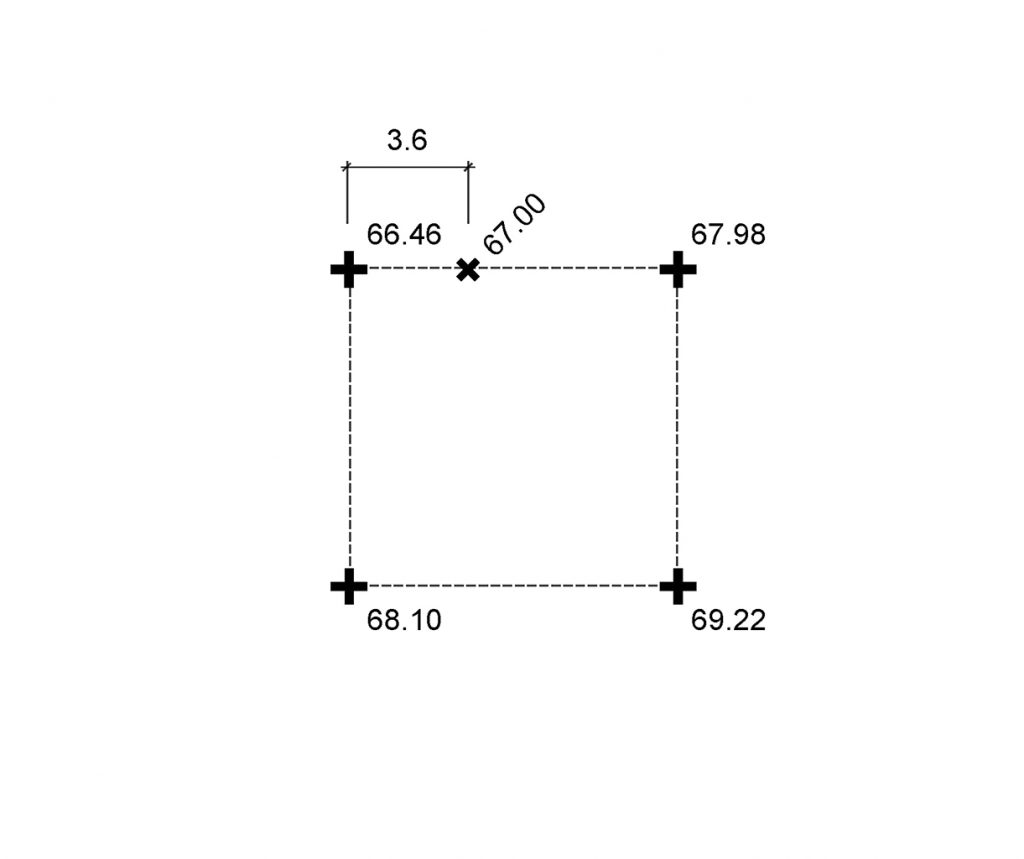
Step 2: Interpolate -- use the equation provided above to find where the contour lines intersect the survey grid. In the above example, the 67.00 contour line can be identified as crossing 3.6-units from the top-left survey point because the overall distance between survey points is given ( D = 10 ); the total elevation change between survey points ( E = 67.98 - 66.46 = 1.52 ); and we know the elevation change between the survey point in the top left and the desired intermediate point ( e = 67.00 - 66.46 = 0.54 ). With this information and the equation provided above, we can solve for the distance from the survey point to our desired intermediate point:
d = ( e / E ) * D
d = ( 0.54 / 1.52 ) * 10
d = 3.55
. . . which we round to:
3.6-units

Step 3: Connect contours -- after you have worked your way around the grid and interpolated all contour line crossings, you can 'connect the dots' to find the approximate location of contour lines.
To get a better grasp of interpolation and see a more detailed step-by-step guide to interpolation, please reference the Rhino file in the "Tools" section. The download also includes some ways of automating this process.