In this lab, spatial distribution of crime and related data was analyzed in ArcMap and CrimeStat. Data was taken from the Ottawa Police Department, Statistics Canada and DTMI. Analyses were ran looking at residential breaking and entering (B&E), commercial breaking and entering and auto (car) theft.
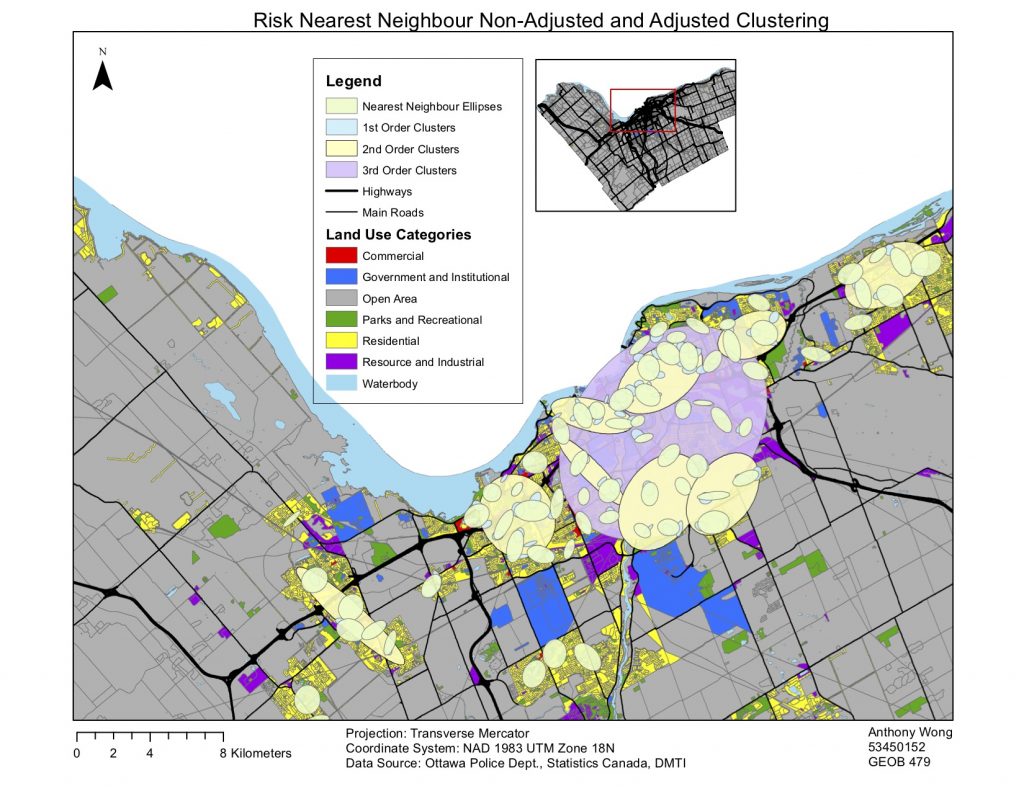
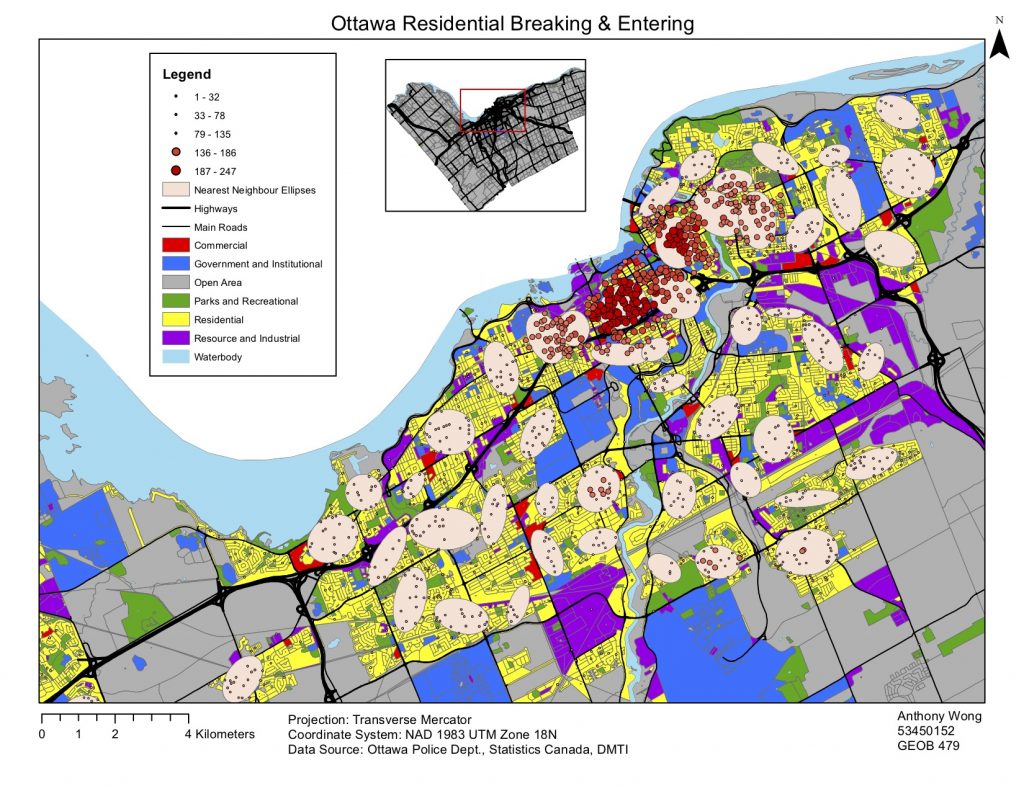
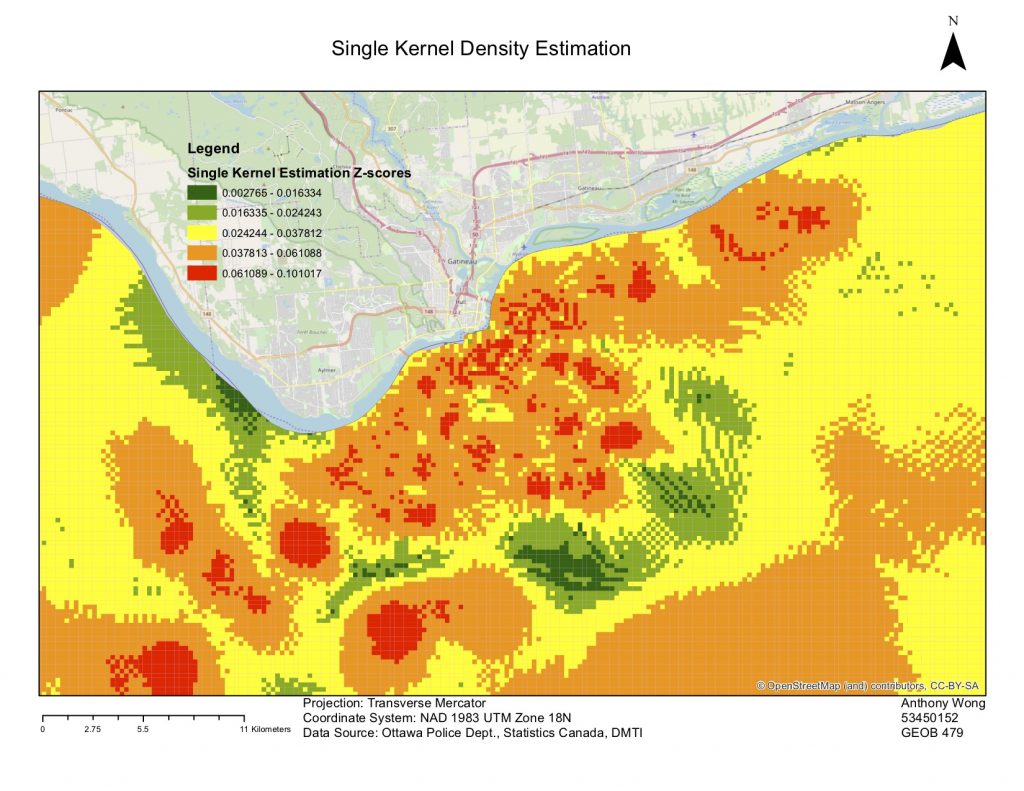
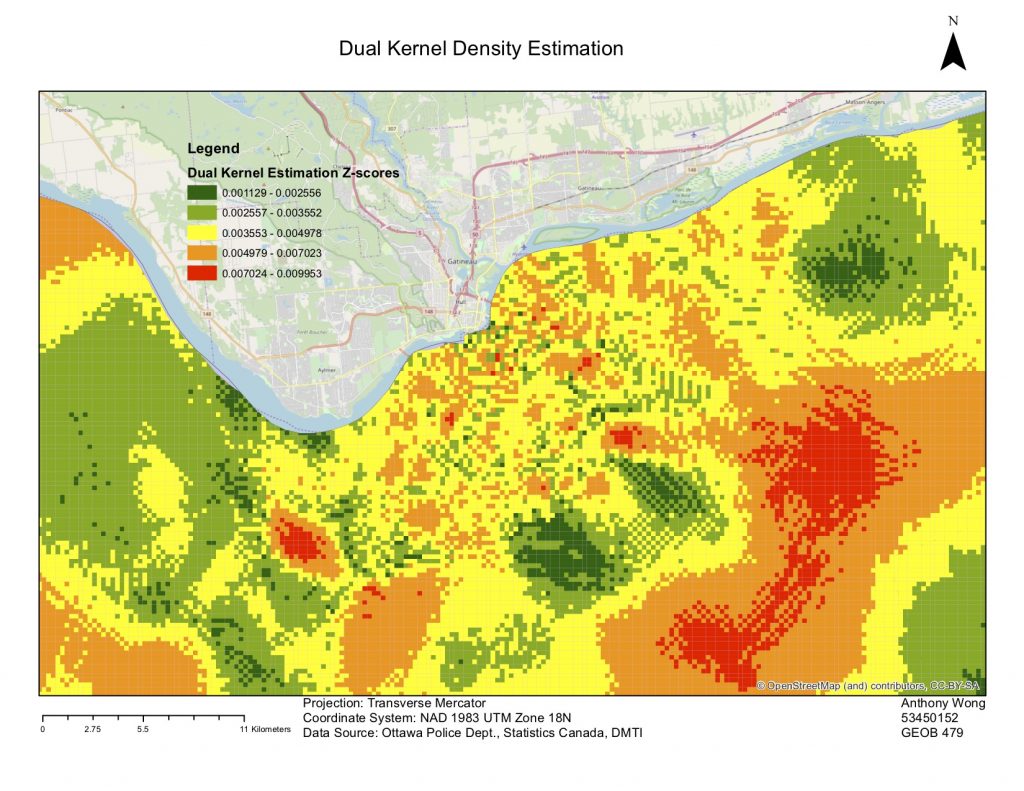
The first step was to do a nearest neighbour analysis showing whether the events for each of the three types of crimes were spatially autocorrelated. Following I used the fuzzy mode analysis and risk adjusted nearest neighbour clustering. The final analysis conducted was kernel density (single and dual).