The Netherlands’s Approach to a Circular Economy in the Construction Sector

The Netherlands is a small country in Europe with a population around 17 million.  As a country with limited raw materials they have grown to understand the importance of recycling and limiting their resource consumption.  Since implementing their Circular Economy Plan in 2016, they have set up two important target dates.  The country wants to reduce consumption of raw materials such as oil, metals, and minerals by as much as 50% by 2030.  The other target is to develop a completely circular economy by 2050 (MIE, 2016).  A circular economy attempts to close material loops and prevent discarded waste from entering landfills by implementing better designs, better maintenance, recycling, reusing, or refurbishing practices.

The construction sector is a major source of waste.  Profit-driven motives allow for constant building taking place throughout the world without any regard to the waste generated.  The building and demolition process produces an immense amount of waste.  In the US, it is projected that 40% of landfill input comes from construction waste totaling 251 million tons a year (Hower, 2013).  In the Netherlands, while the total volume does not compare to the US, the construction sector is similar in its relative consumption of materials.  The construction industry accounts for 50% of the raw materials used, 40% of the energy used, and 30% of the water consumption (MIE, 2016).  These are staggering numbers that can hopefully be reduced considerably by the implementation of the Netherlands’s Circular Economy Plan.

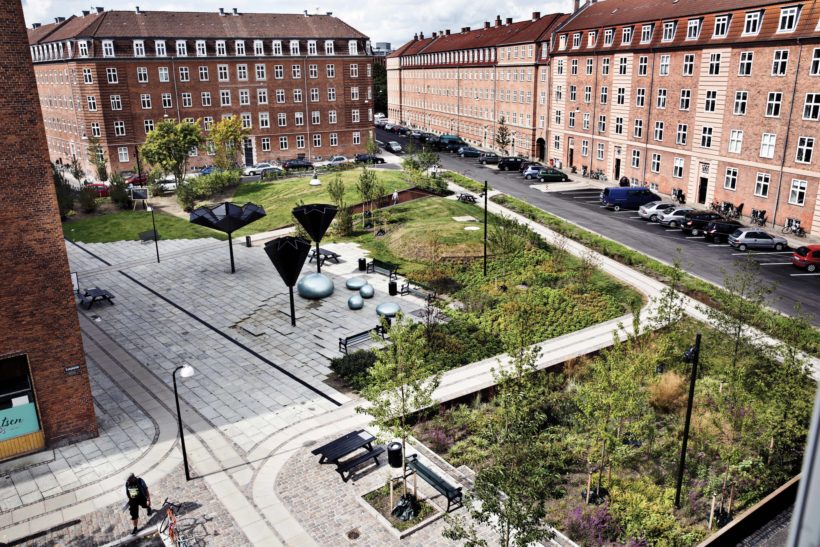
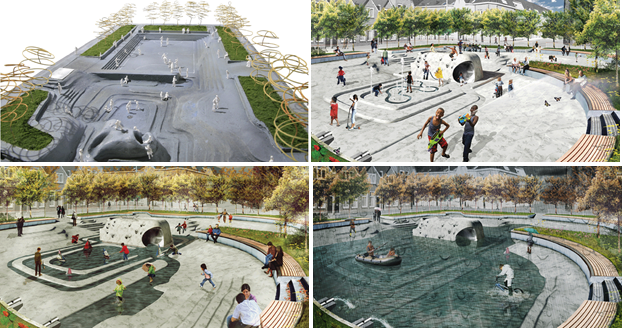
The Netherlands has put in place several initiatives to make the construction of buildings energy neutral by 2050.  The goal is to incorporate the loss of energy and materials utilized in the construction of the building to be minimized by the long term viability of the building design.  New buildings will utilize the ecosystem services wherever they can.  Ecosystem services provide benefits through the natural environment.  One ecosystem service that is easy to provide in the Netherlands is water storage as they receive a large amount of rainfall every year. Through the use of on-site water storage, the building can provide much more water over the course of the building’s life than was used in the construction.

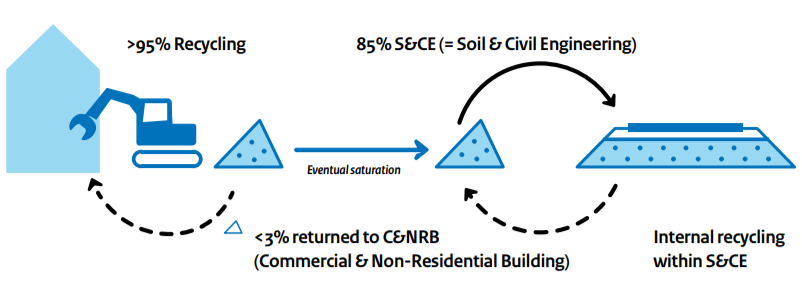
Figure 1 – Circular Economy in the Construction Sector (MIE, 2016)

Demolition waste is easily reused in other construction projects in the Netherlands.  85% of demolition waste is ground up into granulate and used as foundation base on other projects.  It is key to have a solid, well-compacted foundation in the Netherlands as most of the country lies below sea level with somewhat saturated soils.  Figure 1 shows how the demolition waste is recycled.  “Soil & Civil Engineering” is the granulate used for foundation at other construction sites.  The same can be said for road projects in the Netherlands.  Roads after one life cycle can be reusable for new roads and then are processed and used as road base after more than one life cycle.

The Circular Economy Plan also must provide plenty of incentives for companies to develop further technologies that can be implemented to drive sustainable practices in the construction sector.  The Netherlands has set up a system called “Green Deals.” These deals encourage both private and public companies to come up with solutions to close the material loops while also stimulating economic growth (Government of the Netherlands).  “Green Deals” have already been established in the innovative use of bio-based construction materials.  Other “Green Deals” established have been based on implementing natural solutions to building climate control and energy efficiency in building operations.

The Netherlands has been proactive on their approach to adapting a circular economy.  One of the most important aspects of their plan is the continued efforts to reach out and communicate with other countries to assess what works and what doesn’t in terms of sustainable practices.  The Ministry of Infrastructure and the Environment has organized teams from various sectors to come together and collaborate on innovative initiatives to achieve the most sustainable practices in the construction sector.  The government has taken an active role in monitoring the progress and implementation of construction sustainability practices (MIE, 2016).

The Netherlands implementation of their Circular Economy Plan outlines detailed plans for not only the construction waste but also plastics, food waste, consumer goods, and manufacturing waste .  All of these areas, if properly planned out, can greatly reduce the countries dependence on acquiring more raw materials in the future.  The Netherlands can become more self-sufficient and in turn be a more sustainable society in the future.  Their initiatives outlined in their Circular Economy Plan may set the precedent for other countries moving forward as the importance of a sustainable and self-sufficient society are realized.

Source:

Government of the Netherlands. Green Deal. Netherlands Government. Retrieved December 17, 2018, from https://www.greendeals.nl/english

Hower, Mike. (2013). PlanetReuse: Redirecting Building Waste from Landfill to LEED Projects. Sustainable Brands. Retrieved December 17, 2018, from https://www.sustainablebrands.com/news_and_views/waste_not/planetreuse-redirecting-building-waste-landfill-leed-projects

The Ministry of Infrastructure and the Environment (MIE). (2016). A Circular Economy in the Netherlands by 2050. Netherlands Government.  Retrieved December 17, 2018, from https://www.government.nl/documents/policy-notes/2016/09/14/a-circular-economy-in-the-netherlands-by-2050

The Effect of Contamination on the Marketability of Recyclable Waste

The marketability of recycled goods is not a concept with which most Canadians are familiar.  And yet, millions of canadians engage with the practice of recycling everyday, a practice that is predicated on the notion that there is a demand for certain types of garbage.  Ultimately, since recycled goods are products that need to be sold in order to be reused, the quality of recycled goods (like any other product on the market) is very important.  

In terms of quality, contamination is the biggest player, costing Canadian recycling programs millions every year.  When contaminated garbage is thrown out in blue bins, it is first processed as if it were recyclable, but ultimately, it ends up in the landfill.  As a result, “you basically pay twice to manage garbage,” according to Jim McKay who works for solid waste management Toronto. According to CBC news, “even a few spoonfuls of peanut butter left in a jar can contaminate a tonne of paper and make it unmarketable — destined for the dump.”  The costs associated with processing twice are not the only losses that need to be considered. Recycled garbage with a higher contamination rate, even after it has been processed to remove obvious offenders, cannot be sold as easily. As a result it needs to be discounted and sold at a cheaper price.  Therefore the costs incurred from additional processing as well as the loss in revenue are both important factors that need to be taken more seriously when developing city-wide recycling programs.

Although recycling is something that cities are beginning to take more seriously, it is clear that the tangible costs associated with contaminated recycling is a concept that too many Canadians are either unaware of or indifferent to.  Perhaps it is merely another situation which demonstrates the tragedy of the commons. Although the simplicity of this explanation might be enticing, there are large disparities between the rates of residential recycling contamination within various Canadian cities.  This disparity can be partly explained by the variety and effectiveness of city-wide recycling programs. Vancouver, for example, has one of the lowest recycling contamination rates among large Canadian cities. According to Recycle BC, the percent of contaminated products in Vancouver’s recycling system is 4.6%.  For reference, Toronto’s contamination rate is 26%, Montreal’s is 7.5%, Calgary’s is 13%, Ottawa’s is also low at 5%, and Edmonton’s is 24%.  

One of the ways Vancouver accomplishes such a low contamination rate is through stricter separation of recycled goods. Glass and paper each have their own bins/bags, and in that way both are separated from recyclable plastics.  According to Recycle BC’s Allen Langdon, recycling programs that operate in a “single-stream” manner without any further separation past the blue bin, consistently demonstrate higher rates of contamination.

The city of Surrey has increased its focus on education as a method to mitigate contamination.  One of their first initiatives was to identify specific neighborhoods with particularly poor sorting habits.  After gathering the data they were able to establish a door to door education program that targeted those specific neighborhoods in order to explain the different materials that should and should not be recycled as well as the impacts of contamination.  Currently, the city continues to identify specific households that do not adhere to the recycling guidelines and sends letters and pamphlets. If a specific household continues to be found in violation of proper recycling practices, they are temporarily barred from receiving the pick up service, and their garbage is left at the curb.  The solid waste manager at the City of Surrey, Harry Janda, reported that in 2017 on an average day, the City of Surrey issued 400 “no collection stickers” and “issued a significant number of education notices.” There are numerous tactics that a city can employ to improve recycling habits, and historically an effective education plan has been a core part of every successful city-wide initiative.  

The strides that have been taken to increase the effectiveness of recycling in certain cities demonstrates the impact that various programs and initiatives can have.  This is a promising result, and one that should not be taken lightly, especially in light of the changing economic market of recyclables. In 2017, China passed a ban on 24 types of imported waste.  This ban became effective as of January 2018, and the market has not yet reached a stabilized equilibrium. Before the ban, China had been the largest importer of waste for decades. According to the International Solid Waste association, in 2012 China imported 56% of global plastic exports, which amounted to almost 9 million metric tonnes of plastic.  In addition to the ban, China imposed new standards outlining the acceptable contamination within a given batch of recyclables. The new standards are much stricter and contaminated materials are now required to be limited to less than 0.5% of the batch. As a result, many Canadian cities have been forced to find alternative buyers for their recyclables.  

The sudden decrease in demand for recyclables has resulted in a surplus of supply, reducing the market price.  A report from Toronto’s solid waste management service estimates that in 2018 the loss in revenue as a result of the changing market will be about 5.2 million dollars for the City of Toronto.  With most goods, this decrease in price would cause a decrease in supply and a new equilibrium would balance out in time. However recyclables are most often a by-product of the purchase of other goods (which have been packaged in plastic).  And the decrease in demand for this packaging will not necessarily deter consumers from purchasing the good that has been wrapped in plastic. Unless consumer behavior is drastically changed or a new demand emerges, it is possible that a large amount of recyclable waste (which had previously been sold to China) will end up in landfills.  One advantage of China’s import waste ban is that it puts added pressure on exporting nations to reduce the amount of garbage they produce. The ‘out of sight out of mind’ mentality is easy to sustain when garbage is being shipped off to another continent, but now that this option has been drastically reduced, it could provide a powerful opportunity for change.  


References

https://recyclebc.ca/what-is-contamination/

https://www.statcan.gc.ca/eng/start

https://www.cbc.ca/news/technology/recycling-contamination-1.4606893

https://www.toronto.ca/legdocs/mmis/2018/pw/bgrd/backgroundfile-113576.pdf

https://www.iswa.org/fileadmin/galleries/Task_Forces/TFGWM_Report_GRM_Plastic_China_LR.pdf

https://www.surreynowleader.com/news/surrey-aggressively-tackling-recycling-contamination-to-avoid-hefty-fines/

http://www.greenpeace.org/eastasia/press/releases/toxics/2017/Chinas-ban-on-imports-of-24-types-of-waste-is-a-wake-up-call-to-the-world—Greenpeace/


Adapting to Climate Change: Flexibility in Resilient Cities

With pressures of climate change becoming a major global issue, the idea of resilient cities has become somewhat of a buzzword. I would like to focus on one overarching theme in resilient city literature and solutions: flexibility. 100 Resilient Cities defines urban resilience as “the capacity of individuals, communities, institutions, businesses, and systems within a city to survive, adapt, and grow no matter what kinds of chronic stresses and acute shocks they experience.” This is achieved “By strengthening the underlying fabric of a city and better understanding the potential shocks and stresses it may face.”

Change is inevitable, so our cities must be able to absorb impacts, react and adapt accordingly. However, infrastructure is usually something seen as permanent and lasting (de Haan). In mechanics, one learns that brittle fracture is much more dangerous than ductile fracture. It acts as a warning of the damage to come, and can absorb more energy prior to fracture, resulting in a stronger and more resilient structure. Why not apply this at a city scale?

In general, flexibility means the possibility to introduce certain options with the assumption of changing configuration of system parameters or system components in time (Kośmieja and Pasławski). De Haan points out that “the complexity of, especially nowadays, infrastructure systems suggests that we step away from attempts to control circumstances and prepare for their consequences.” My interpretation of flexible infrastructure lies in understanding that there are different possible outcomes and acknowledging that cites (and environments) change.

Flexibility can come in different scales. For example, buildings can be designed to be more seismically sound by including literal flexible materials within them, such as timber. This can be seen in Tūranga, the new central library in Christchurch, New Zealand, designed by Schmidt Hammer Lassen of Denmark. The building includes a “seismic force-resisting system [that] is made up of a series of massive concrete walls that can rock and shift to isolate the building from peak accelerations during an earthquake.” Along with the use of pre-tensioned steel cables that stretch and flex, allowing the building to right-itself in the event of swaying, this structure is virtually earthquake-proof.

At a larger scale, the Østerbro neighbourhood of Copenhagen is a resilient neighbourhood that incorporates flexibility in rainfall systems. Due to climate change, Copenhagen has dealt with increasing levels of high-intensity rainfall that original systems could not cope with. In the creating of resilient infrastructure, these increased rainwater levels were seen as an opportunity, rather than an issue that needed to be removed. As the old rainwater management systems could not be changed (an example of the rigidity of non-resilient infrastructure), and due to minimal space restrictions, new innovations needed to be implemented locally and in tandem with increases in public green spaces. For example, in Tåsinge Plads, a square in the community, rainwater is diverted away from roofs and squares to keep the water out of sewers, while the storm water is collected in green urban areas to support the incorporation of wild urban nature in the community. In the few paved areas, ‘water parasols’ were created for children as play elements, that double as catchment basins that pump water through small channels to green spots (these are the inverted umbrella-like black structures in the image below). Here, it is important to see that flexibility is not just physical, it is a mindset – and one must bring a systems thinking approach to planning for flexibility.

One of my favourite examples of resilient infrastructure can be seen in Rotterdam. Similar water issues are being dealt with here, where water squares have been created to act as social spaces, but in the event of flooding, can also hold excess water. The flexibility in this site is clear, with multiple functions that addresses urban social living along with sustainable solutions simply, without the need for any advanced technical solutions or materials.

Urban resiliency is a buzzword for a reason: it is vital that cities address issues of our changing environments immediately, as well as do what is possible to prevent further global environmental degradation. A key component to this change is to introduce flexibility in approaching problems and at different scales. The Anthropocene is upon us, human activity is indeed the strongest geo-technical force at this moment, but why not try and make this impact a positive one?

OTHER RESOURCES

Maria Kośmieja, Jerzy Pasławski – https://doi.org/10.1016/j.proeng.2015.10.013

de Haan – https://doi.org/10.1016/j.futures.2011.06.001

http://www.rotterdamclimateinitiative.nl/documents/2015- enouder/Documenten/20121210_RAS_EN_lr_versie_4.pdf

https://www.sciencedirect.com/science/article/pii/S0016328711001352

https://link.springer.com/content/pdf/10.1007%2F978-3-319-49730-3.pdf

https://www.curbed.com/2018/5/11/17346550/organic-architecture-infrastructure-green-design

https://www.worldbank.org/en/results/2017/12/01/resilient-cities

https://openknowledge.worldbank.org/handle/10986/11986

https://www.resilientcity.org/index.cfm?id=11900

https://www.iiste.org/Journals/index.php/CER/article/viewFile/38207/39282

http://www.100resilientcities.org/resources/

Psychology & Waste: How Understanding Behavioural Decision-making Can Help us Manage our Landfills

Human behaviour is often neglected in the design of our urban systems, simply due to its complexity. New and emerging research is now focusing on how behavioural decision-making can be linked to our environmental needs. For recycling and consumption of products, it is important to consider them as behaviours, such as healthy eating and exercise; while we know those behaviours are good for us, we may not always behave that way due to numerous psychological reasons.

So how effective is it to truly consider psychology in design? In a study called “It Matters a Hole Lot”, changing the shape of the recycling container lid, increased correct recycling by 34%, allowing for less contamination in waste streams. This shows that visually manipulating the users’ behaviours educates and also enforces correct behaviours.

Researchers at UBC experimented in residential buildings on how the distance to recycling and composting bins can affect the volume recycled. Results showed that conveniently placing the recycling bins 1.5 meters away from residence doors can increase recycling up to 141%. The same researchers state that education is a traditional mechanism on increasing recycling and composting, instead, they believe that convenience has been observed to be of a much larger impact as observed in their study.

In contrast, the availability of recycling services can enable people to produce more waste and affect their behaviour, as a consumer, knowing that it can be recycled later on. The act of recycling does not guarantee that recyclables will not end up in the landfill and thus must be our last resort. In Recycling Gone Bad, researchers determined that recycling behaviour is linked to the rebound effect, defined as the reduced costs accompanying technological improvements in efficiency may have the unintended consequence of increasing consumer demand. An example of the rebound effect: the recycling symbol, invented by the beverage industry, may encourage the consumption of these beverages as it removes the guilt linked to increased consumption.

It is important to focus on reducing waste overall and not invest all of our recourses in proper recycling. Throw-away culture has enabled a behaviour of purchasing goods that exceed our needs and often end up as waste. While recycling is critical to a closed-loop economy, behavioural changes must be considered. In order to break the throw-away culture cycle, one must adopt the first R of the 5R’s pledge. Refusing samples, gifts, plastics bags, etc. instead of accepting them simply because they are free, will allow us to overcome our culture that is not able to say no. Our society must become comfortable saying no – if a gift is of no use to you,  refuse it. Acquiring a lesser amount of belongings will lower the demand for their production and inevitably divert them from our landfills.

Next time you are at a conference, take a look around you and count how many tote bags, full of brochures,  will end up at our landfill. In the United States, the promotional products industry is estimated to be $24 billion. If companies are looking for their attendees to remember the conference long after, they could invest in the experience as opposed to free swag. A good meal, at a conference, goes way farther and shows the company’s commitment to the quality of the conference.

But what if we changed people’s behaviour to use less? A study from the University of Arizona discovered through their experiment that utilizing people’s desire to “fit in” can also influence their behavioural decision making. When hotel guests were informed through signage (as shown below) that previous guests, in the same room, have reused their towels, it allowed for a 33% increase in towel reuse.

Image result for hotel tags for towel reuse

Strategic changes to people’s unsustainable consumption must understand habitual behaviour. Habitual behaviour is ingrained and automatic to situational cues and often proves many interventions as ineffective. One area that is being explored in intervening unsustainable behaviour is nudge theory, which uses “positive reinforcement and indirect suggestions as ways to influence the behaviour and decision making of groups or individuals.” Nudge theory is seen here at the University of British Columbia, where a 25-cent levy was introduced on non-reusable cups to gently encourage consumers to bring their own cups. Is 25-cents enough to influence someone’s behaviour in this day and age? This remains a topic of controversy in many settings where a levy was introduced.

The amount of tax imposed on single-use plastics has been highly controversial, throughout the world, and not many nations have been successfully able to phase out plastic bag usage using a tax system. Although, Ireland has been a great leader on this front:

In 2002 Ireland became the first country to impose a plastic bag levy. It led to a 90% drop in use of plastic bags, with one billion fewer bags used, and it generated $9.6 million for a green fund supporting environmental projects. In addition there is much less roadside litter from plastic bags. Ironically, with the success of the program, and people bringing their own reusable carriers to shop, the proceeds from the levy have fallen and there is less money for supporting environmental projects.

As for today’s designers & engineers, it is important to consider the behaviour of users we are designing for. Nudge theory can be applied to less energy usage in buildings, less water usage and less plastic consumption. Psychology is applicable to all fields of design in which humans are involved.  Ignoring the ways humans behave is simply foolish and a waste of our resources at such a critical time of our environmental crisis. Educating consumers remains to be insufficient for altering decisions and intentions are often not reflective of behaviours.


Solid Waste Flows: The Polystyrene Challenge

Polystyrene, commonly known as Styrofoam, can take a million years to break down! That is a long time, and it can have a major impact on landfills as well as on our health. Currently polystyrene makes up about 30% of US landfills, but did you know it is actually recyclable. It doesn’t need to go to the landfill at all. In Canada about 35% of municipalities recycle polystyrene (Plastics.ca).

While there are a number of ways to work with polystyrene at the end of its life, the best course of action in to reduce its use. Polystyrene is used in almost every industry and has characteristics that make it good for storing and packaging items. As more alternatives become available for these uses, the first step should be to reduce its use. Vancouver is taking a lead in this area as they implement a Single Use Item Reduction Strategy (City of Vancouver, 2018).

When reduction has taken place and polystyrene is only being used when it absolutely needs to be, the best end of life strategy is to recycle it. As a product that is made up of 90% air, the challenge with recycling polystyrene is the transportation costs as it takes up a lot of space. A solution to this is to put it through a compactor process before shipping it to a recycling facility. This not only increases the amount that can be transported per truck by twenty times, but also increases the value of the recycled material (Plastics.ca). Once recycled, polystyrene, as a thermos plastic, is used in a number of applications including being shredded for further packaging or being condensed into picture frames and hangers (EcoMENA, 2013).

Overall polystyrene presents a challenge to the waste industry as it is commonly used and often misunderstood. Utilizing proper waste management techniques and looking at the processes set out in the Circular Economy framework, we can work together to reduce the waste in our landfills and redirect the polystyrene to a better end of life use.

Sources:

City of Vancouver. (2018) Single-Use Item Reduction Strategy. Retrieved from: https://vancouver.ca/green-vancouver/single-use-items.aspx

EcoMENA. (2013) Dealing With Polystyrene Wastes. Retrieved from: https://www.ecomena.org/polystyrene-wastes/

Plastics.ca. (N.D.) Polystyrene. Retrieved from: https://www.plastics.ca/PlasticTopics/RecyclingPlastics/RecyclingPlasticFacts/Polystyrene

Construction Materials in a Circular Economy

Solid waste flows examine the movement of solid materials in an urban system via extraction, manufacturing, transportation, reuse, and disposal processes. In a traditional linear economy, materials are simply produced, consumed, and disposed of. This open-ended approach does not attempt to recycle materials and would require an infinite supply of resources and the ability to store waste materials. A circular economy (CE) is a regenerative alternative that aims to minimize resource input and waste output by closing material and energy flow into slow and narrow process loops. To achieve these loops, material processes are optimized and products are designed for longer lifespans, easier maintenance, and the ability to reuse, refurbish, and recycle components at the end of the product’s life. This ensures that products are used as long as possible and at the greatest value.

The circular economy approach will also:

  • Reduce waste products, emissions, and energy leakage
  • Mitigate impacts of production and consumption
  • Increase resource productivity
  • Strengthen economies at all scales
  • Address issues such as resource security and scarcity
  • Create opportunities for industry collaboration and new jobs

This course focused primarily on the construction industry and infrastructure material flows; however, it should be noted that the concept of a circular economy also includes goods, services, raw materials, manufactured products, food, and waste. The buildings we work and live in are material intensive, consuming half of the world’s extracted materials and generating one-third of our global waste. Innovative solutions include collaboration between industries, pre-fabrication of building modules, and high-value recycling. By applying the principles of circular economy in construction, and shifting industry practices, not only is the building’s lifecycle optimized, but the building can be designed for maximum performance in terms of economy, health, global responsibility and resource value.

References:

Orloff, A. (2016). The Built Environment. Metro Vancouver Zero Waste Conference. Vancouver: Metro Vancouver. Retrieved 12 10, 2017, from http://www.zwc.ca/archive/2016/sessions/Pages/built-environment.aspx


The Generation, Composition, and Management of Urban Solid Waste in Beijing

Beijing is the capital of China, and the largest city in northern China. In recent decades, Beijing has progressed rapidly in economic development and urbanization. However, municipal solid waste has become one of the significant environmental problems in the city. This article aims to provide an overview on Beijing’s urban solid waste management with regard to its generation, composition and management.

Generation and trend of municipal solid waste

According to the data published by Beijing Statistics Bureau, it is demonstrated that the amount of disposed solid waste in Beijing increased steadily over the past two decades, from 2,800 thousand tonnes in 1995 to 7,903 thousand tonnes in 2015. A multi-regression analysis shows that GDP is identified to be the strongest explanatory factor for the growth of the total solid waste amount in Beijing, indicating that the environment has been paying the price for the economic growth.

Composition of urban solid waste

From table 1, it is shown that solid waste composition has been found to be relatively stable. Food waste always comprises the highest proportion except in 1990, and its representation has an increasing trend. Plastic, paper and ash also occur in relatively high proportions.

Table 1 Composition (%) of urban solid waste from 1990 to 2003 in Beijing

Municipal solid waste management

There were 22 treatment establishments for solid wastes in Beijing in 2004, and the number has increased to 28 in 2016. Sanitary landfill is the main treatment approach of municipal solid waste, while composting and incineration only make up small proportions. Recent research results indicate that the treatment capacity of the treatment plants proves to be insufficient as the capacity can not satisfy the need of treatment. In addition, the traditional landfill practice produces a large amount of greenhouse gases, and some of the pungent gases are poisonous. In order to mitigate the health risk for the population near the landfill, a proper collection and venting system need to be created.

Discussion

The solid waste management in Beijing has been greatly improved during the past decade. However, problems remain in respect of domestic garbage reduction, resource utilization and industrialization. Future challenges for the local government include the implementation of an effective waste minimization program, systematic urban solid waste management;; and improvement in data availability in monitoring the characteristics of municipal solid waste.

In Detail: The Mosaic Centre

In south Edmonton, you can find Canada’s first net-zero commercial building. The Mosaic Centre is 30,000 square feet and it generates as much energy on site as it consumes in a year. Sustainable practices and technology are showcased in this structure. The project scope has included considerations such as incorporating geo-thermal technology, installing photovoltaic panels and using the framework of Low Impact Development as they marked its place in the public realm. In many ways, this construction project had implemented many of the strategies outlined in this weeks lesson. [Quick Statistics: The Mosaic Centre – Complete in 2015, 10.5 million dollar project, 3 months ahead of schedule and 5% under budget]

Construction Practices – Integrated Design Process.  The design team focused on a collaborative approach to execute this project. This is crucial to sustainable design. Intersecting systems can support and accentuate benefits of the technology, and reduce the likelihood that the systems clash with one another.

Energy Conservation and Energy Efficiency – To make such a large project come in Net-Zero, substantial amounts of work was put into making affordable, and energy efficient features throughout the building. This allows operations to continue within the building using less power. Both passive and mechanical systems are used to naturally light the space. Rather than feeding off the energy grid, this building produces the necessary energy to run on a daily basis. Since supply and demand of energy fluctuates throughout the year, excess energy produced on site is fed back into the utility grid (described as seasonal storage). This method of storage within the grid eliminates the need for battery banks. Those amounts of energy are fed back to the building when supply is low, but demand exists. This exchange between building and grid is incorporated into the net-zero analysis of the building.

Sustainable Power Supply and Renewable Energy Use – The generation of electricity can often time be very disruptive to the surrounding environment, and overall has a net output of carbon emissions. Carbon emissions from industry and commercial practices hugely contribute to these harmful emissions. The south west exterior wall and a portion of the roof have photovoltaic panels mounted for solar energy collection. This form of renewable energy was chosen after investigation of the multiple forms of renewable energy. Wind energy was not ideal, given the location, and thus solar energy became the single type used in this project.

Geo-thermal Heating and Cooling – Within the mechanical room, connections between external boreholes and the internal pipe system exist to make use of the geo-thermal system. The majority of the northern parking area is a geo-thermal field which helps to regulate the buildings temperature. In colder months, use of a high pressure glycol mixture allows access to available heat energy produced through the soil. Conversely, this same system serves to dissipate warm air during the hot months. Overall, the use of geo-thermal energy greatly decreased the number of solar modules needed for on-site electricity production.

Materials and Natural/Eco-Services – Wood was used as the primary building material for the Mosaic Centre. Wood features are presented well aesthetically and are exposed as architectural features to inspire future sustainable projects. Aside from the looks, use of wood sequesters carbon, reducing what would result in carbon emissions. Natural lighting and heat from the direct sunlight are also used to maintain a comfortable and well lit interior. Rainwater is collected on-site in a 25,000 litre storage tank. The water catchment design is not intended to fully cover the water demand, however it does supplement by contributing to the water supply. The main atrium also has a living wall,

Building Envelope –  High performance building design is used to optimize the intersecting systems within the building. A high quality building envelope allows air conditions to remain at the desired temperature. Other strategies, such as targeted shading and the reduction of interior structural loads, are in place to increase occupant comfort.

Education; Precedent Example and Presence in the Community – The structure itself is living proof that sustainable projects can be aesthetically pleasing, economically feasible, and socially conscious. Aims for certification (LEED Platinum and Certified Living Building) and recognition have also increased the visibility and credibility of this remarkable structure. It continues to contribute to environmental efforts while in service by the use of collaborative spaces built right into the structure. These spaces are used to hold and facilitate meetings for integrated teams working on projects with a sustainable focus. Its functionality, and accessibility in terms of transportation also point towards the buildings overall goal; to address sustainability in all design decisions. In analyzing and learning about this project, we can gain wisdom and momentum to initialize and effectively carry out the construction of net-zero commercial buildings.

Sources:
http://themosaiccentre.ca/how-we-did-it/
http://www.greenenergyfutures.ca/episode/first-net-zero-office-building

IDP: The Integrated Design Process

The IDP was first used in the early 1990s, by Canada’s C-2000 program (program supporting advanced, energy-efficient commercial building design) and IDEAS Challenge competition (multi-unit residential buildings challenge) to describe a more holistic approach to building design. In profesional practice, IDP has a significant impact on the makeup and role-playing of the initial design team. The client takes a more active role than usual, the architect becomes a team leader rather than the sole form-giver, and the structural, mechanical and electrical engineers take on active roles at early design stages. The team includes an energy specialist (simulator) and possibly a bio-climatic engineer. Depending on the nature of the project, a series of additional consultants may also join the project team from the outset.

Some of the key advantages of the IDP are cited below:

  • Goal-driven with the primary goal being sustainability, but with explicit subsidiary goals, objectives and targets set as a means to get there.
  • Facilitated by someone whose primary role is not to produce the building design or parts of it, but to be accountable for the process of design.
  • Structured to deal with issues and decisions in the right order, to avoid locking in bad performance by making non-reversible decisions with incomplete input or information.
  • Clear decision-making for a clearly understood methodology for making decisions and resolving critical conflicts.
  • Inclusive—everyone, from the owner to the operator, has something critical to contribute to the design and everyone must be heard.
  • Collaborative so that the architect is not simply the form-giver, but more the leader of a broader team collaboration with additional active roles earlier in the process.
  • Holistic or systemic thinking with the intent of producing something where the whole is greater than the sum of the parts, and which may even be more economic.
  • Whole-building budget setting—allows financial trade-offs, so money is spent where it is most beneficial when a holistic solution is found.

Below is a graphic representation of the IDP Process:

2016-10-17

References:

http://www.nrcan.gc.ca/energy/efficiency/buildings/eenb/integrated-design-process/4047

http://iisbe.org/down/gbc2005/Other_presentations/IDP_overview.pdf

http://www.infrastructure.alberta.ca/content/doctype486/production/leed_pd_appendix_7a.pdf

MEASURES OF SUSTAINIBILITY APPLIED TO THE CIRS BUILDING AT UBC

MEASURE 1: Design & Innovation

CIRS is aimed at being a regenerative building whose existence will improve the quality of the environment. This building contributes to reducing the energy use and carbon emissions. The building sequesters more carbon than the construction and decommissioning of the building will produce overtime.

MEASURE 2: Regional/ Community Design

Roof of the building is designed to be a self sustaining ecosystem where the vegetation includes indigenous plants for local birds and insects.

MEASURE 3: Land use and site ecology

The area of land that CIRS is built on improves the quality of the surrounding environment. It cleans the water it receives, captures heat that would otherwise be emitted to the environment and harbours vegetation that enriches the surrounding ecosystem.

MEASURE 4: Bio-climatic Design

Much of the heating in CIRS comes from the ground and from the heat exhausts from the building next door. Significant amount of the ventilation is from wind and a large part of the electricity is from the sun. This is really a building that survives within the natural flows of the environment.

MEASURE 5: Light and Air

Building is oriented to make optimal use of the daylight received by the site. The higher location of the windows allows for deeper penetration of the daylight into the interior spaces of the building. Solar shades and spandrel panels help control the glare and heat gain from the sun.

MEASURE 6: Water Cycle

All the water used in the building comes from the rain and the water leaving the building is of a better quality than the rain that is received on the roof. CIRS cleans the quality of the water and achieves a net positive in terms of water quality.

MEASURE 7: Energy flows and future energy

Uses geo exchange and solar energy. Uses waste heat from the Earth and Ocean Sciences building next door and captures the energy that would other wise be emitted to the environment.

MEASURE 8: Materials and construction

Wood used for the main structure of the building sequesters 600 tonnes of carbon. This is more carbon than the emissions from all the other construction materials, construction processes and decommissioning and the end of the lifetime of the building.

MEASURE 9: Long life, loose fit

CIRS is designed with ecological, social and economic rationale. Not only does it aim to improve the quality of the environment overtime it also aims to improve the health of its occupant. Flexibility, modularity, adaptability and expandability principles were included in the design of CIRS to ensure that it can adapt to new uses and respond to future space configuration requirements without the need of expensive and wasteful renovations.

MEASURE 10: Collective wisdom and feedback loops

In many ways CIRS is a research project that is intended to identify which processes and techniques work well and which ones have more scope for improvement. Research and observations of the way the building functions and interacts with the environment are ongoing and this knowledge will be used to improve sustainable designs of buildings in the future.

Spam prevention powered by Akismet