A. Revised goal(s) of experiment
After discussing the progress with our TA we decided that our experiment goals were accurate, therefore we won’t make any changes to our primary design goals.
B. Experiment method
i. Participants
As previously practised successfully we will use the “Call for participation” approach. Our pool of potential participants will include UBC students. While we are aiming for the total number of participants to be 12 we are confident that with 10 participants as the lowest threshold the experiment can be concluded. The participants will be combination of female and male between the ages 18- 65. Each member of the group will recruit 2 participants, ideally one female and one male. Other characteristics of our participants will be:
- They should have basic computer literacy. We will divide them into two levels of proficiency with computer applications and measure how comfortable each group are with the design. The distinguishing factor in determining proficiency will be previous experience with similar applications.
- In order to achieve rich data results we will aim to increase the total number of participants if possible. The more participant we recruit the richer our results will be.
ii. Conditions
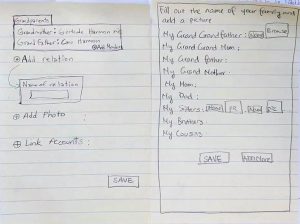
We will compare two types of designs to create a family tree in terms of speed, accuracy and user preference. The participants will go through both design alternatives of a single page by following the completed design of the application two times. Design A will give users the option to create their family tree as they wish. They can use add button to add a new family member and edit them, while Design B will be more focused on filling out the blanks with the information of their family members. The degree of freedom in Design A is more relative to Design B.
iii. Design
The experimental design is a 2 factor mixed design. There will be 2 within-subject independent variables (design A and design B) and 2 between subject variables (self-reported knowledge of family tree interfaces).
iv. Procedure
– Participants will be asked to create a family tree
– Participants will be asked to create and view events
– Participants will be asked questions related to the two different design
– Participants will be asked to fill out questionnaire and interview questions
v. Apparatus
Our main medium to showcase the designs will be a mid fidelity prototyping tool. The experiment will be conducted in Axure, where each of five experiment conductors have equal access to. The official setting will have the following features:
- Quiet with as little distraction as possible.
- Windows 10 environment with prefered resolution 1366×768 (the most common screen size for website design based on https://techcrunch.com/2012/04/11/move-over-1024×768-the-most-popular-screen-resolution-on-the-web-is-now-1366×768/)
- Standard mouse and keyboard
- Time will be measured by windows Alarm and Clock app.
vi. Independent and dependent variables
Independent Variables
For this experiment, we have one within-subject independent variables (design A and design B) and one between subject variables (self-reported knowledge of family tree interfaces). The Design Types are differentiated by groupings with Design A having grouped relations when creating a tree as opposed to Design B which only lists family relations. We also have three dependent variables measured as follows:
Dependent Variables
- Speed : We will measure the speed using standard time from beginning to end (when a tree has been created) of the task being performed by a participant . Observation and timekeeping (stopwatch) will be our prefered method.
- Accuracy : Accuracy will be measured by counting the number of errors the users make in using the designs. Errors will be assessed based on the outcome of the task (i.e. is it the correct tree?) using a common checklist.
- User Satisfaction and Preference : Users will fill up a short questionnaire which measures their subjective opinions on the efficacy of both designs. If necessary, follow-up questions will be asked based on participants’ answers to questionnaires.
vii. Hypotheses
H0: There is no difference in user performance (time and error rate) when entering family history data using either designs A or B
H1: Design B is faster in terms of user performance
H2: Design B is less error prone in terms of user performance
H3: Design B is the user’s prefered design
| Goal of Experiment | Speed | Accuracy | User Satisfaction |
| Design A |
Fast/Slow Relative to B |
Error/No Error | Like/Dislike |
| Design B |
Fast/Slow Relative to A |
Error/No Error | Like/Dislike |
Measuring the goals in the predefined scope:
- Speed : We will measure the speed using standard time in terms of delays in seconds using either of designs. Observation and time-keeping will be our preferred method.
- Accuracy : Accuracy will be measured by counting the number of errors or lapses the users make while using the designs. Also the number of corrections users make afterwards could be indicator of accuracy.
- User Satisfaction and Preference : Users will fill up a short questionnaire which measures their subjective opinions on the efficacy of both designs.
viii. Planned statistical analyses
Based on our hypothesis and variables, we plan to perform a two-way ANOVA. The ANOVA will be used to test for significant interaction between the design type and self-reported ability with respect to speed, error and satisfaction.
viiii. Expected limitations of the planned experiment
Some limitations may occur during the procedure of selecting participants, as the experiment expects the participants to have basic computer literacy; however, as participants are self-judging their computer literacy, their judgement may be different from the expectations of the experiment. Also, some of the visual features of the prototype may not be relatable for participants who have different cultural background where visual display of a family may have different model.
Supplementary experiment materials (Click to Download)
Consent Forms