03/29/17

Blog Update #7: Final Recommendations & Reflection

a. Final conclusions and recommendations

Overall, our initial studies suggest that a family archiving system would be a valuable interface for future use. However, based on the results of our experiment, it is evident that further analysis must be done before continuing on any design changes as the experiment showed no difference between the two alternatives and we are not confident that we can truly accept the null hypothesis. Although Design B appears to be faster (based on mean calculation) and preferred by users, initial calculations also show it is more error prone than Design A. We take this observation with caution since our experiment did not conclude definitively that there was a difference. Due to these initial findings, we believe that our hypothesis might still be supported with a larger participant pool. Additionally, this suggests that a family tree representation we initially thought to be too complicated, might also be a valuable area of study especially when considering participant feedback wherein hierarchy and structure are given importance.
That said, we recommend also focusing the analysis on other aspects of the interface such as the timeline representation for events, which we were not able to do during the course of this experiment. We also feel that changing the appearance and layout design of the interface based on some valuable feedback from the questionnaire to avoid similar errors before performing further analysis.


b. Reflection on your design and evaluation process

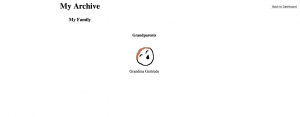
We found that user involvement significantly changed the focus of our interface. Initially, we included lineage in the concept of our application but based on our field study, we felt that it would be beneficial to focus more on sharing and storing archives. Focusing on the representation of the family relations for our design experiment was a direct result of this finding. We felt that to properly support sharing of family archives, we also need to properly represent their relationships.

Interestingly enough, we found no difference between our two design alternatives, which we feel is due to the resource limitation of the experiment (e.g. time, the number of participants.) That said, we were still surprised to find Design B appears to be more error prone than Design A based on initial calculations. However, this might also be due to some appearance and layout issue that participants pointed out during the experiment. Despite these challenges, we feel that using HTML/PHP for our prototype was the best way to create our prototype.

Our evaluation process could have been improved by coming up with more stable metrics to determine what constituted valid user errors. We also could have made more tasks that involved more user decision making to create a much clearer distinction between the two interfaces. Perhaps it would be a good idea to see if maybe users would prefer to do their own graphical representation of family relations on just be able to link specific nodes of their representation to other users to which they are related. There is a lot of ground to cover in this largely untapped section of social media.

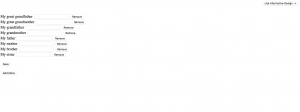
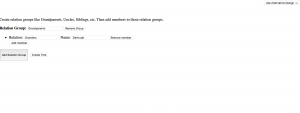
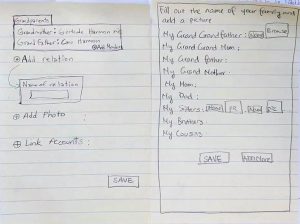
Our design was pretty simplistic, though that was mostly due to a skill deficit than anything else. The idea itself is nice in theory (i.e. give users the flexibility to define their own relations and relational groups such as grandma and grandparent respectively), but the execution proved to be much more difficult with all its moving parts and laborious data entry. Keep in mind that a lot of archiving is fairly laborious so it would be good to have some sort of minimization on the task of data entry. Our design gave some defaults to prompt users to think about certain relations and how they might fit family members into those customizable constructs, but it largely relied on the cognitive ability of a user to remember all their family ties. Maybe it would have been better to streamline it by making a user take a survey that clearly lays out to what extent they know their family and then only prompts them to enter data about members they know they have and edit them later if necessary.

Overall there were some failings in the design that we notice now, but the design served the purpose it needed to which was to get closer to a good consensus on how users like to represent their families.

03/27/17

Update #6: Experiment Abstract and materials

The pilot test showed that users could finish the experiment tasks correctly. However, there were still a couple issues:

  • There are some bugs in our interface such as some buttons were not working. Corrections were made to be sure they worked in our formal experiments.
  •  Some of the instructions in our protocol were not clear. When we created the instructions for the two alternative tests, we decided to state it more specifically (i.e. instead of ‘create a tree’, we can have ‘add your grandpa, add your grandma, add your …’).
  • The questionnaire had some duplicate questions, we deleted some of the questions that were not clear.

The pilot test gave us some idea of the real experiment would look like. Our users took 15 minutes to do the pilot test on average and this is also what we expected the real experiment average would be.

Number of participants : 2 , One female, One male

The following criteria should pass in order for the pilot to be marked as success :

Task Expected Outcome
Create a family tree with both designs
OK
Add family members OK
View the tree OK
View a member’s profile OK
Time Two time range for two designs – expected result is the Design B takes less time to complete – OK
Errors Two values for number of errors per design – OK


Experiment Abstract 

The experiment was conducted with number of participants N = 8. Each participant was asked to systematically go through each design to create a family tree. The instruction for the task was precise to the name of each family members intentionally to reduce the possible noises that could arise from user errors and time factor that they may take to remember the family members. For each participants the following data was measured :

  1. Time to complete the task using design A
  2. Time to complete the task using design B
  3. The number of encountered errors using design A and design B
Participant ID Design Type Time Error
1 A 9 0
1 B 8 1
2 A 7.5 0
2 B 6.5 0
3 A 3.9 0
3 B 3.6 1
4 A 3.5 1
4 B 5 2
5 A 10.47 0
5 B 6 2
6 A 3.5 0
6 B 5.6 1
7 A 9 1
7 B 6 0
8 A 15 2
8 B 9 0
9 A 5.1 0
9 B 8.5 0
10 A 3.1 0
10 B 4.5 0


The data then were combined in a table to be analyzed in R. Based on our findings the total number of errors made using each design was as following:

Design A Errors: 4

Design B Errors:7

Which indicated the design B was more error prone.

However the total mean time for design A was less, which indicated that the time required to complete the task with design B is less than design A.

Mean Completion time Design A : 7.007

Mean Completion time Design B : 6.270


ProcedureForTheParticipants

Questionnaire

CodingSheetforObservationandTimeKeeping

HCIMSIVConsent.doc

03/7/17

Blog Update #5 – Medium Fidelity Prototyping

A. Rationale of prototyping approach 

i.

The prototype has pretty bare minimum functionality horizontally, so our scope is vertical on the ‘My Family’ portion of the interface. It allows the user to create a family tree based on their relations. We are choosing this vertical scope because we want to determine which interface users find easier and more preferable when building their family tree.

ii.

The simulated functionality:

– create a family tree, the user should be able to add family members onto the tree, and view the tree.

– create a event, and add people involved, date, photos and stories on to it.

– the ability to view a person’s profile by clicking on his/her icon

– users should be able to view events that are organized in a timeline.

– users should be able to share their creations to other media websites (e.g. Facebook, twitter, etc)

Many of the functionalities would be hard to implement for now, thus wizard-of-ozd is necessary. Functionality like organized event in a timeline is one of the ‘impossible to implement’ by using Axure. Thus we will have the timeline ready for the users, instead of the application generate.

We do not have real data for our testing, all family members that are on the tree and other information will be fake data. However, when the users start using the system, they may enter their real family members’ information.

iii.

Based on our experimental goals and the stage of the study, we decided to focus more on functionality as opposed to appearance. Additionally, since we are measuring user satisfaction in a post questionnaire, we felt that participants would be more open to criticize the design if the prototype does not appear complete.

iv.

We do not have any physical elements in our interface.

v.

We decided to use HTML/PHP.

Here is the link to our prototype: http://www.ugrad.cs.ubc.ca/~l1c0b/444/index.php

B. Prototype illustration

Figure 1. The home screen requires the users to either log in or sign-up. The tutorial video is present on the home page for beginning users. Video is an effective medium to let users quickly explore the application and learn the basic features.

Figure 2. The sign-up procedure requires the user to enter an E-mail, Username and password. Avoiding modern SNS applications from the requirements keeps easy accessibility for the less computer literate users.

Figure 3. The login screen requires Username and password.

Figure 4. The dashboard screen has three main features of the application. The wording of the name may not effectively describe its feature; therefore, images are another feature to prevent from misleading the users.

Figure 5, 6. My Family screen has the two designs that will be used for the experiment. Adding a button to alternate between the designs may need to be observed cautiously as it may affect the users if used beforehand. However, it is easy to compare the two.

Figure 7. The result of adding a member to a family.

03/7/17

Blog Update #4 – Experiment Design

A. Revised goal(s) of experiment

After discussing the progress with our TA we decided that our experiment goals were accurate, therefore we won’t make any changes to our primary design goals.

B. Experiment method

i. Participants

As previously practised successfully we will use the “Call for participation” approach. Our pool of potential participants will include UBC students. While we are aiming for the total number of participants to be 12 we are confident that with 10 participants as the lowest threshold the experiment can be concluded. The participants will be combination of female and male between the ages 18- 65. Each member of the group will recruit 2 participants, ideally one female and one male. Other characteristics of our participants will be:

  • They should have basic computer literacy. We will divide them into two levels of proficiency with computer applications and measure how comfortable each group are with the design. The distinguishing factor in determining proficiency will be previous experience with similar applications.
  • In order to achieve rich data results we will aim to increase the total number of participants if possible. The more participant we recruit the richer our results will be.

ii. Conditions

We will compare two types of designs to create a family tree in terms of speed, accuracy and user preference. The participants will go through both design alternatives of a single page by following the completed design of the application two times. Design A will give users the option to create their family tree as they wish. They can use add button to add a new family member and edit them, while Design B will be more focused on filling out the blanks with the information of their family members. The degree of freedom in Design A is more relative to Design B.

iii. Design

The experimental design is a 2 factor mixed design. There will be 2 within-subject independent variables (design A and design B) and 2 between subject variables (self-reported knowledge of family tree interfaces).

iv. Procedure

– Participants will be asked to create a family tree

– Participants will be asked to create and view events

– Participants will be asked questions related to the two different design

– Participants will be asked to fill out questionnaire and interview questions

v. Apparatus

Our main medium to showcase the designs will be a mid fidelity prototyping tool. The experiment will be conducted in Axure, where each of five experiment conductors have equal access to. The official setting will have the following features:

vi. Independent and dependent variables

Independent Variables

For this experiment, we have one within-subject independent variables (design A and design B) and one between subject variables (self-reported knowledge of family tree interfaces). The Design Types are differentiated by groupings with Design A having grouped relations when creating a tree as opposed to Design B which only lists family relations. We also have three dependent variables measured as follows:

Dependent Variables

  1. Speed : We will measure the speed using standard time from beginning to end (when a tree has been created) of the task being performed by a participant . Observation and timekeeping (stopwatch) will be our prefered method.
  2. Accuracy : Accuracy will be measured by counting the number of errors the users make in using the designs. Errors will be assessed based on the outcome of the task (i.e. is it the correct tree?) using a common checklist.
  3. User Satisfaction and Preference : Users will fill up a short questionnaire which measures their subjective opinions on the efficacy of both designs. If necessary, follow-up questions will be asked based on participants’ answers to questionnaires.

vii. Hypotheses

H0: There is no difference in user performance (time and error rate) when entering family history data using either designs A or B  

H1: Design B is faster in terms of user performance

H2: Design B is less error prone in terms of user performance

H3: Design B is the user’s prefered design


Goal of Experiment Speed Accuracy User Satisfaction
Design A

Fast/Slow

Relative to B

Error/No Error Like/Dislike
Design B

Fast/Slow

Relative to A

Error/No Error Like/Dislike

Measuring the goals in the predefined scope:

  1. Speed : We will measure the speed using standard time in terms of delays in seconds using either of designs. Observation and time-keeping will be our preferred method.
  2. Accuracy : Accuracy will be measured by counting the number of errors or lapses the users make while using the designs. Also the number of corrections users make afterwards could be indicator of accuracy.
  3. User Satisfaction and Preference : Users will fill up a short questionnaire which measures their subjective opinions on the efficacy of both designs.

viii. Planned statistical analyses

Based on our hypothesis and variables, we plan to perform a two-way ANOVA. The ANOVA will be used to test for significant interaction between the design type and self-reported ability with respect to speed, error and satisfaction.

viiii. Expected limitations of the planned experiment

Some limitations may occur during the procedure of selecting participants, as the experiment expects the participants to have basic computer literacy; however, as participants are self-judging their computer literacy, their judgement may be different from the expectations of the experiment. Also, some of the visual features of the prototype may not be relatable for participants who have different cultural background where visual display of a family may have different model.

Supplementary experiment materials (Click to Download)

Consent Forms

Questionnaire

CodingSheet