In the Guardian U.K.’s environmental blog, John Vidal, argues that Africa is the continent “must vulnerable to climate change.” November 21st, 2011, Vidal posted about the relationship between civil war and climate change in Sudan, arguing that combination of issues may escalate issues the country is facing.
Below are data visualizations that we feel would contribute to reader engagement and understanding of Vidal’s article.
To provide the reader with the more context on conflict in Sudan we mapped all of the conflicts that have occurred there in the last ten years.
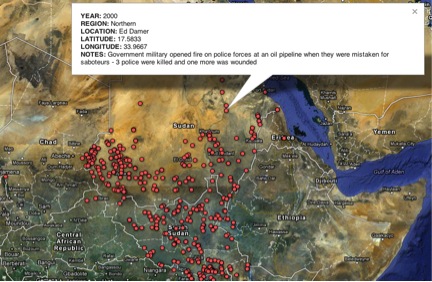
This map shows the concentration of conflicts allowing insights into which regions are potentially more susceptible to be affected by both conflict and climate change. It is important to note that data used is from when Sudan and South Sudan were one country.
The map adds context to the story by pinpointing the incidents of conflict by region and specific location (longitude and latitude). Additional context about the nature of the conflict, injuries and battle deaths (part of the Armed Conflict and Location Event Data set) is available by clicking on the pin point. This information adds to Vidal’s story by adding data to dispute the UN’s assertion that it was primarily climate change and environmental degradation that led to the more than 200,000 Sudanese deaths
To show the relationship between conflict and the environment we wanted to investigate the correlation between internally displaced people and cereal yield.
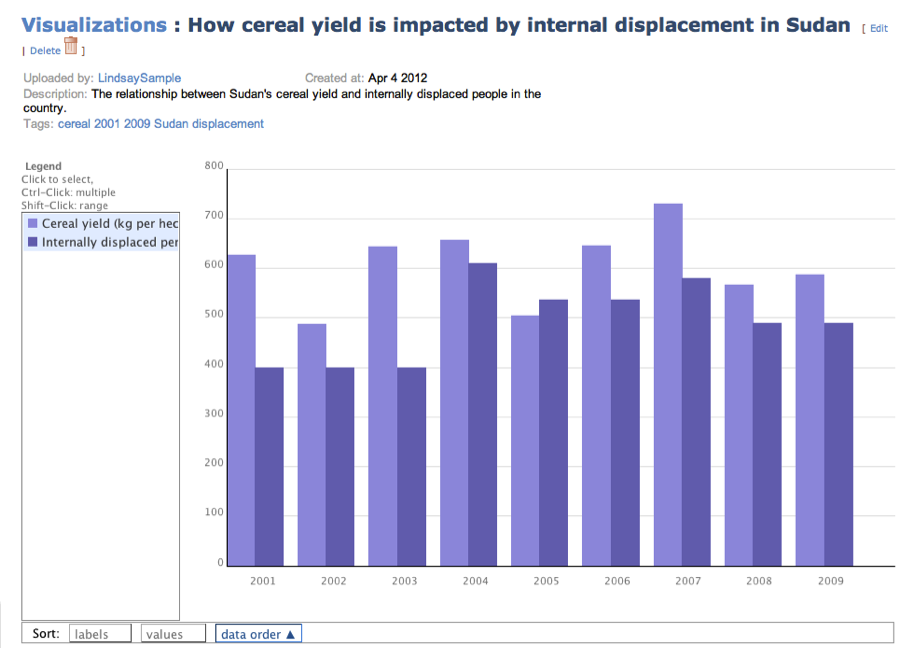
Generally,this graph comparison shows that as internal displacement increases cereal yield decrease. We would have preferred to see the relationship between internal displacement and decertification, however, within our research we were unable to find any specific data on decertification in Sudan. The cereal yield was chosen as a substitute because yields are impacted by issues surrounding climate change such as changing rainfall patters.
Lastly, we have graphed the urban and rural access to improved water sources.

The rate of access to improved water sources is has decreased by 21 per cent over an 18 year period. Though more drastic in the urban environment, this visualization shows that the water access is decreasing in both rural and urban settings. Water access could be impacted by both climate change and conflict. Though it is hard to conclude how either one, or both, are impacting this data, it clear that Sudan’s population – especially in urban centres – is facing the consequences of a water crisis.