Discussion for At-risk Population
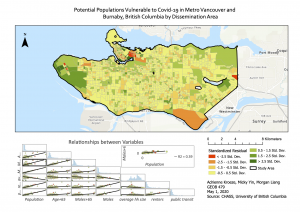
It can be seen in the GWR results that the most at-risk areas are in Downtown Vancouver, specifically Gastown, Chinatown, and Strathcona. Other areas that have higher risk demographics are the furthest south area in Burnaby, Lougheed, West Point Grey, and areas within the University of British Columbia.
While each variable is a potential vulnerability that highlights certain areas of which people may want to be wary of if they are a part of such demographics, the GWR provides a closer look at the culmination of all such variables. Based on these results, it can be expected that people within these areas have a higher risk of contracting this virus, and further support should be put in these areas. While one cannot change their attributes such as age or immediate ability to afford their own private transportation, it provides an additional awareness that may encourage people to take self-isolation seriously and keep themselves from potential exposure. Additional medical assistance and services would be beneficial in these areas as well in order to help the ones who are most vulnerable.
Constraints noticed;
When looking at at-risk demographics, there are certain limitations that must be considered. As it is very difficult to find health record data, there is an absence of one of the most vulnerable groups of people. The reason behind males being more at risk of contracting the virus must also be considered; we do not know if it is due to genetics, certain activities that put them at higher risk, or if they are simply tested more often than women- making it only seem that they contract the virus at a higher rate. Single-person households were not considered high risk as there is a smaller chance of the individual passing the disease on to other family members, even though they may be at higher mortality risk if they do catch the disease and have no one to help them.
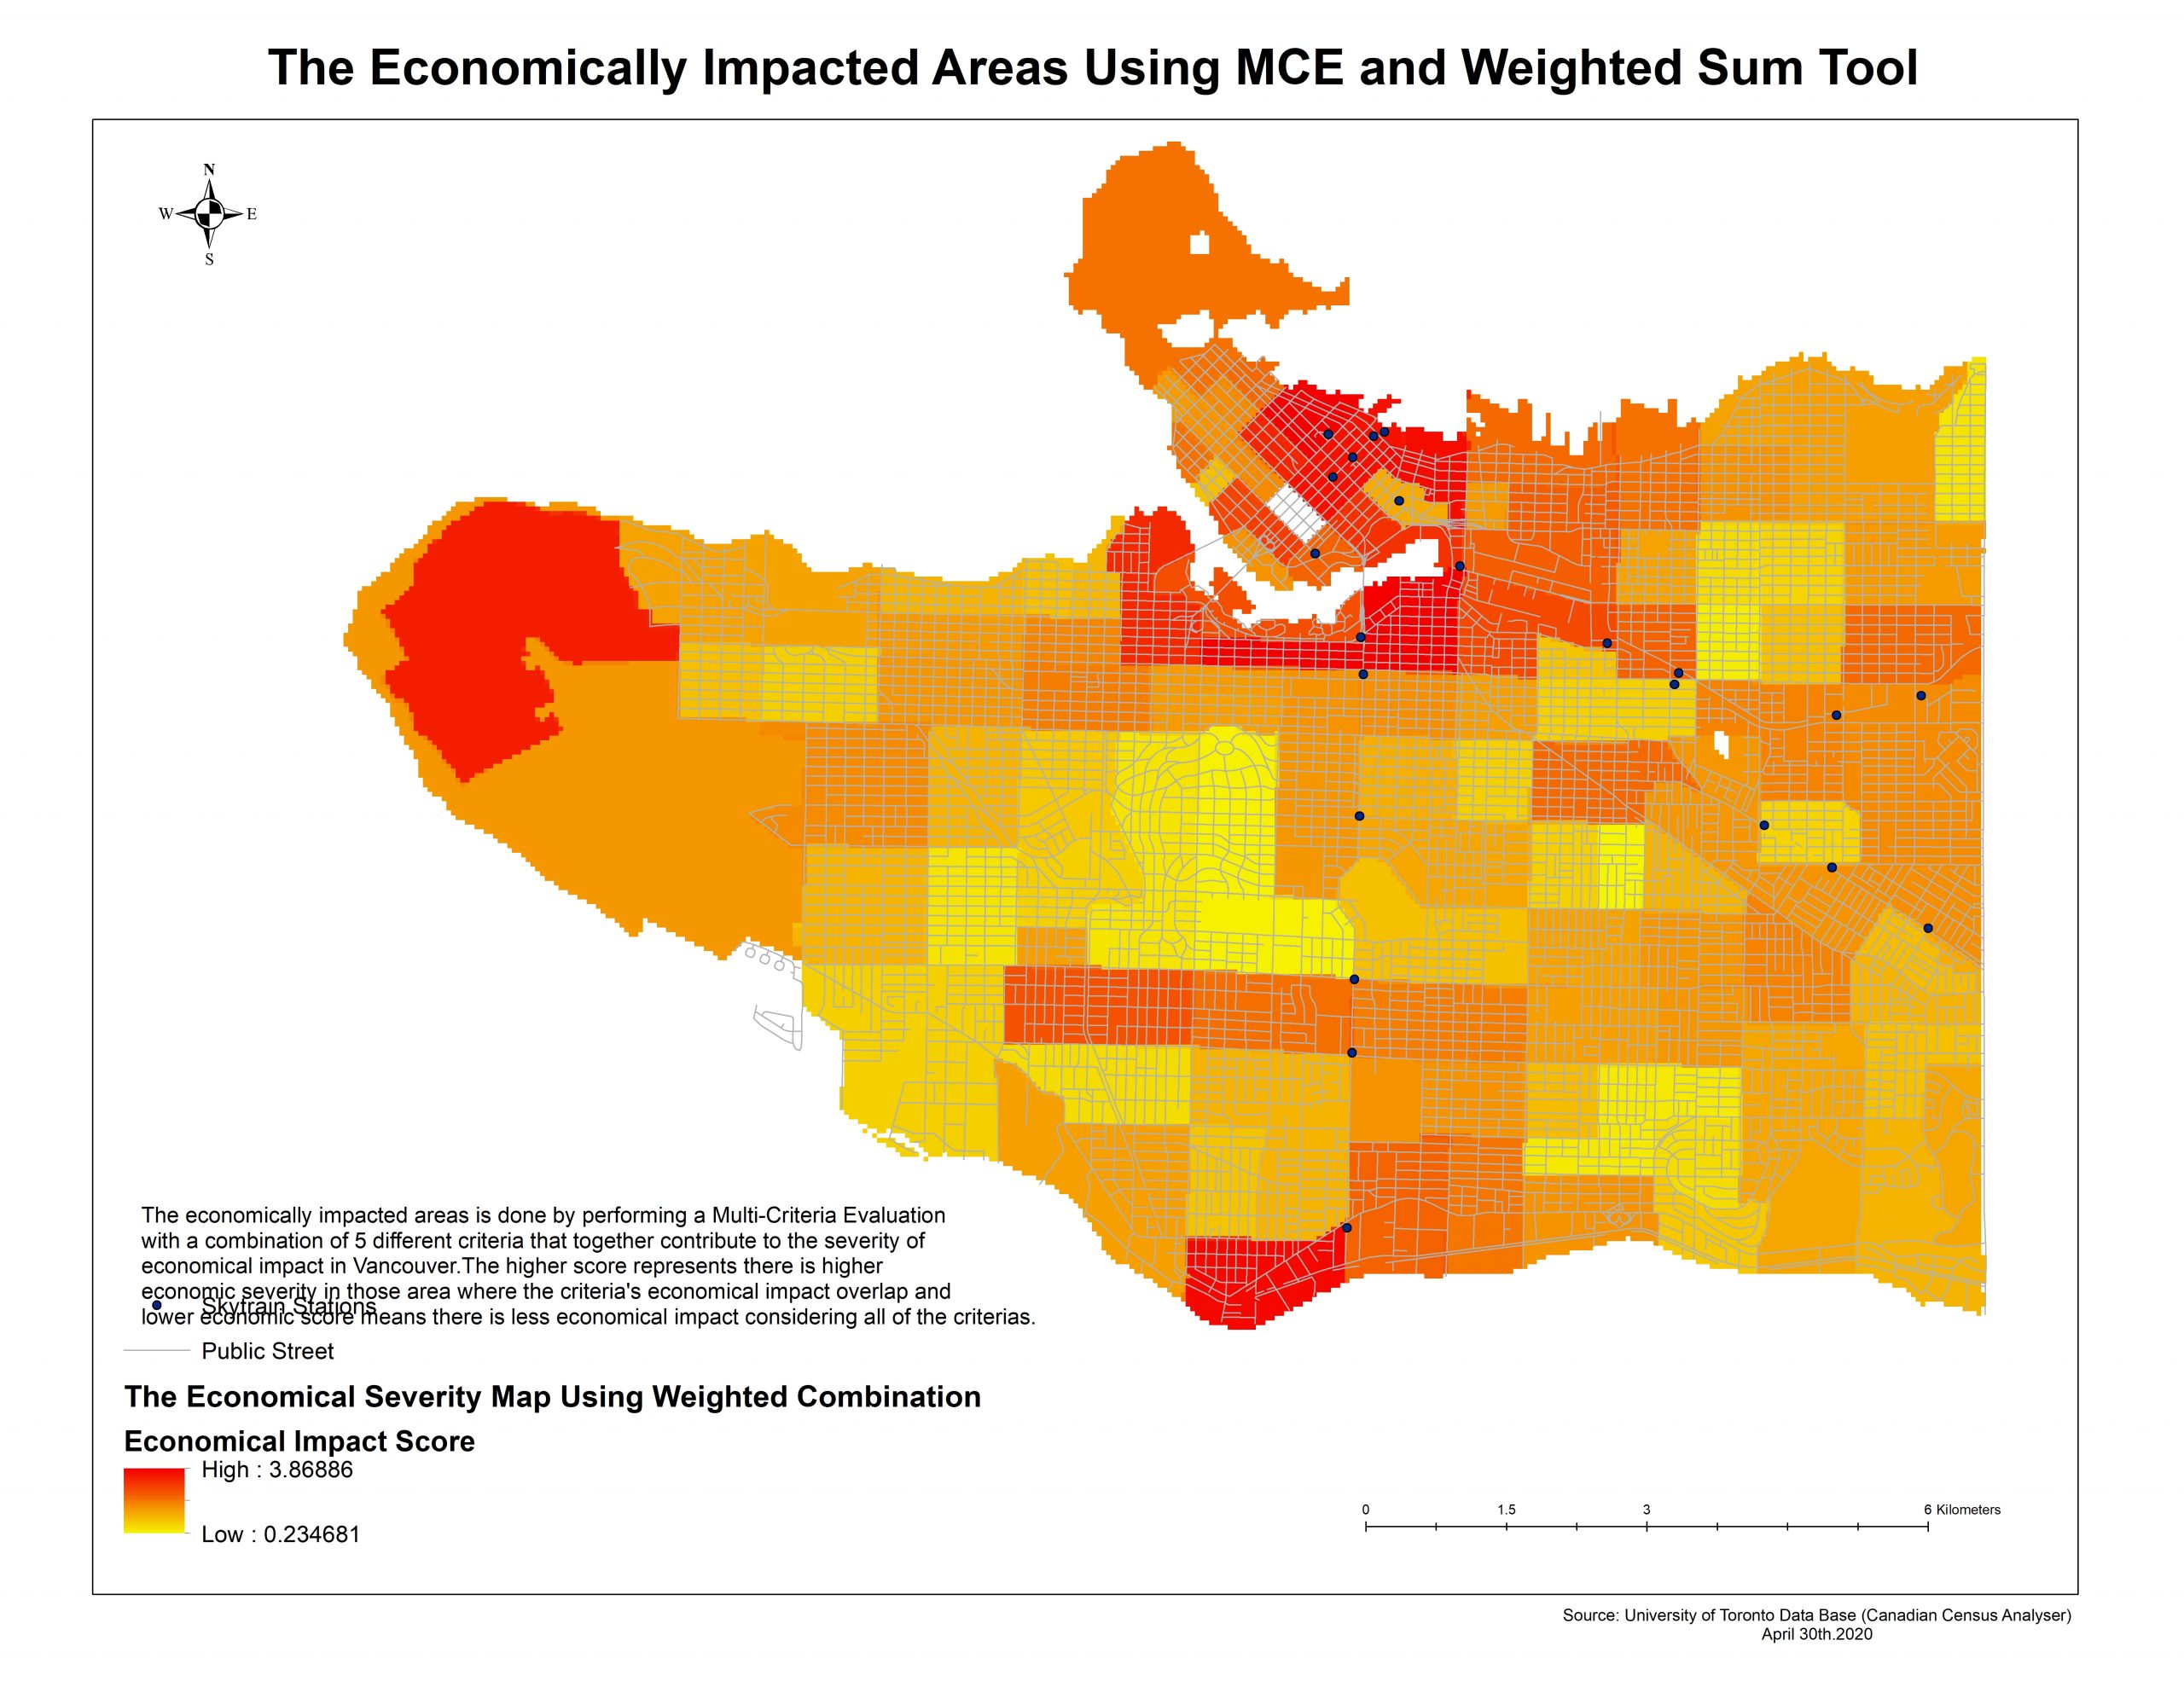
Economic Severity Mapping:
We notice areas in Downtown, Vancouver City Hall, and Southwest Marine Drive show the highest economic severity judging by the extent of people that fit our criteria to be vulnerable populations. While it is the least severe in Vandusen Botanical Garden and around the neighborhood.
The Discussion for multi-criteria evaluation and mapping economic severity across Vancouver
While we notice from figure 1 is that the heaviest toll or severity is located in the area of Downtown Vancouver, Broadway and Granville Streets, and the University of British Columbia. We have to take into consideration is that the severity of the economic impact is very reliant on the number of people affected, and those people that are categorized as low income, or need to spent 30% income toward shelter are vulnerable to economic impacts. A larger number of those populations in the area will signal a higher overall economic severity which I believe our results gave good insights about. The reason is from our data section, if we look at where the industrial area and commercial area is located, we notice a large number of land is located within downtown and broadway. Therefore, there will be more business at that location that will likely contribute to a higher economic impact in those areas. What we did notice is that despite there is commercial land and industrial land in parts of downtown but that does not mean there will be the highest economic impact in those areas unless we take into consideration of occupations and vulnerable populations. We mapped out the distribution of occupations across Vancouver, and we notice while the majority of the occupation dwell in downtown and broadway areas and Granville. There are a few exceptions for Trades, transport and equipment operators and related occupations and sales and service occupation where there is a high density of people living in the east side. We took into consideration that different occupation is affected at different scales, therefore, we had to weight each occupation differently to highlight those areas where lots of people are likely to be affected. The arts, culture, recreation, and sports occupation faced the heaviest unemployment rate for the past 3 months with an additional 1969 people having to be laid off or facing unemployment due to lockdown procedure. It is reasonable because the city of Vancouver had banned all non-essential programs during early march while sales occupation still maintained their business using online marketing. We notice arts occupation is very concentrated in downtown in data section because it is where Rogers Arena and Vancouver Art Gallery are located at. There are many productions, recreational activities that are more likely to take place downtown because there is a higher concentration of people at usual. Up to this point, it seems reasonable, that downtown will be facing higher economic severity, but we did notice a commonality between all occupations is that there is the least number of people working in the areas at VanDusen Botanical Garden and from Cambie & 41st to Cambie & 33st until Granville St area which is the middle of our figure 1. We know that VanDusen Botanical Graden is not a residential zone therefore it is reasonable that there aren’t any occupations or commercial areas that will enhance the economic severity. If we look at vulnerable populations, we will notice vulnerable population is denser with a higher number of people at downtown, which is reasonable because downtown has higher than average rent and more people need to spend more than 30% income toward rent. While low-income is apparent in areas of the University of British Columbia that will enhance the economic severity at university. I find it surprising that Kerrisdale showed higher economic severity because there is more primary maintainer over age 65 at those locations, and more predominately, west king Edward & Mackenize street show a large number of a vulnerable population. There must be some sort of social pattern around those areas, but overall it will enhance the economic severity which will likely have an influence on these regions.
figure 1) The results of MCE for mapping the severity of economically impacted areas.
The Limitation for multi-criteria evaluation and mapping economic severity across Vancouver
I have to say that our limitation will be data finding because there are still factors and criteria that we would have considered but do not have access to, which is, for example, the distribution of people that are currently receiving emergency benefits, or locations where business have filed bankruptcy. These locations will give us more in-depth information about which areas is currently seeing the hardest economic impact.
Location Quotient Analysis
Industry Distressed Map shows downtown, south Kitsilano, Mt Pleasant, east Vancouver are high-risk areas where concentrate economically distressed industries more. Information, culture, and recreation industry is the riskiest industry by the hit of COV-19. Because of social distancing, many public institutions are required to close, like museums, zoos, and theatre. Also, big evens are not allowed to hold, like concerts or sports games. Based on the Work BC, workers in this industry tend to be younger than other industries and temporary employment is common. Younger worker implies the low requirement of jobs and temporary employment also means they are more likely to be fired than contract workers and permanent workers if companies meet a financial shortage during COV-19 pandemic. Thus, these two factors caused a higher unemployment rate than other industries. Thus, this industry weights 22.1% for Industry Distressed Map, and information, culture and recreation industry also mainly locates in areas where are high risk of Industry Distressed Map. During COV-19, utility and agriculture increased employment rate of 25% and 13.7% respectively. Based on the Work BC., there is no self-employment in the utility industry. There is a small workforce in BC, thus the human element is less than other industries. The possible reason is because of the public are required to stay at home, there is a large demand of utility so that this industry lowering their job requirement to recruit more people in order to deal with precipitate workloads.
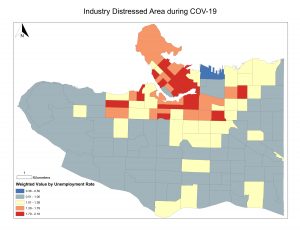
The limitation of Location Quotient Analysis of Industry is the unemployment rate is from March 2019 to March 2020. To specify the impact of COV-19, the unemployment rate of the start date and end date of COV-19 will be more accurate to calculate its impact. Based on this analysis, the government can consider regional support programs for workers in high-risk areas and also pay more attention to the condition of younger and temporary workers in information, culture, and recreation industry.