Results from the Demographic Analysis: Please click to see higher resolution of images
Potential Vulnerable Populations to Covid-19 in Metro Vancouver and Burnaby, British Columbia by Census Tract
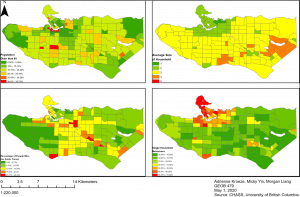
Potential Vulnerable Populations to Covid-19 in Metro Vancouver and Burnaby, British Columbia by Dissemination Area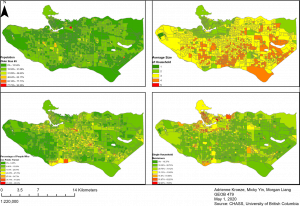
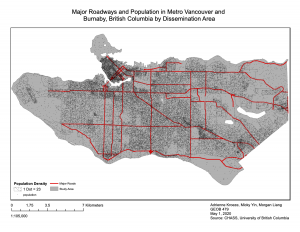
These maps provide a look at the raw data counts for the census data characterized by both census tract and dissemination area scale. Dissemination areas allow for a closer look at how data is broken down, and prevents the modifiable unit area problem. Within these results, it can be seen that there is consistent high percentages of each of these single variables within similar areas, for example Southwest Marine Drive region. However, it is interesting to compare it to the GWR results, as this map suggests that this area is not at the most risk in comparison to others. It can also be seen that higher concentration of people are situated around major streets, as these areas have larger and more diverse types of people within these boundaries. Areas with high dissemination areas of people over the age of 65 tend to be concentrated in certain areas, rather than spread consistently, suggesting that these are areas with retirement homes and other senior oriented spaces.
While each variable is a potential vulnerability which highlights certain areas of which people may want to be wary of if they are apart of such demographic, the GWR below provides a closer look at the culmination of all such variables.
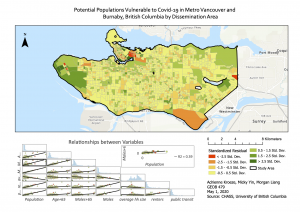
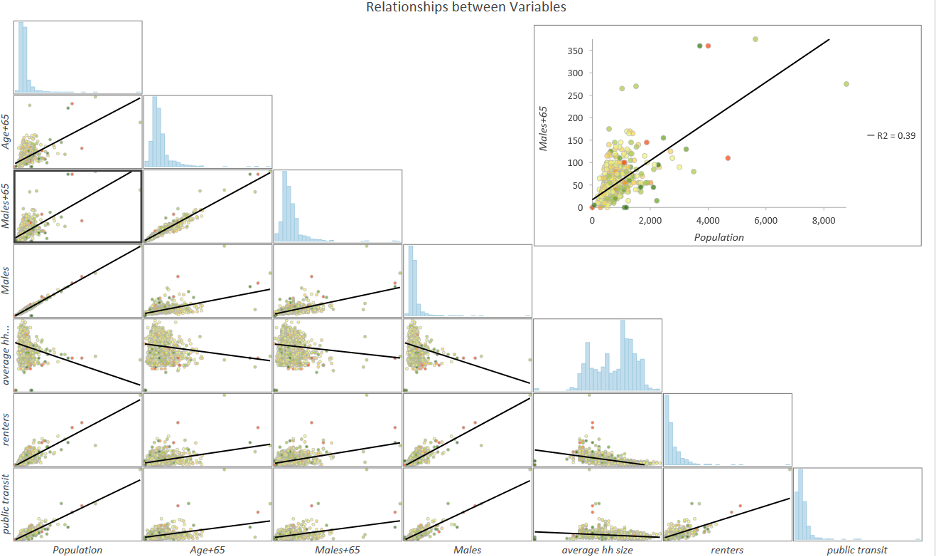
Figure 1. On the vertical axis, the labels are as follows; Public transit, Renters, Average household sizes, Males, Males over the age of 65, and Individuals over the age of 65. The horizontal axis labels are as follows; Population, Individuals over the age of 65, Males over 65, Males, Average household size, Renters, and Public transit.
This figure represents the results from the geographically weighted regression, showing the relationships between the variables. Due to the nature of the program, there were issues with labelling showing up. There appears to be a neutral to positive trend for most of the relationships. The GWR has the R2 value of 0.9916 and adjR2 value of 0.9908, which suggests that the model makes up for almost all of the variation found within the study area’s model.
Model Diagnostics of GWR:
| R2: |
0.9916 |
| AdjR2 | 0.9908
|
| AICc: | 13814.5010
|
| Sigma-Squared: | 1732.7399
|
| Sigma-Squared MLE: | 1581.0477
|
| Effective Degrees of Freedom: | 1218.1278
|
Each point within the chart represents a dissemination area and assigned a value based on how much the attribute varies from the mean. For example, one dissemination area with the ID 59154001 shows how this weighted regression is extremely useful when combining all vulnerable variables on the population. In this dissemination area, it often remains above the average trend line for each comparison, appearing to be high-risk for Covid-19 as many people living within this area have living conditions that mark them as more in danger to the disease. Other areas above the trend line also include areas such as DAUID area 59150938, 59153381, and 59153582.
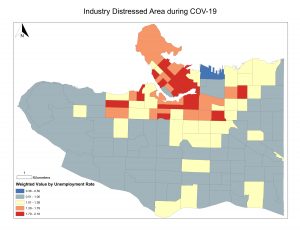
Mapping Economically Impacted Areas and Their Severity From Highest To Lowest:
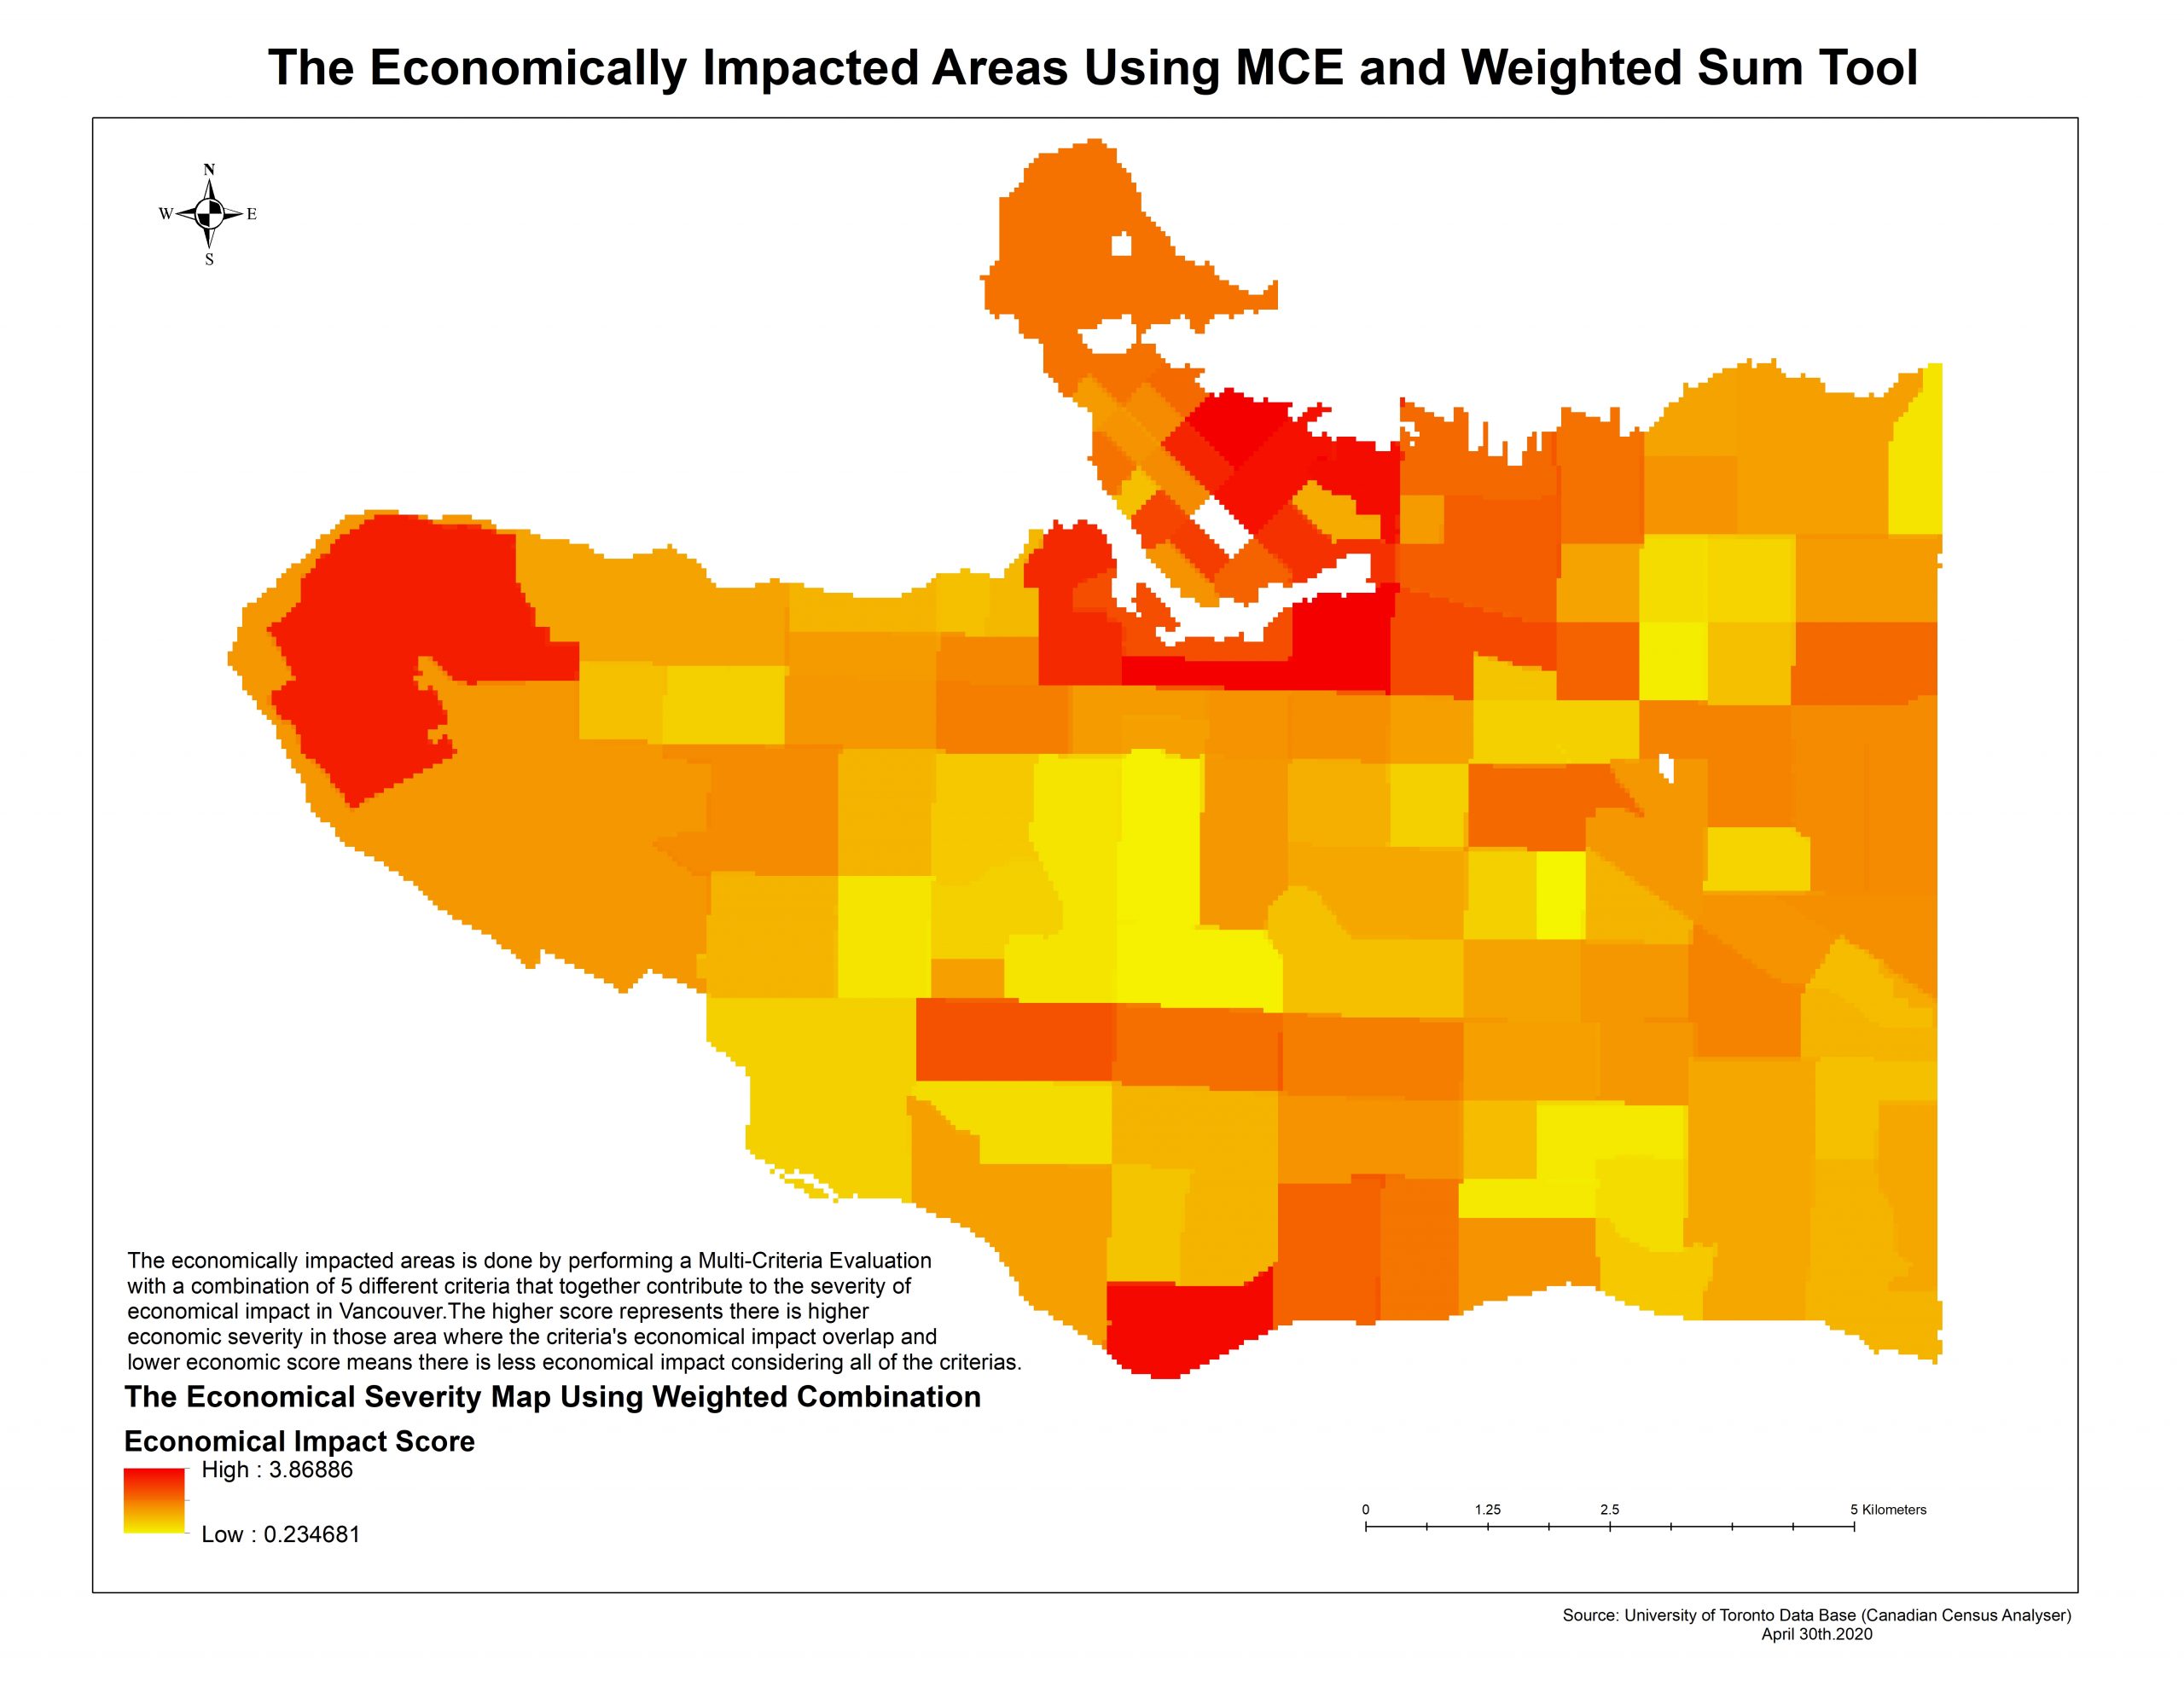
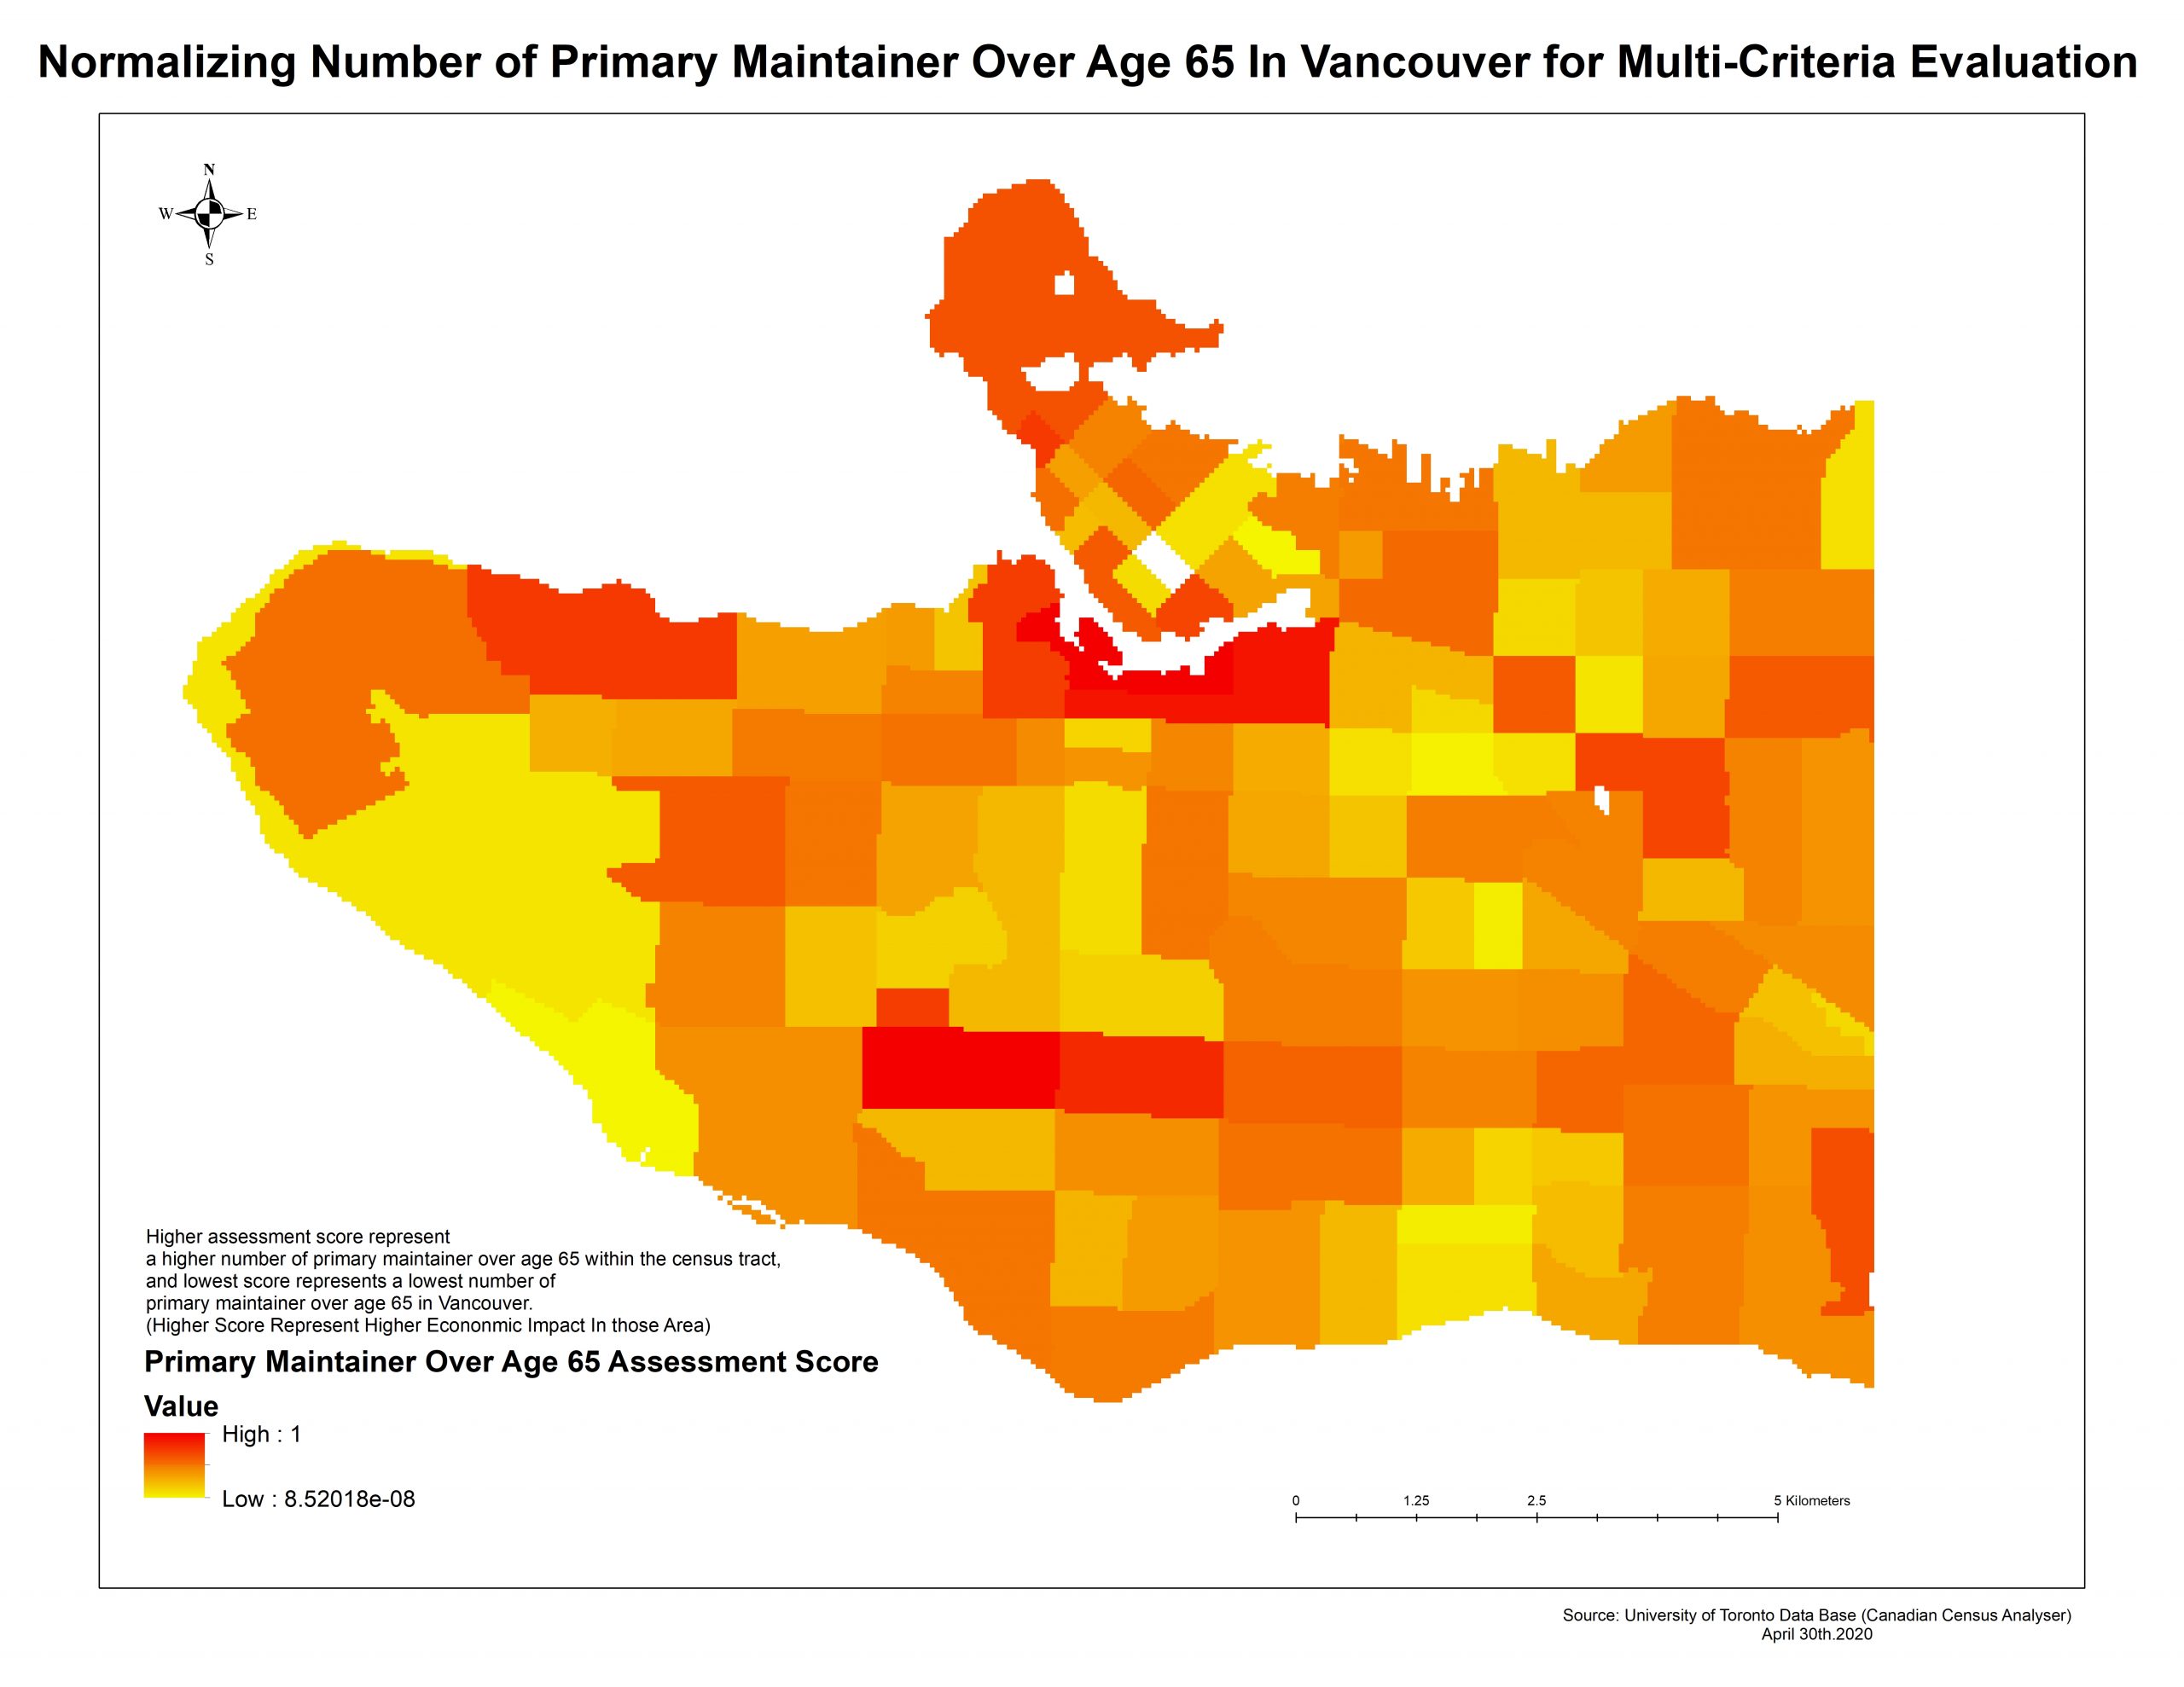
Explanation: The higher economic impact score means those locations have the highest contribution of economic impact from looking at 5 different criteria, Industrial and Commercial Land, population paying 30% income or over to rent, low-income families, occupations, and private household primary maintainer over age 65. The weighted combination tool tells us the sum of economic severity and provides information about which locations show the highest economic impacts.
The 5 different criteria used to produce the MCE map, and their corresponding economic severity:
Criteria 1) The Industrial and Commercial Land Economic Severity using a stretched color ramp, and land use classification overlay on top.
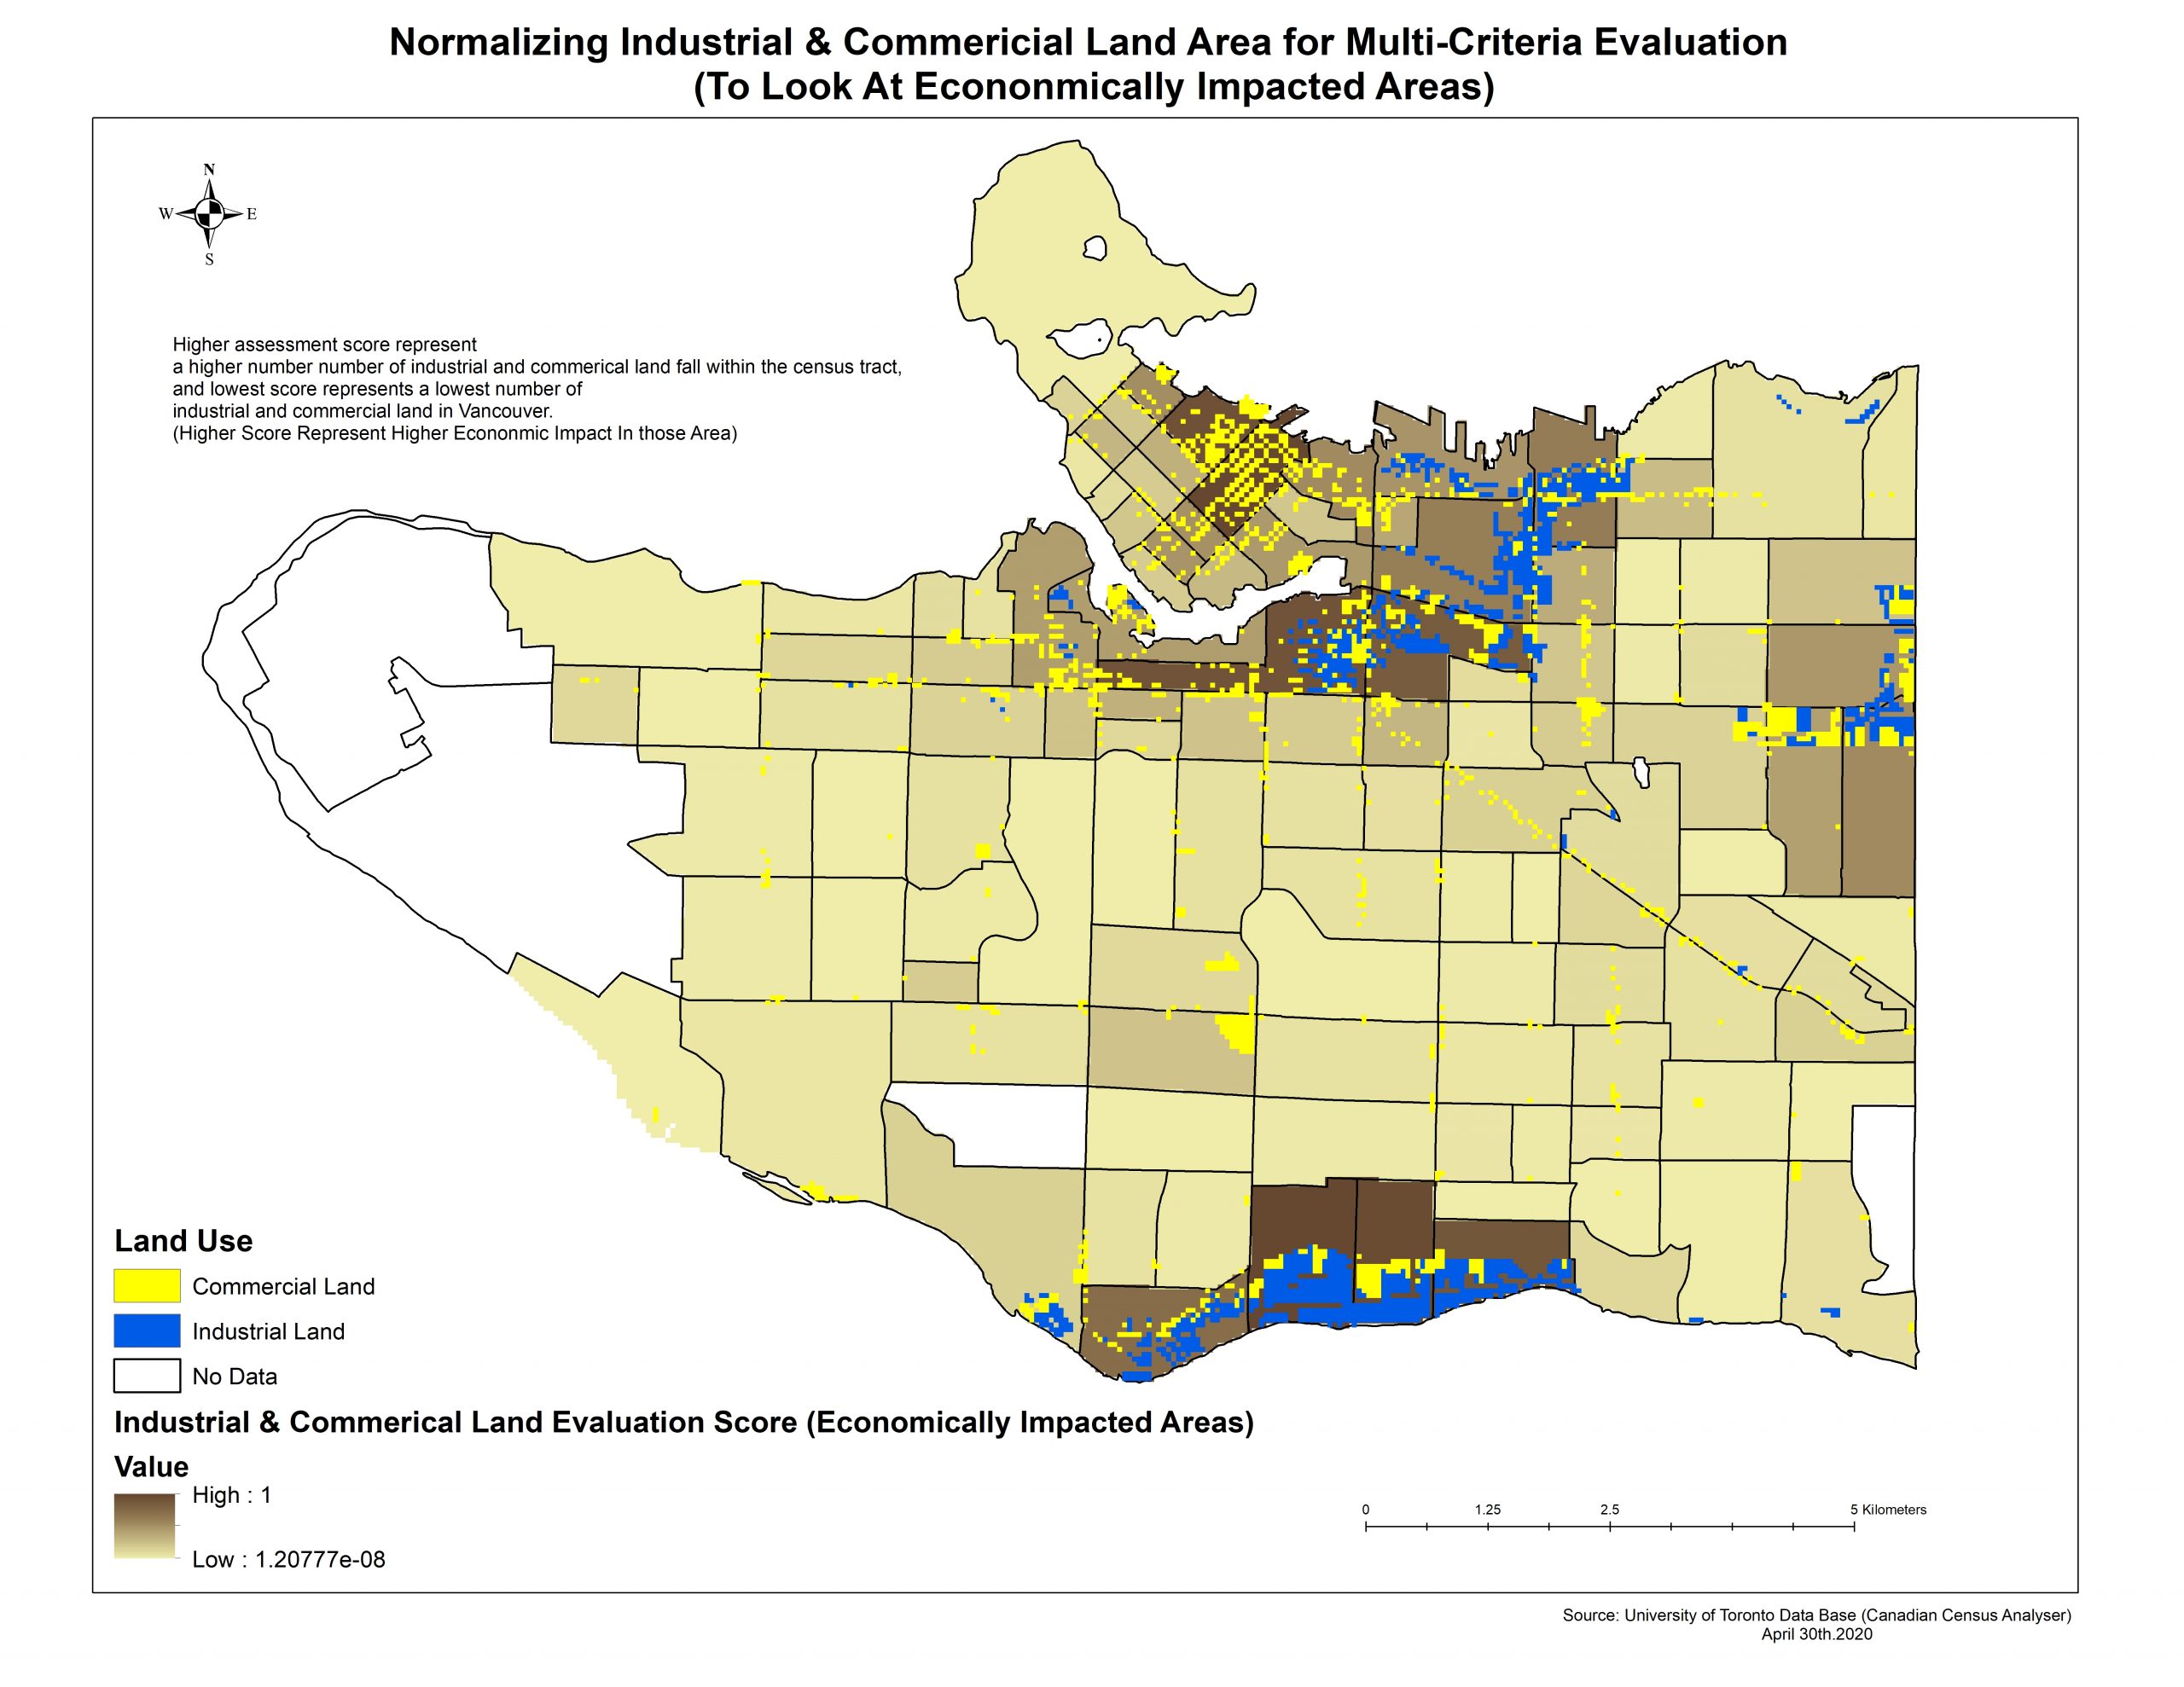
Explanation: Since Industrial and Commercial Land is very concentrated in Broadway Road, and Downtown Vancouver. It is expected these areas will contribute to higher economic severity, and we normalized those census tract regions by calculating the % areas of Industrial and Commercial Land.
Criteria 2) The economically impacted occupation is based on 8 sub-criteria in different occupations and weighted differently based on unemployment rate change that will result in the largest number being unemployed during this time. 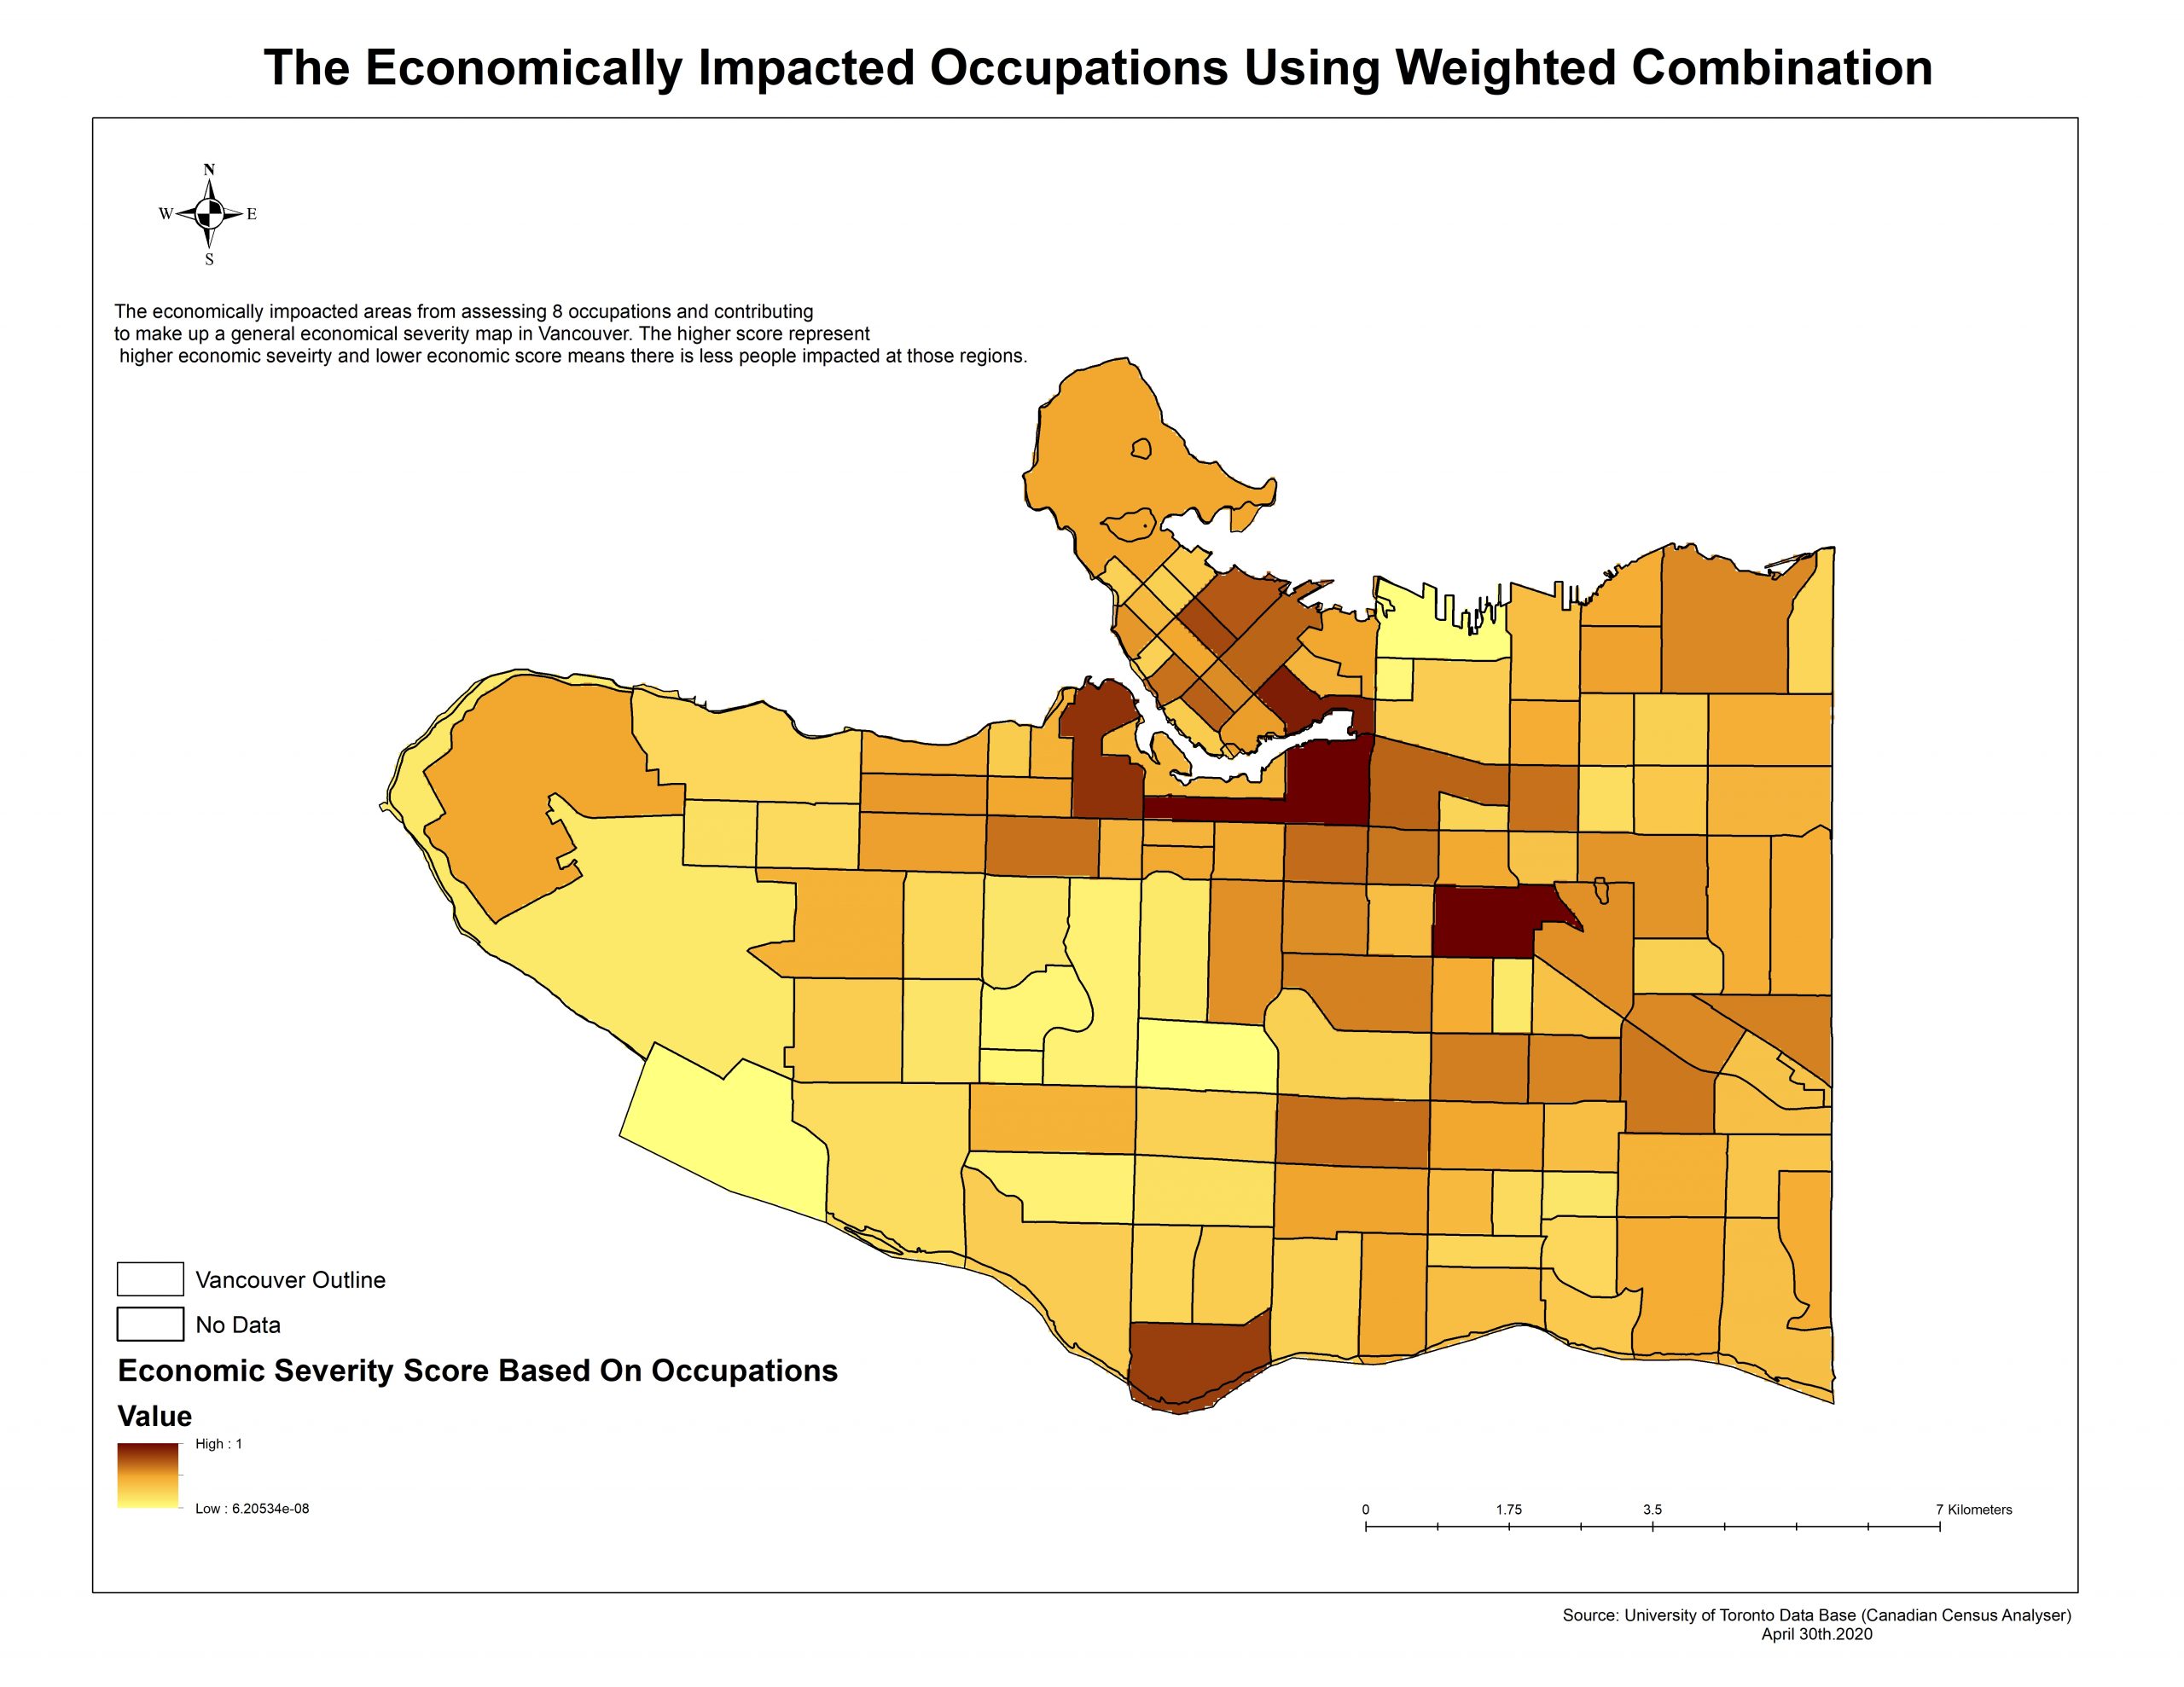 Explanation: The higher value means there is more economic impact because of more people in those areas are likely to face unemployment during this time.
Criteria 3) The economic impact for population paying 30% or higher income to shelter.
Criteria 4) The economic impact based on low-income private households in Vancouver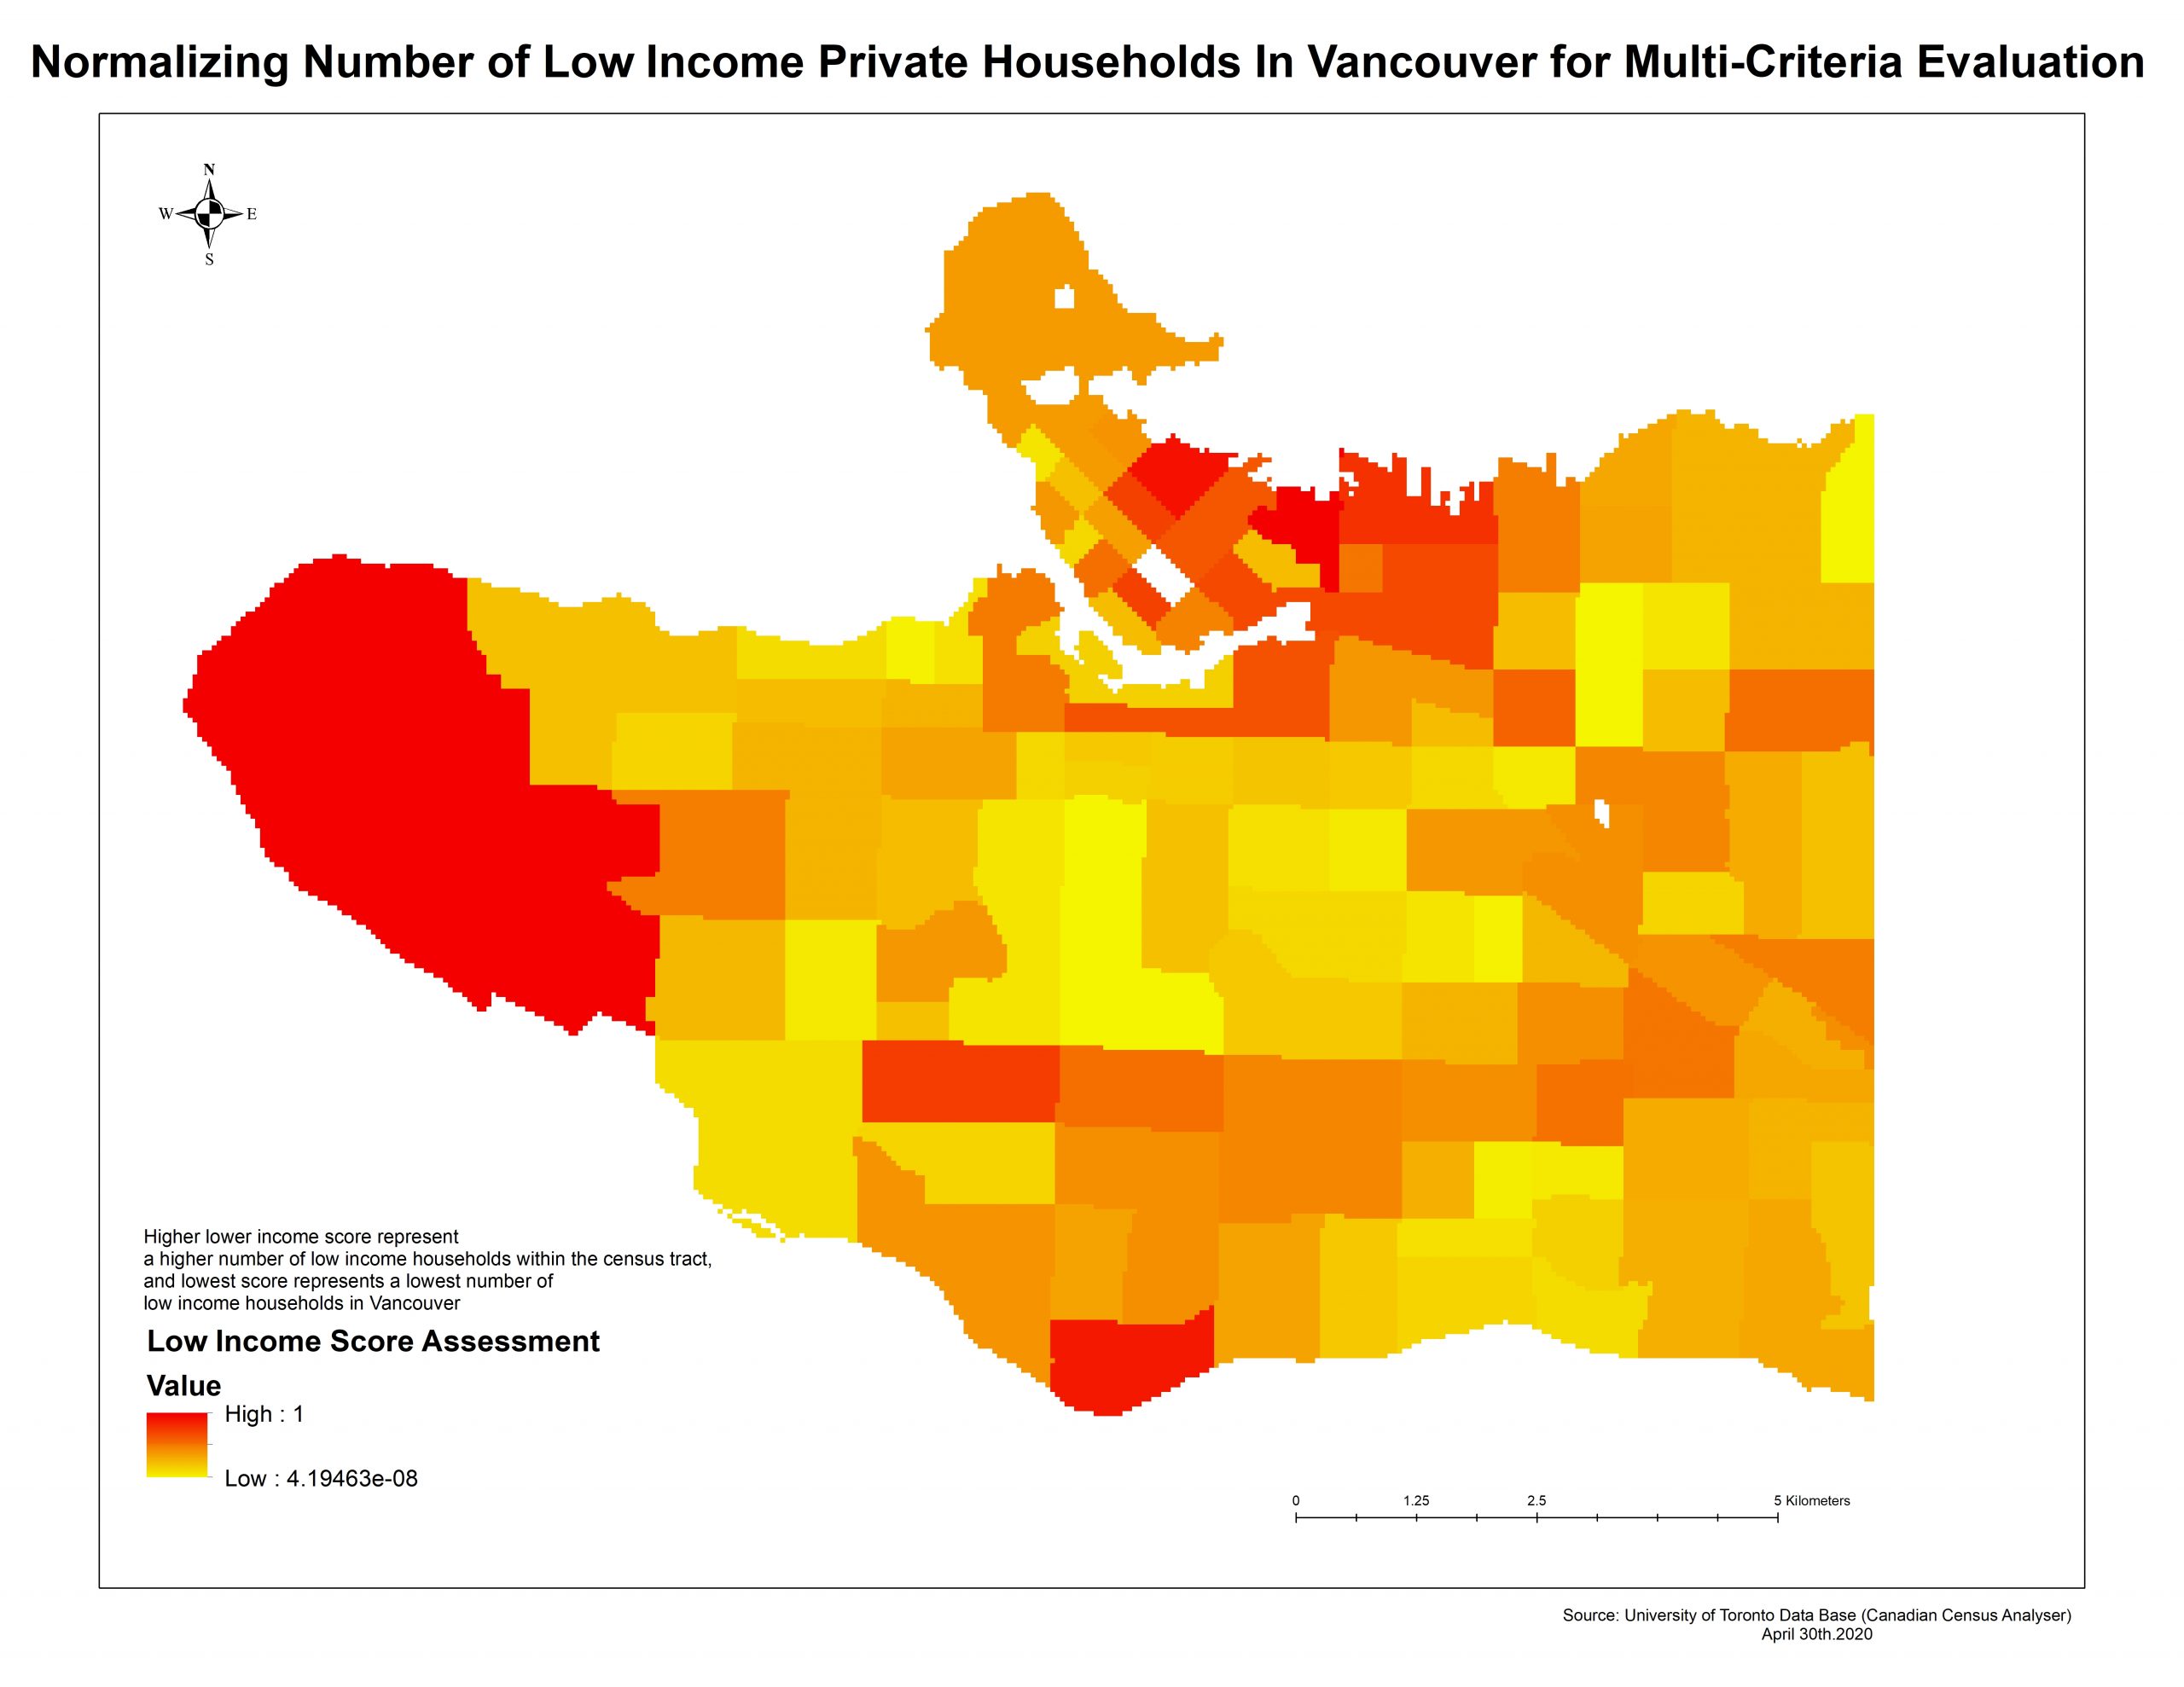
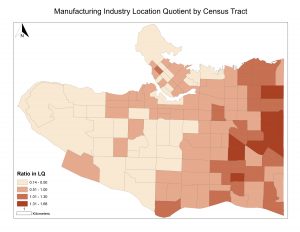
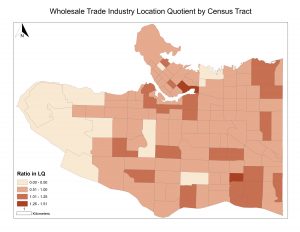
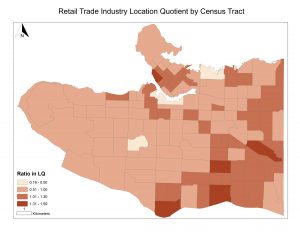
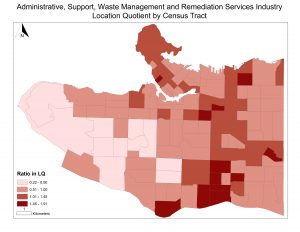
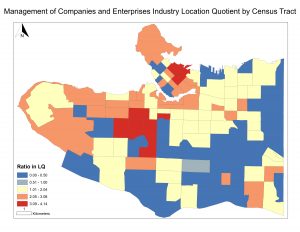
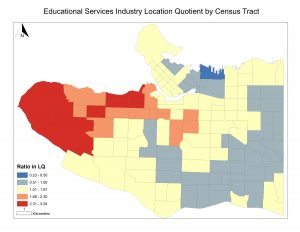
Location Quotient Analysis
The ratio of Location Quotient below 1 shows fewer people in that industry than the Great Vancouver average and if the ratio above 1 which indicates more people work in that industry than the Great Vancouver average.
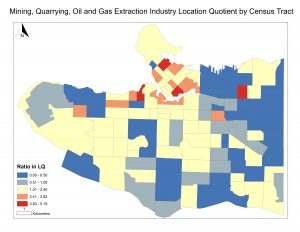
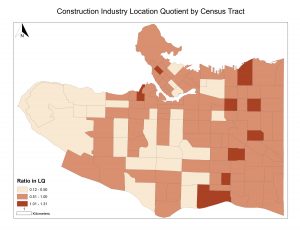
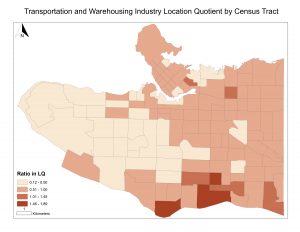
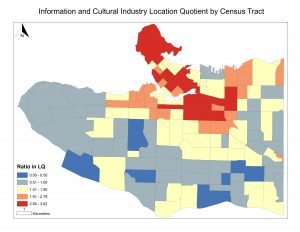
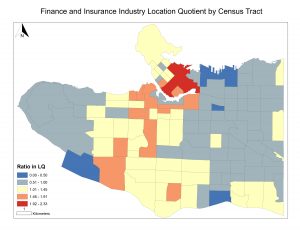
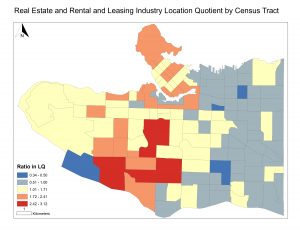
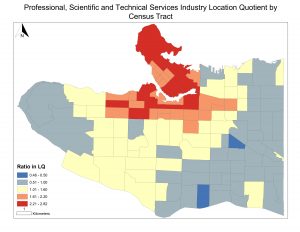
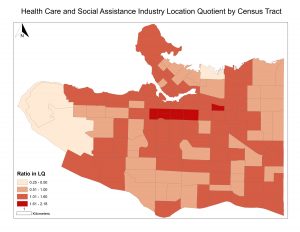
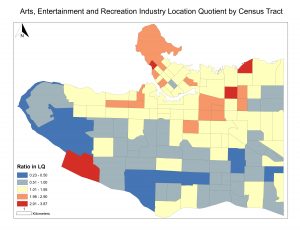
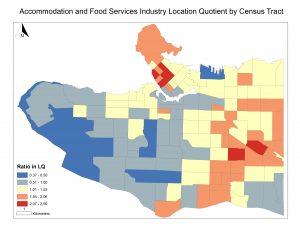
Based on the decrease rate of employment from March 2019 to March 2020 (Statistic Canada), every industry assigned a percentage that calculating the unemployment rate of each industry by total unemployment rate.
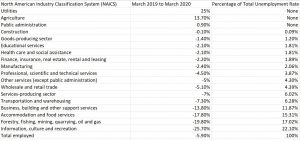
Since utility, agriculture and public assistance increased its employment rate, these three industries are not included in Location Quotient Analysis.