Topic: Mapping at-risk populations
Step 1: Determining at-risk demographic factors
| Older age
|
Census statistics of people over 65 were used for this analysis as people of older age tend to make up the majority of cases. |
| Males
|
According to research done by New York City Health, males are at higher risk of contracting the virus. Around 62% of cases are males and only 38% are women.
|
| Larger households | One ill person can potentially put everyone else in their house at risk, regardless if everyone else is quarantining.
|
| Renters | May be willing to put themselves at higher risk in order to pay rent.
|
| Public Transit Users | May come into contact with many people and touch objects that others may have been in contact with.
|
| Population Density | Areas with higher population density may have higher risk of infection.
|
Step 2:
Several maps were created in order to see how different vulnerable demographics would be affected by COVID-19. Data was collected from CHASS Data Centre, providing census tract and dissemination area data and shapefiles were gathered from Canada’s open data center. Tabular data was joined to the DA and CT shapefiles in order to create choropleth maps which represented several at-risk groups. Data was classified by equal interval as it is a useful classification scale for percentage data. The CT and DA maps were created through the ArcMap program from ESRI.
On the program ArcMap Pro, in order to find where the population would be most affected by coronavirus, we decided to perform an exploratory regression. This was done after joining the tabular census data to the shapefile of the Vancouver and Burnaby Dissemination Area. The regression analysis allows for estimation of the relationships between dependent variables and the population. In order to do the regression, an exploratory regression analysis was performed, and decided to use the variables of people of the age of 65, males over the age of 65, males of all ages, average household size, renters, and individuals who use public transit, with the independent variable of general population. A generalized linear analysis was also used to find the statistics associated with the variables, with a continuous gaussian model type. A geographically weighted analysis was then performed in order to explore the spatial relationship of the variables. A method of nearest neighbours was used, with the number set to 250.
Topic 2: Mapping the severity of economic impact across Vancouver by adding up the economic impacts within the groups of population and industries that are likely to be a harder hit
There are two aspects to consider when mapping the severity of economic impact, the first aspect is mapping the absolute raw count of a vulnerable population because that tells us of areas that are likely to be harder hit because more people are categorized as low income, or spent 30% income over on rent. The total number of vulnerable is important because we will use a weighted sum tool to combine all the criteria therefore it will contribute to the overall economic severity across Vancouver. Next, our second aspect is considering the location quotient to evaluate the risks of economic impact rather than severity. It will tell us if this CT has more of this type of person at risk than the city does on average. For instance, in Downtown Vancouver, retail trade industries have an LQ of 5.9 — which means that is nearly six times more concentrated there than the typical region — and employ over 300 workers. As a result, we know that retail trade is a vital component to the economy, especially in downtown. Other industries, such as education (LQ, 2.22) and health (LQ, 3.39) also have high LQs, but because they employ less than 70 people, a decline in employment in these two combined will still be less than the economic severity of retail trade in Downtown. But, if the economic risk and severity are both very high in downtown. We noticed the LQ for all three industries is higher than average in Downtown meaning there are higher economic risks in the area, and if we evaluate our economic severity map, then we can assess their overall risks and severity to find which areas have the highest economic risks and severity. If downtown has high economic risks with high economic severity then downtown will face heavier economic impacts.
Step 1: Preliminary research (Determining criteria for Multi-Criteria Evaluation)
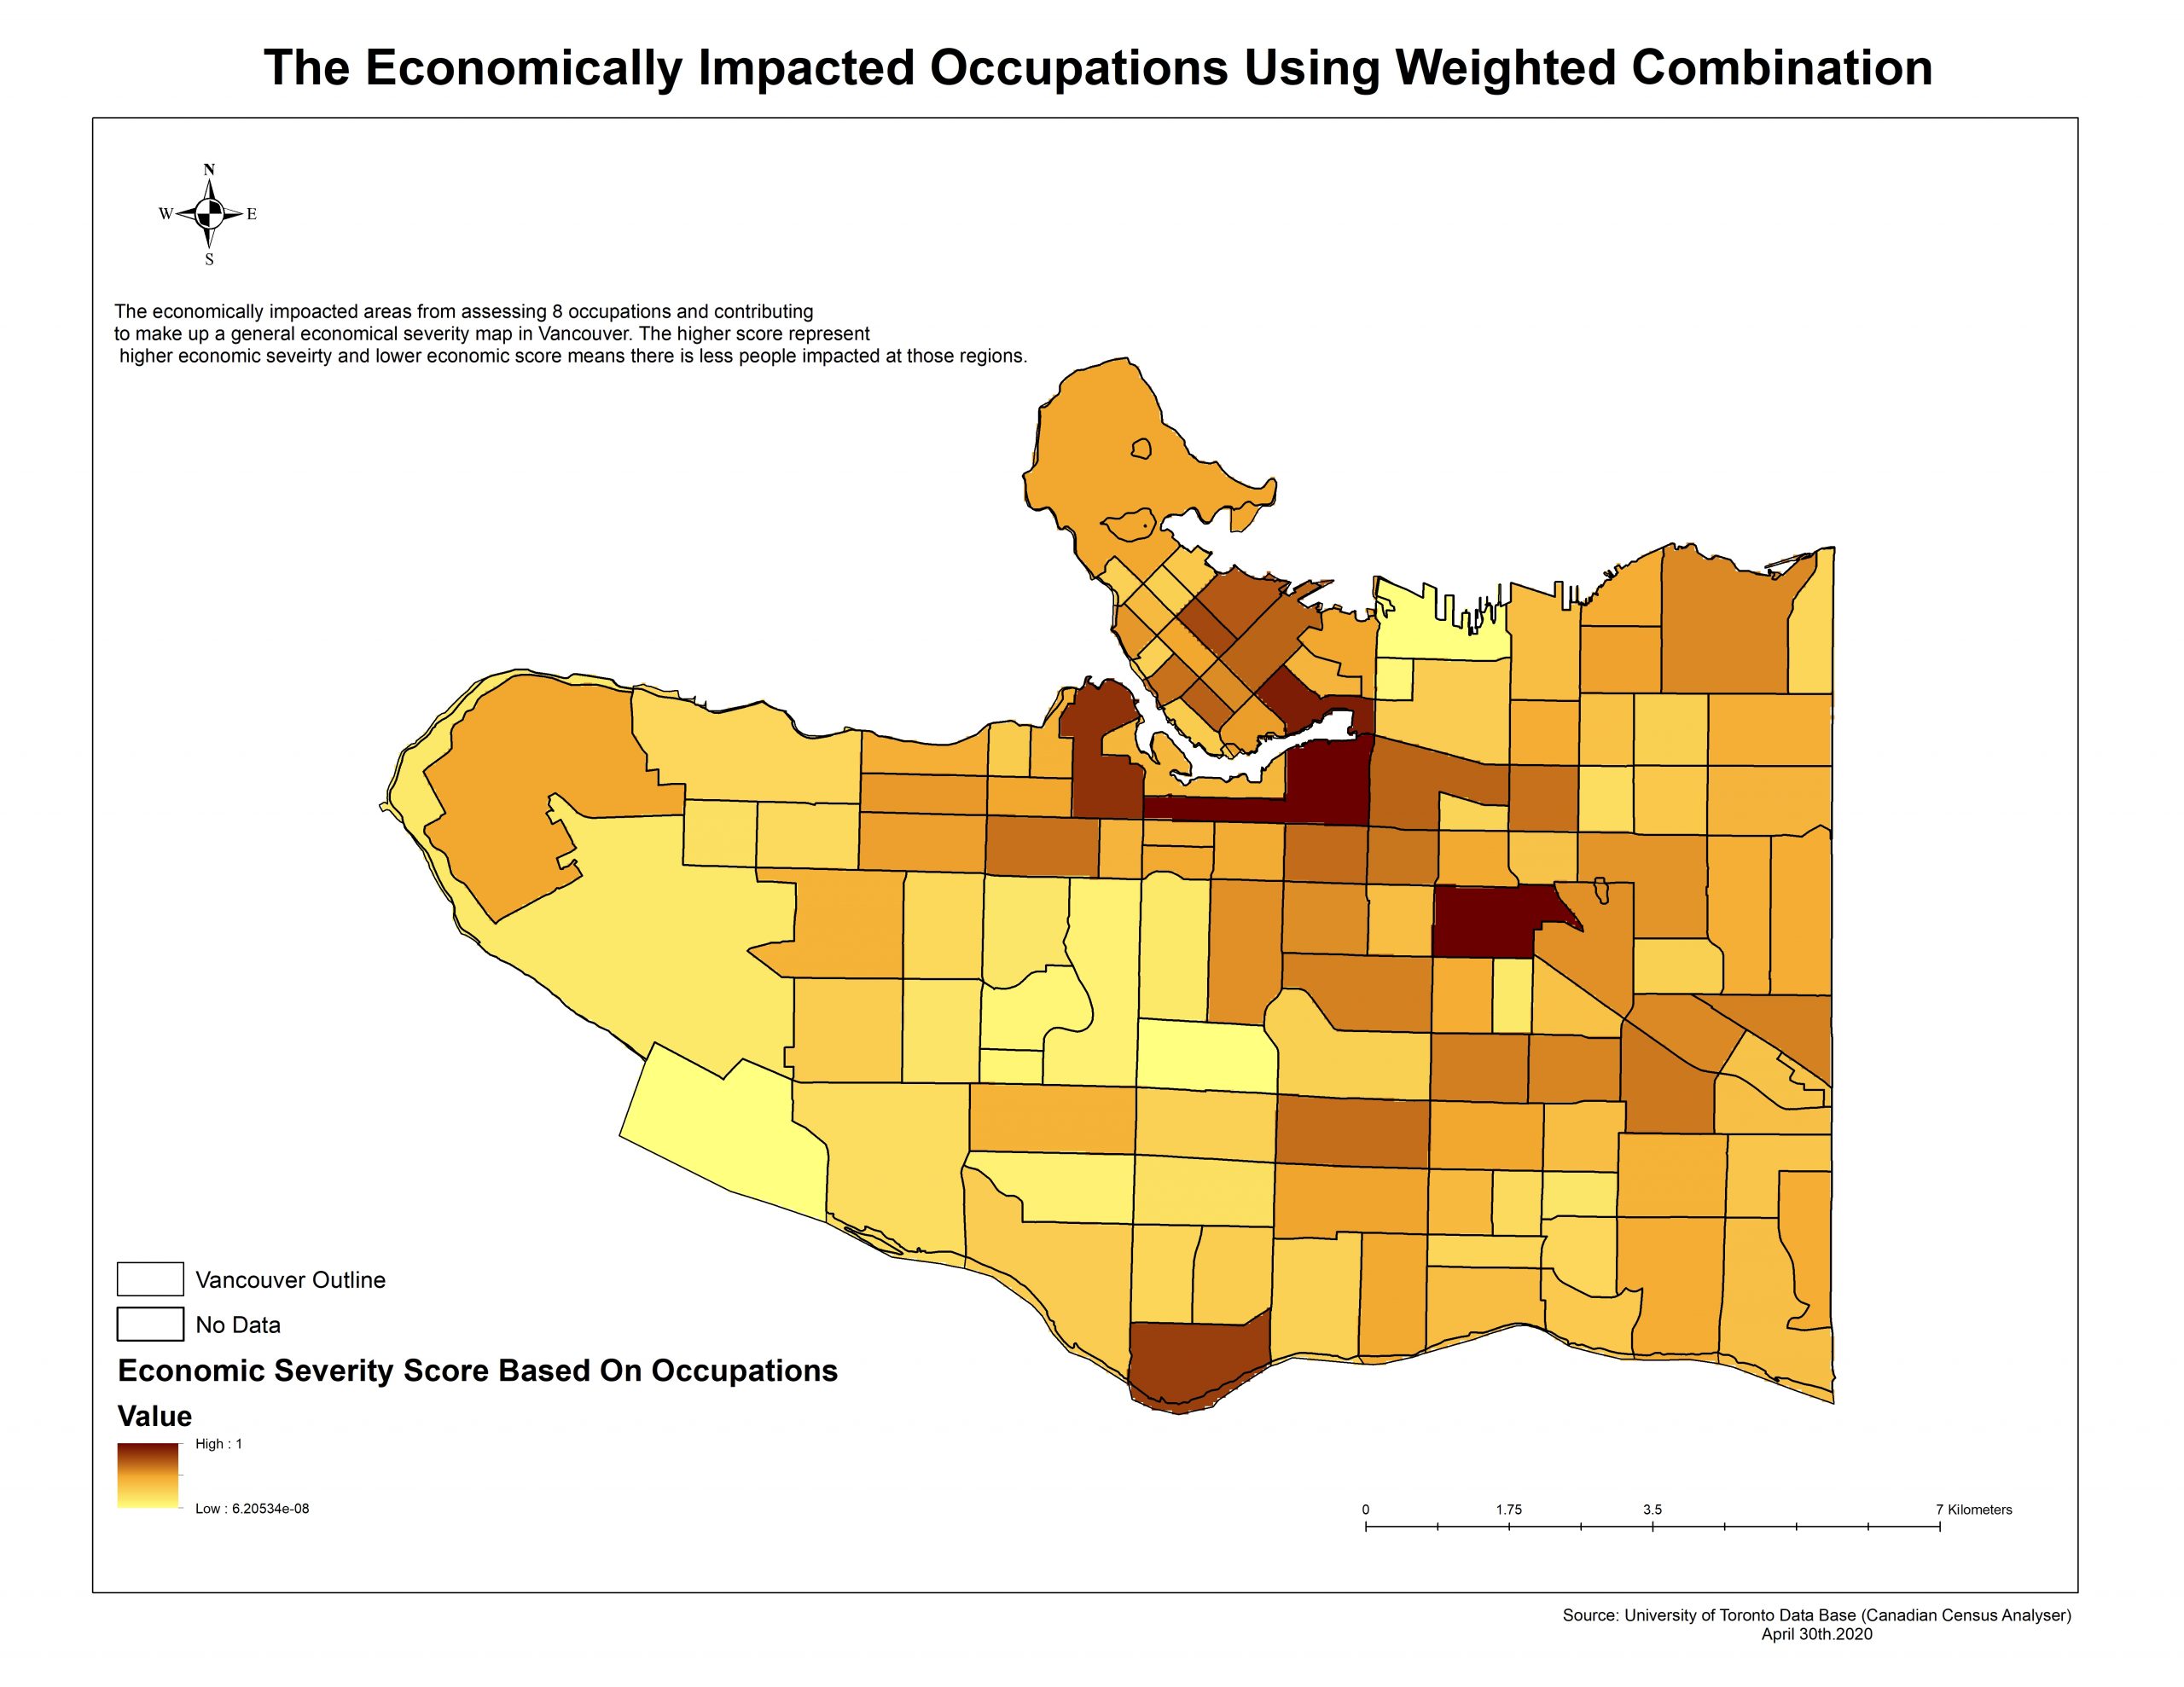
Due to the state of an emergency happening in Vancouver, we notice there are 8 occupations that are considered to be economically impacted which include (service and sale occupation, real estate and rental industries, retail trade industries, arts and entertainment industries, hotels, tourist sites, occupations in art, culture, community, and government services ) have encountered economic impact. While health care, education, and technical service industries are still active. We will generate an occupation severity map using a weighted sum tool and it includes 8 criteria that makeup 8 occupations. The occupation severity map will be counted as 1 criterion for the final economically severity map. On the other hand for vulnerable populations, we drew the criteria that fit as a vulnerable population, and those that are eligible to receive the Government of Canada emergency benefit are also vulnerable groups. We will be mapping the severity of economic impact across Vancouver and Multi-Criteria Evaluation is a combination of factors that together contribute to the severity of Economic Impacts. Areas with lots of people paying more than 30% of their income toward rent, with private households whose primary household maintainer is over age 65, and low-income families together in one area will enhance the severity of economic impact in those regions. With multiple people that fit among these categories shows that these areas are severely impacted by current circumstances, and who would be least able to afford the rent for a month or more. The MCE will highlight an economic severity map that shows areas that have been severely impacted under this circumstance and highlight that there are lots of people in that area who would not be able to pay rent or will face business bankruptcy. These economic impacts signal heavy consequences that will have an influence on the area’s land prices, business change, and will affect people’s social movements in the future.
|
Themes
|
Corresponding criteria for this project |
|
| Family paying over 30% income for rent |
1. Due to on-going state of emergency, many people have lost jobs or faced a reduction in working hours, and those who rely on income to pay for rent will have no means of paying rent in the current situation. The areas with a higher number of families paying over 30% income for rent will likely tell us the severity of economic impact in those regions. |
|
| Primary household maintainer over 65 | 2. Primary household maintainer states they are responsible for mortgage, rent, bills, and handle the household’s finance. Those households with primary maintainer over 65 could symbolize they have to pay for shelter without a dependent income in this time.
|
|
| Low-income families | 3.Families that are considered low incomes will have a harder time managing through COVID-19 due to job loss and lower-income.
|
|
| Impacted Occupations
Industrial Land & Commercial Land |
4. There are 8 sub-criteria for Impacted Occupations
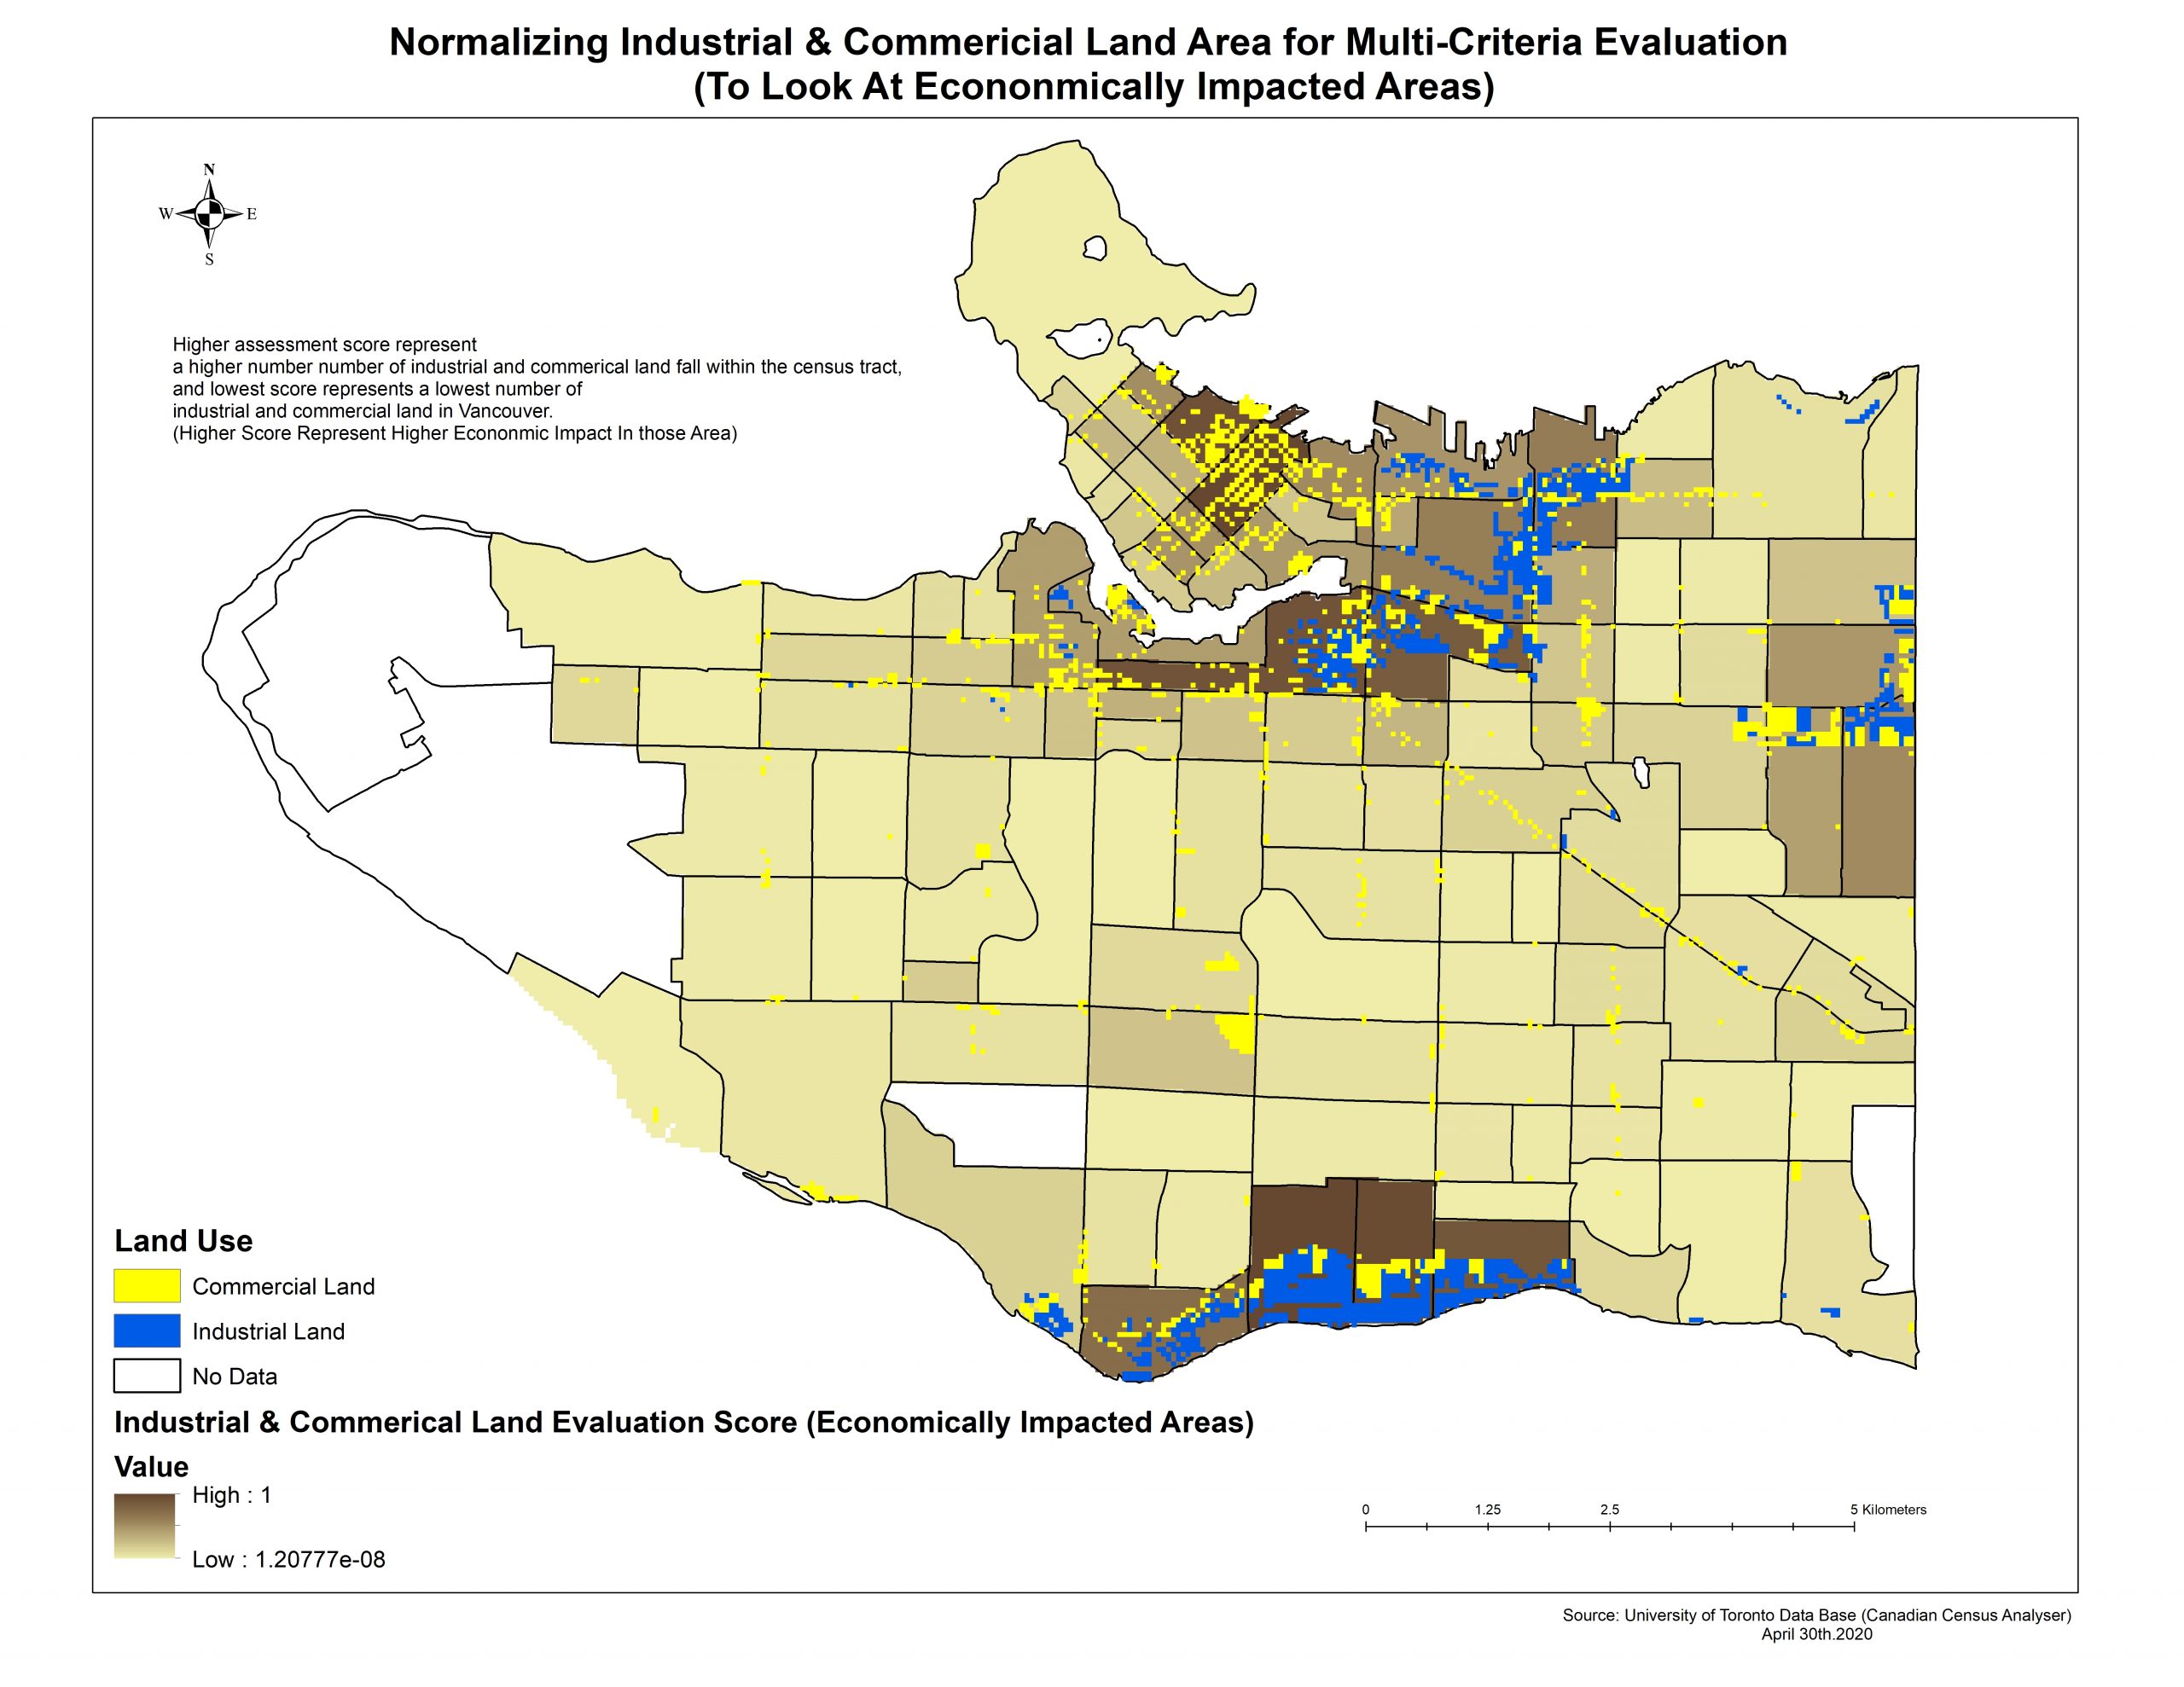
5. The industrial and commercial land tells us that they are business area or industrial areas where the economic impact is prone to happen.
|
Step 2: Normalizing and standardizing sub-criteria
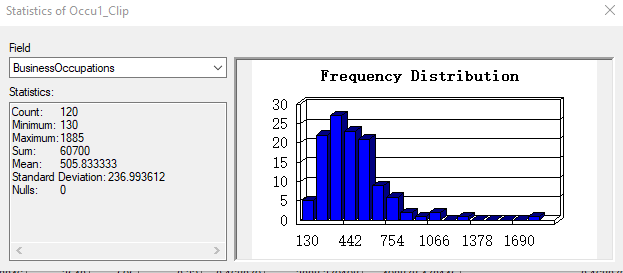
We normalize our criteria using the “Field Calculator,” we found the max number of people in each criterion, for example, we created a new column that contains the Raw number of people in Business Occupations and divided by the maximum value of people in Business Occupations that is 1885. This way we can normalize those CT with the highest number of people with a max value of 1 and areas with the lowest number of people are less severely impacted. We standardize all of our criteria so their value is evaluated on a common scale, and we build a Map Algebra Expression that is (factor – Minimum value of (factor) / (Maximum value of (factor) – Minimum value of (factor) ). This way, the values have the same range that can be applied to a Weighted Combination.

Step 3: Determining the weights of sub-criteria for Impacted Occupations & Using the Weighted Sum Tool to combine sub-criteria of Impacted occupation
This step consists of how to weight the sub-criteria for Impacted Occupations because we have a total of 8 occupations to consider when we are looking at their respective economic impacts. Each occupation will be weighted from highest to least by looking at their unemployment rate changes from December 2019 to March 2020. Since we know there has been an increase in unemployment due to COVID-19 and economic impacts, so the unemployment rate change data gives us a good insight into how much each occupation has been effected. We also took a look at each occupation’s total labour force to notice that occupations with larger labour force and facing higher unemployment shows that they are hit the hardest. Therefore we will weight them by looking at their labour force total, and unemployment rate change. For example, arts, culture, recreation, and sports occupation had suffered the largest unemployment rate change, and this is due to the suspension of social gathering. Their unemployment rate increased by 7% and accounts for a total of 1969 people, where the total labour force is 28130. This is the largest number of people unemployed during the past 3 months within an occupation, and we will assign the art occupation with the largest weighting to produce an economic severity map. The second highest is trade, transport, and equipment operators that have a total labour force of 91405 people in Vancouver with the largest labour force out of all impacted occupations, but their unemployment rate only changed by 1.8% which is about an additional 1645 people suffering unemployment. On the other hand, sales and service occupation unemployment rate spiked up by 5.9% which is an additional 1589 people. Therefore we put sales and trades occupation at the same weight. We did the same for all other occupations, and the table looks like:
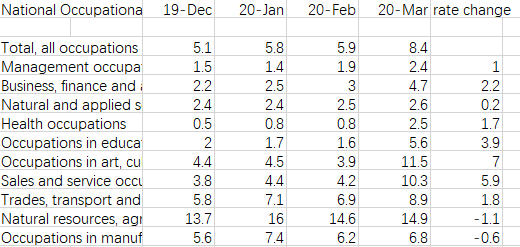
arts, culture, recreation, and sports occupation an additional 1969 people unemployed from December 19 to March 20
trade, transport, and equipment operators an additional 1645 people unemployed from December 19 to March 20
sales and service occupation an additional 1589 people unemployed from December 19 to March 20
Management occupations an additional 454 people unemployed from December 19 to March 20
Business, finance and administration occupations an additional 1335 people unemployed from December 19 to March 20
Health occupations an additional 427 people unemployed from December 19 to March 20
Occupations in education, law and social, community and government services an additional 1560 people unemployed from December 19 to March 20
Occupations in natural and applied science show an additional 67 people unemployed from December 19 to March 20
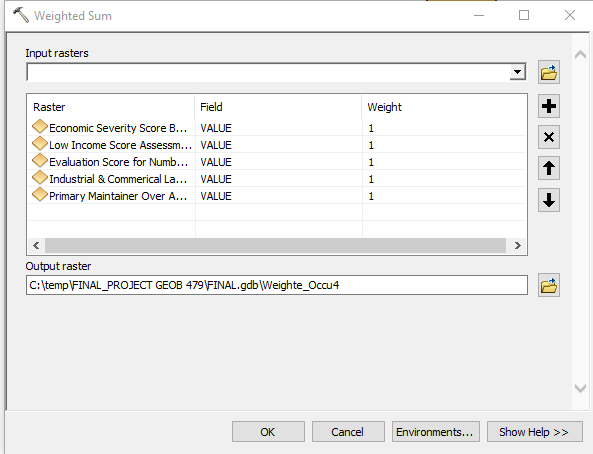
After that, we created an economic severity map for these occupations using the weighted sum tools with their respective weights based on the number of additional unemployed people.
Step 4: Normalizing and Standardizing all of the criteria for final economic severity map
Criteria 1) The Industrial and Commercial Land Economic Severity using a stretched color ramp, and land use classification overlay on top.
Explanation: Since Industrial and Commercial Land is very concentrated in Broadway Road, and Downtown Vancouver. It is expected these areas will contribute to higher economic severity, and we normalized those census tract regions by calculating the % areas of Industrial and Commercial Land.
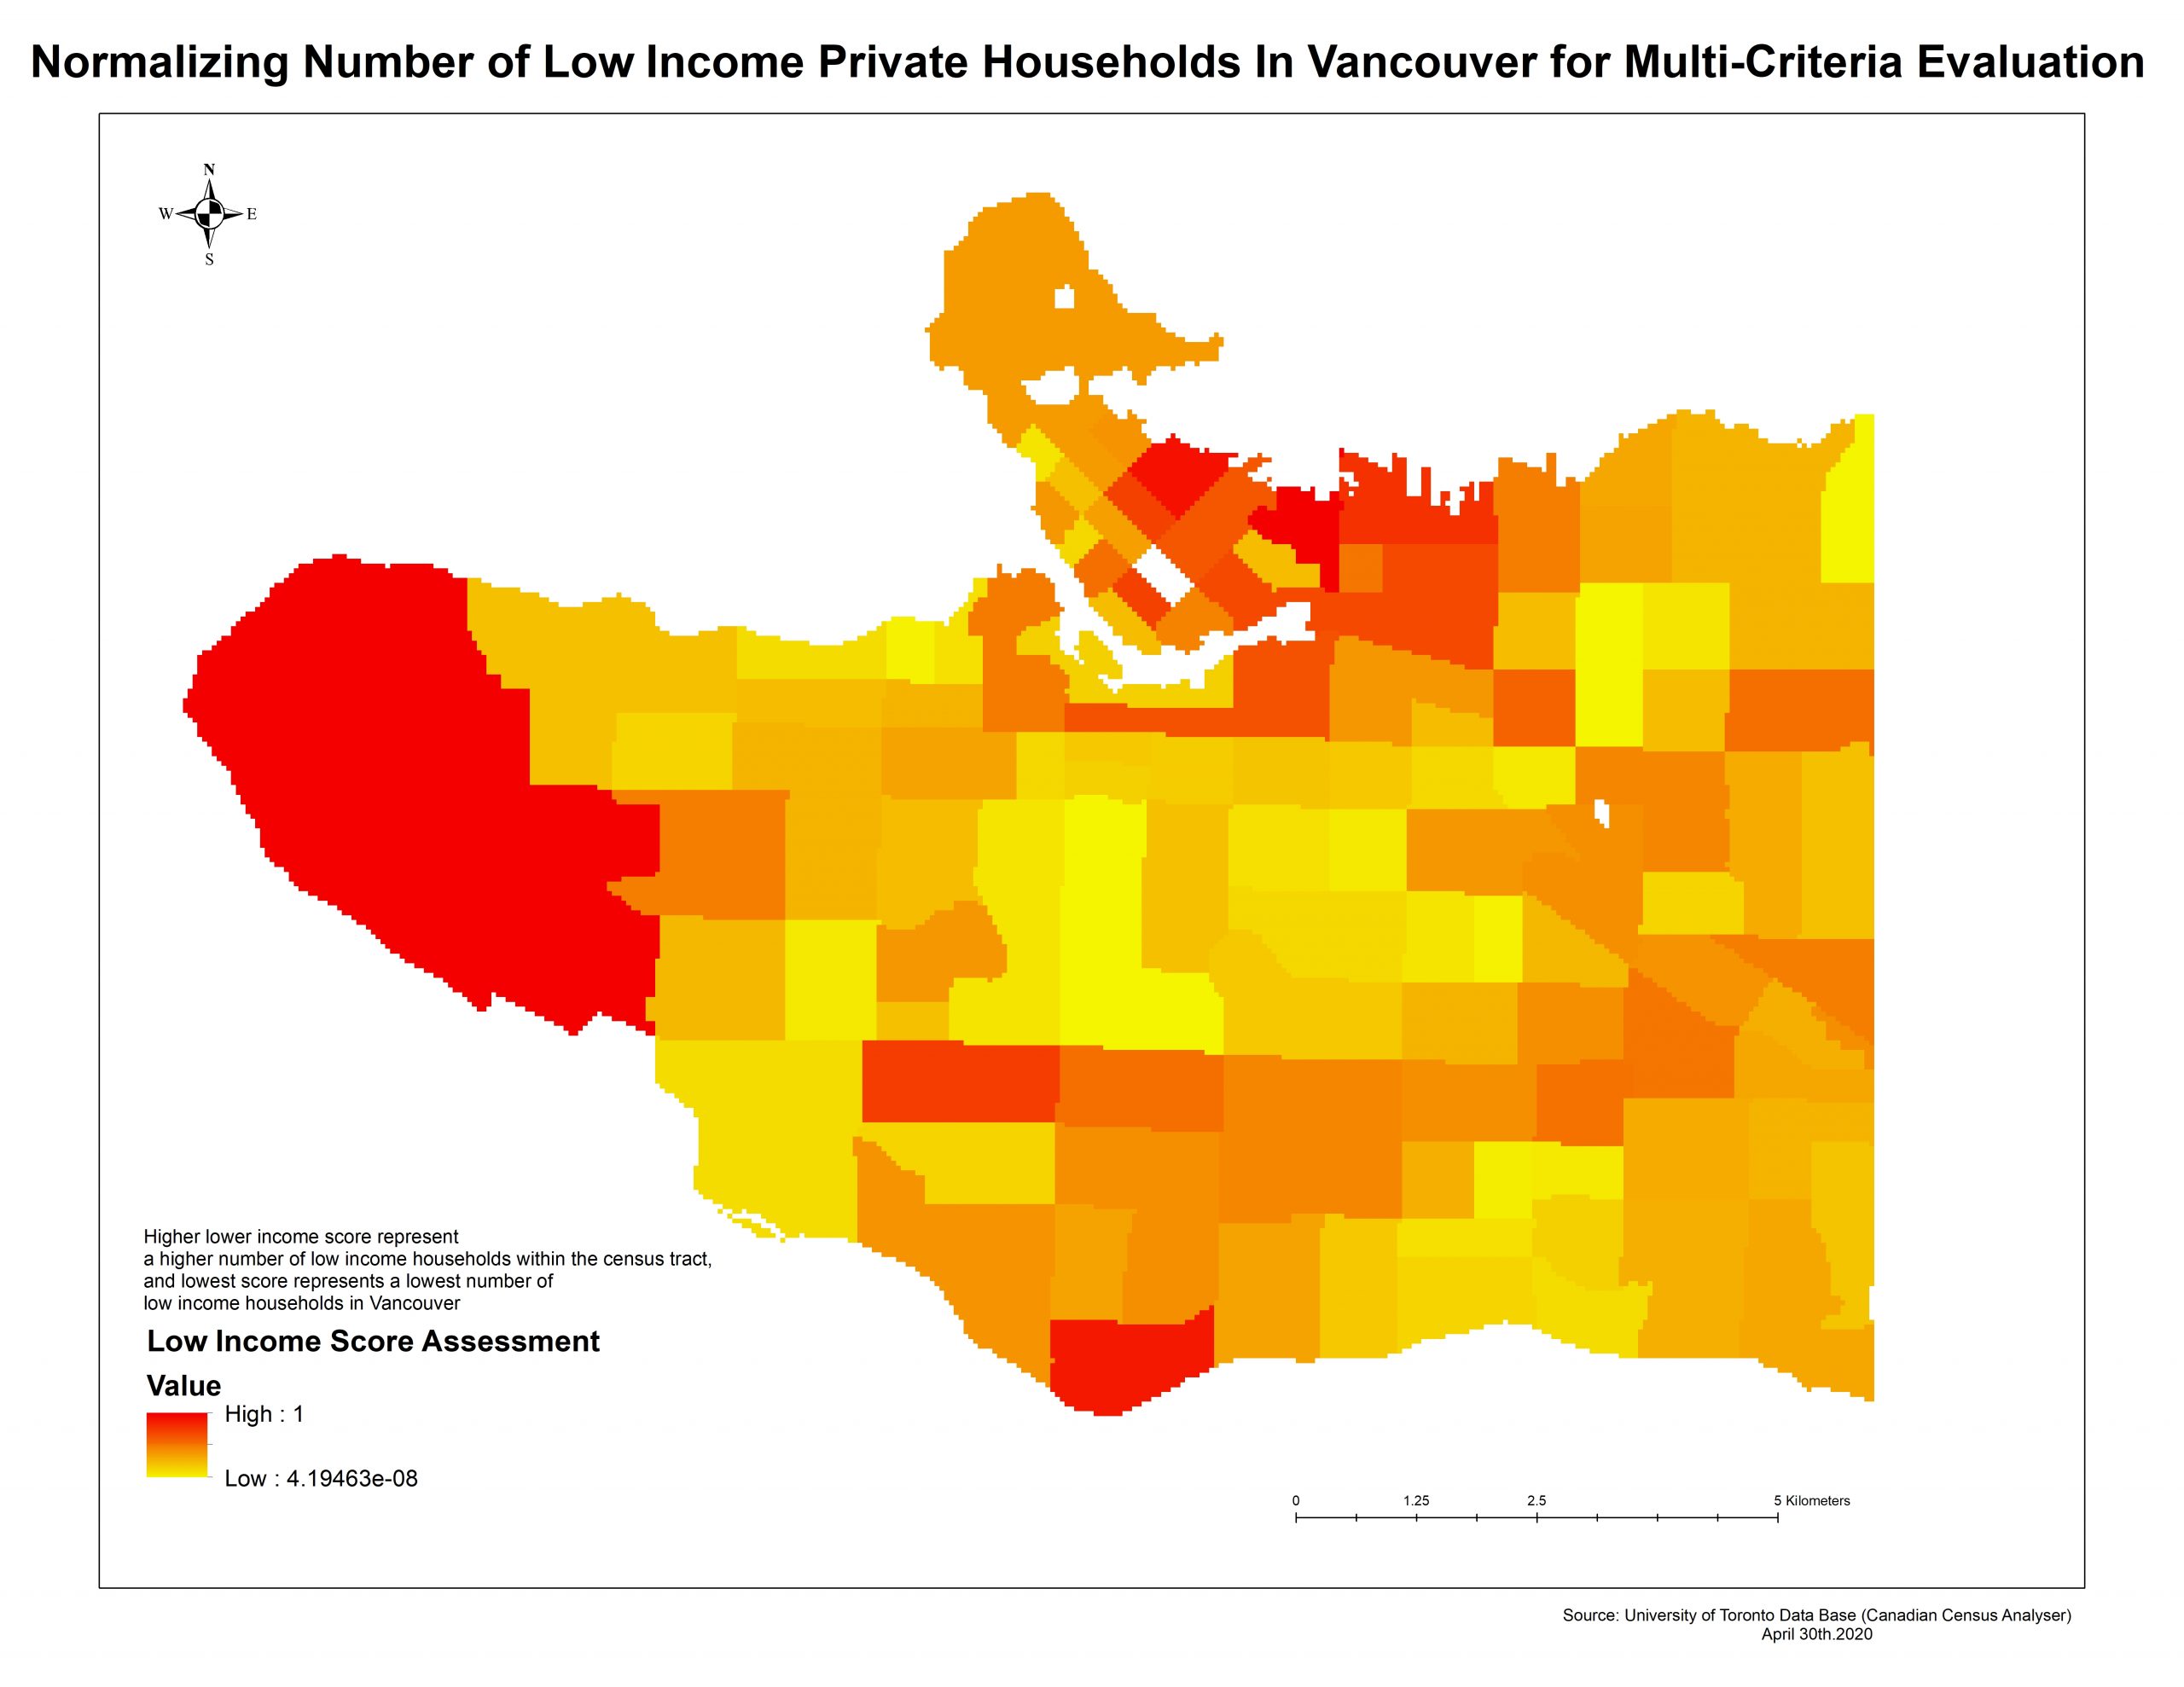
Criteria 2) The number of low-income private households in Vancouver by normalizing by the high number of low-income private households in Vancouver.
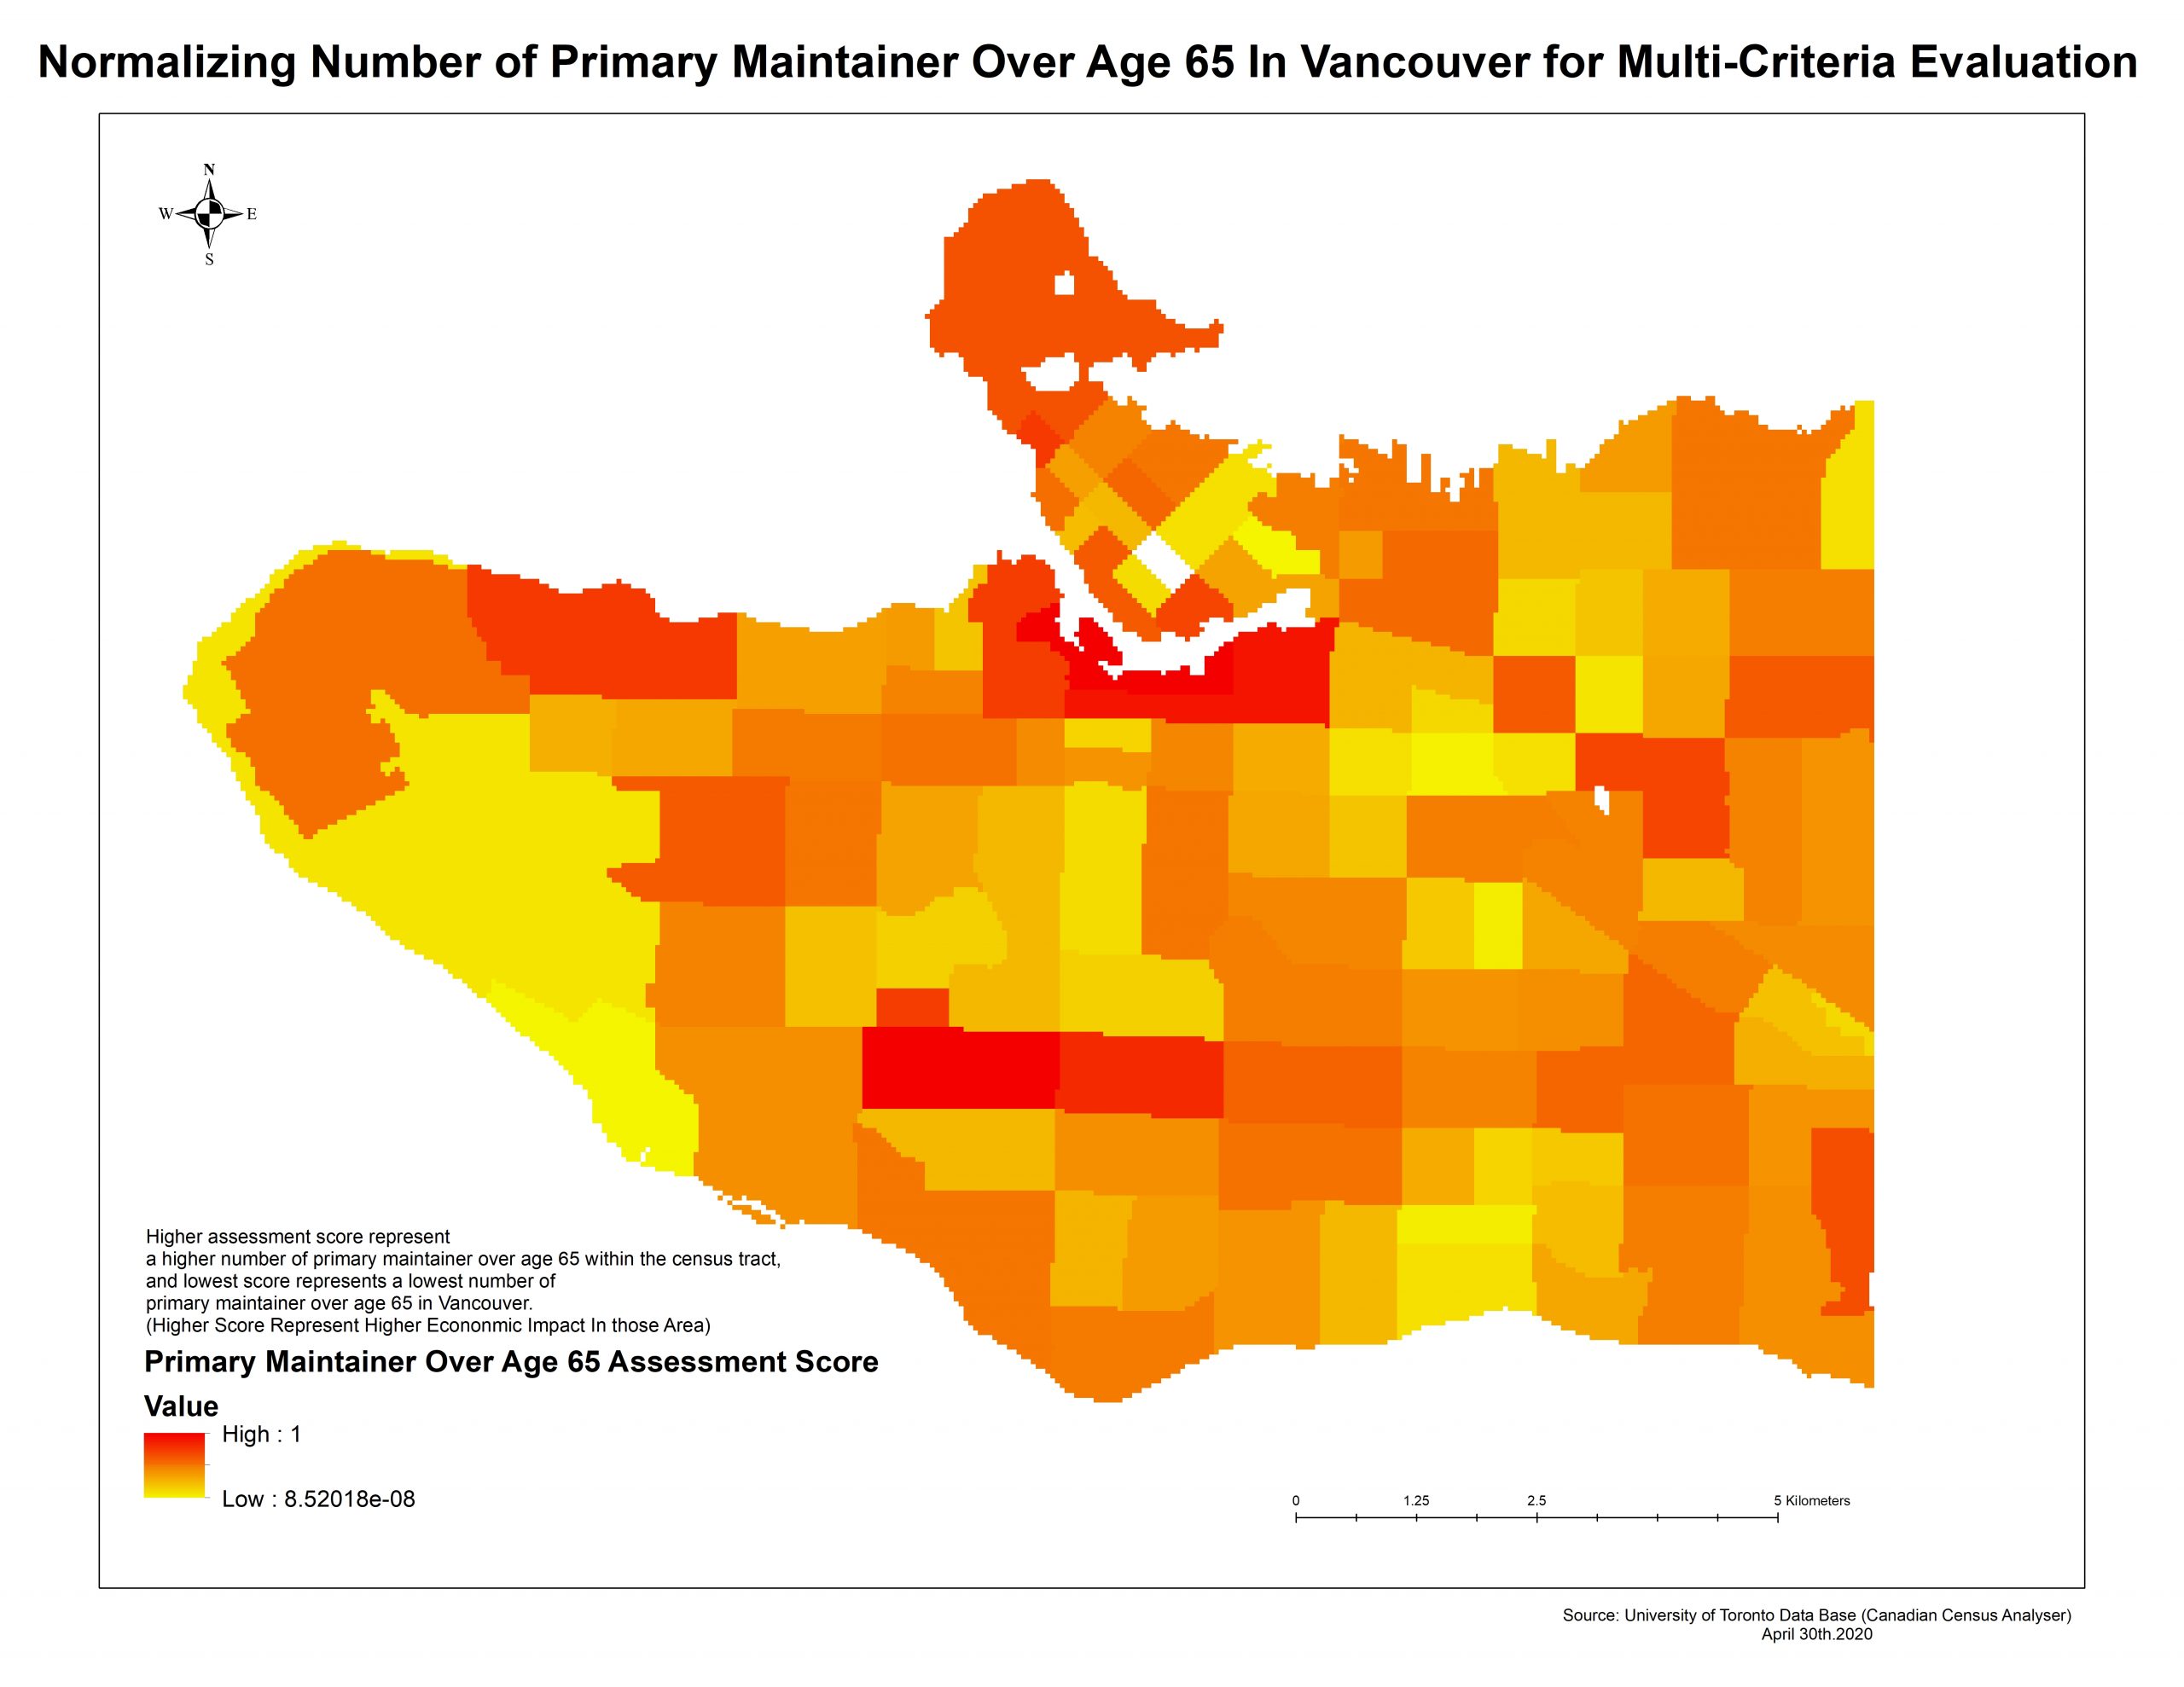
Criteria 3) The number of primary maintainer over age 65 normalized by dividing by the highest number of primary maintainer over age 65.
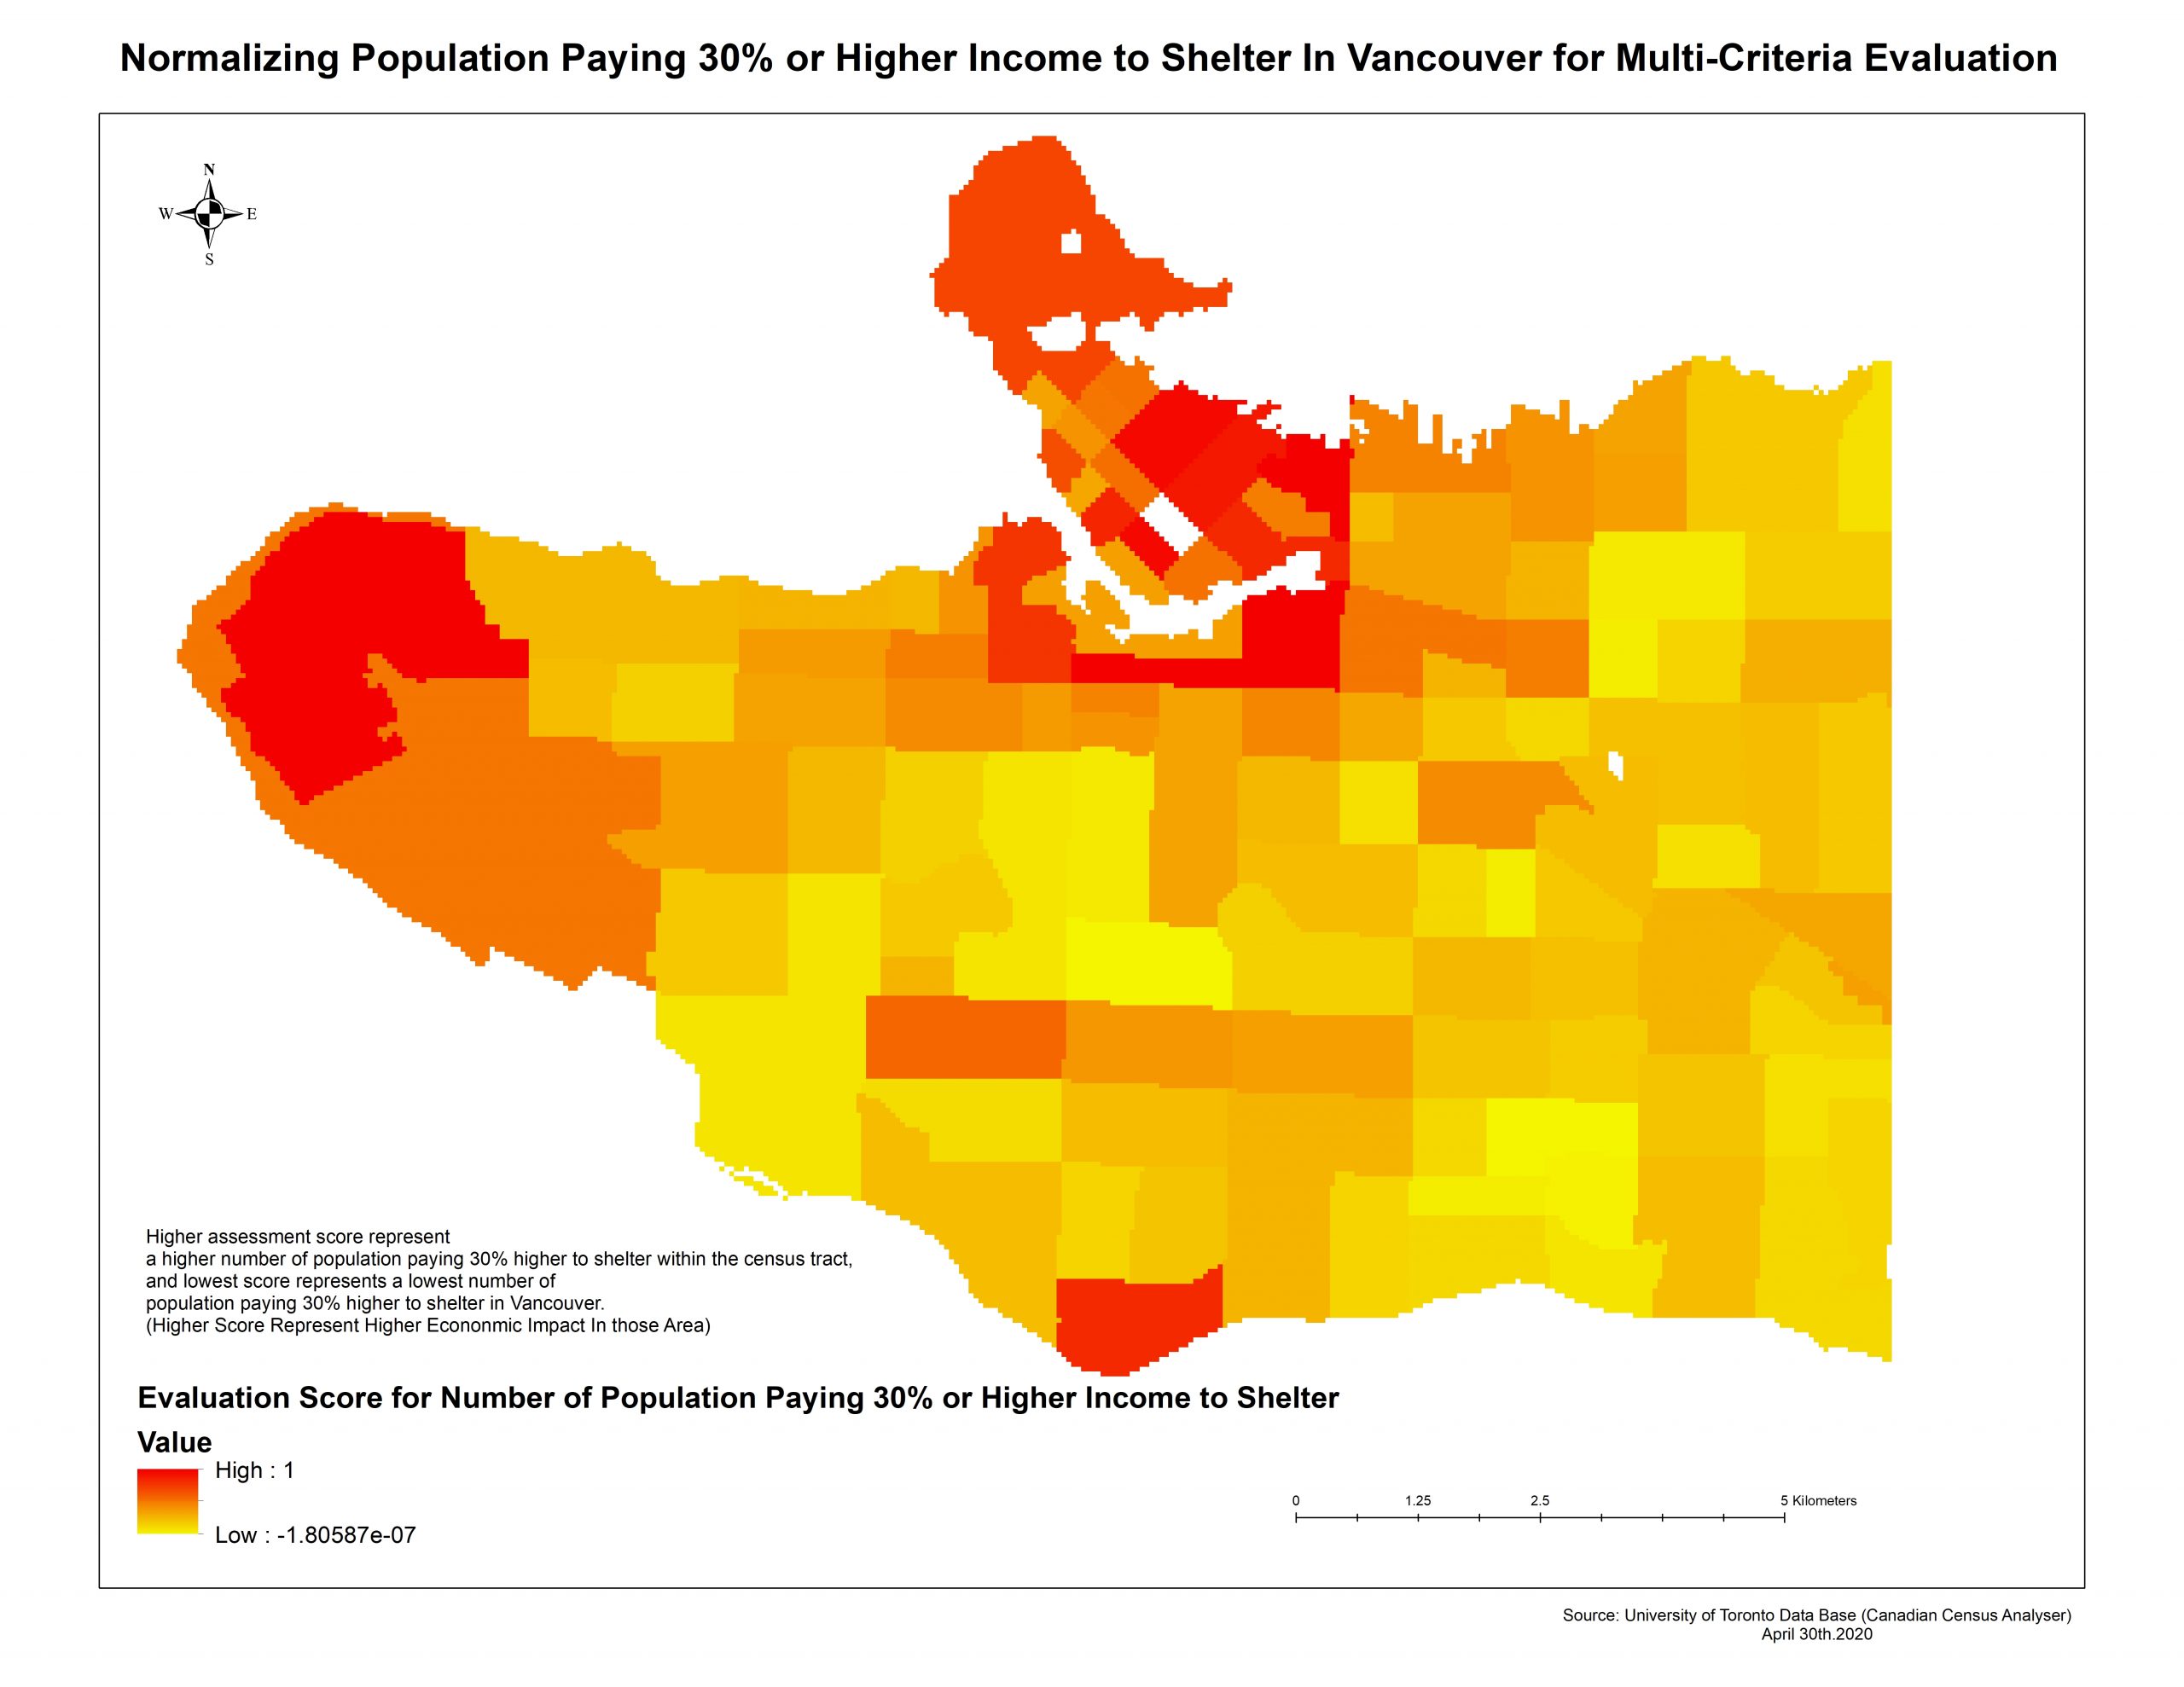
Criteria 4) The number of people paying 30% or higher income to shelter within each census tract and dividing by the highest number of people paying 30% or higher income to shelter among all census tract
Standardizing all the criteria to be within a common scale is done by “Raster Calculator”
Example) Standardize Low Income Criteria to be within the same range as other criteria.
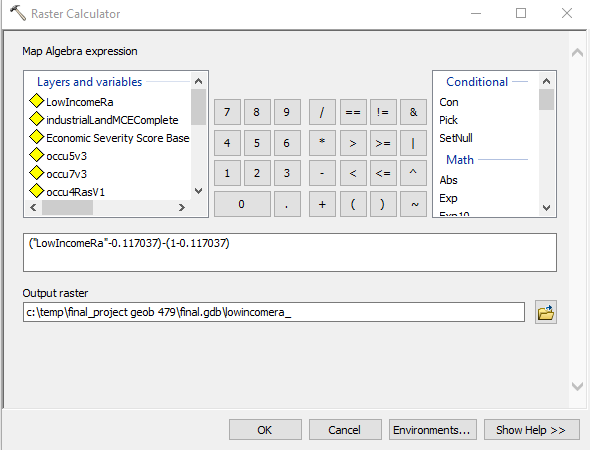
Step 5: Using the Weighted Sum tool to produce the final economically severity map
Topic 3: Considering The Location Quotient For Industries
Location Quotient analysis is a method to find industrial specialization areas in the regional economy. For example, the education industry in Vancouver accounts for 1 and in UBC area education industry ratio is 1.5 . This indicates the education industry is 1.5 times concentrated in UBC than the Vancouver average.
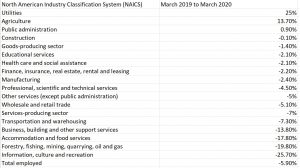
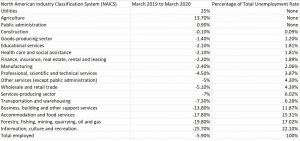
Based on the employment rate from Statistic Canada, industries are negatively affected are construction, goods-producing sector, educational services, health care and social assistance, finance, insurance, real estate, rental and leasing, manufacturing, profession, scientific and technical services, wholesale and retail trade, services-producing sector, transportation and warehousing, business, building and other support services, accommodation and food services, forestry, fishing, mining quarrying, oil and gas, information, culture and recreation. Thus, these industries are analyzed by location quotient and the location quotient ratio is weighted by the percentage of industry unemployment rate in order to show industry distressed area during COV-19.
LQ formula: raw count of the specific industry for census tract/ the total population fro the census tract/the total number of the specific industry in Vancouver/ the total population in Vancouver
LQ weighted value by unemployment percentage: LQ of X for the census tract* weightX + LQ of Y for census tract* weightY …… + LQ of Z for the census tract* weightZ