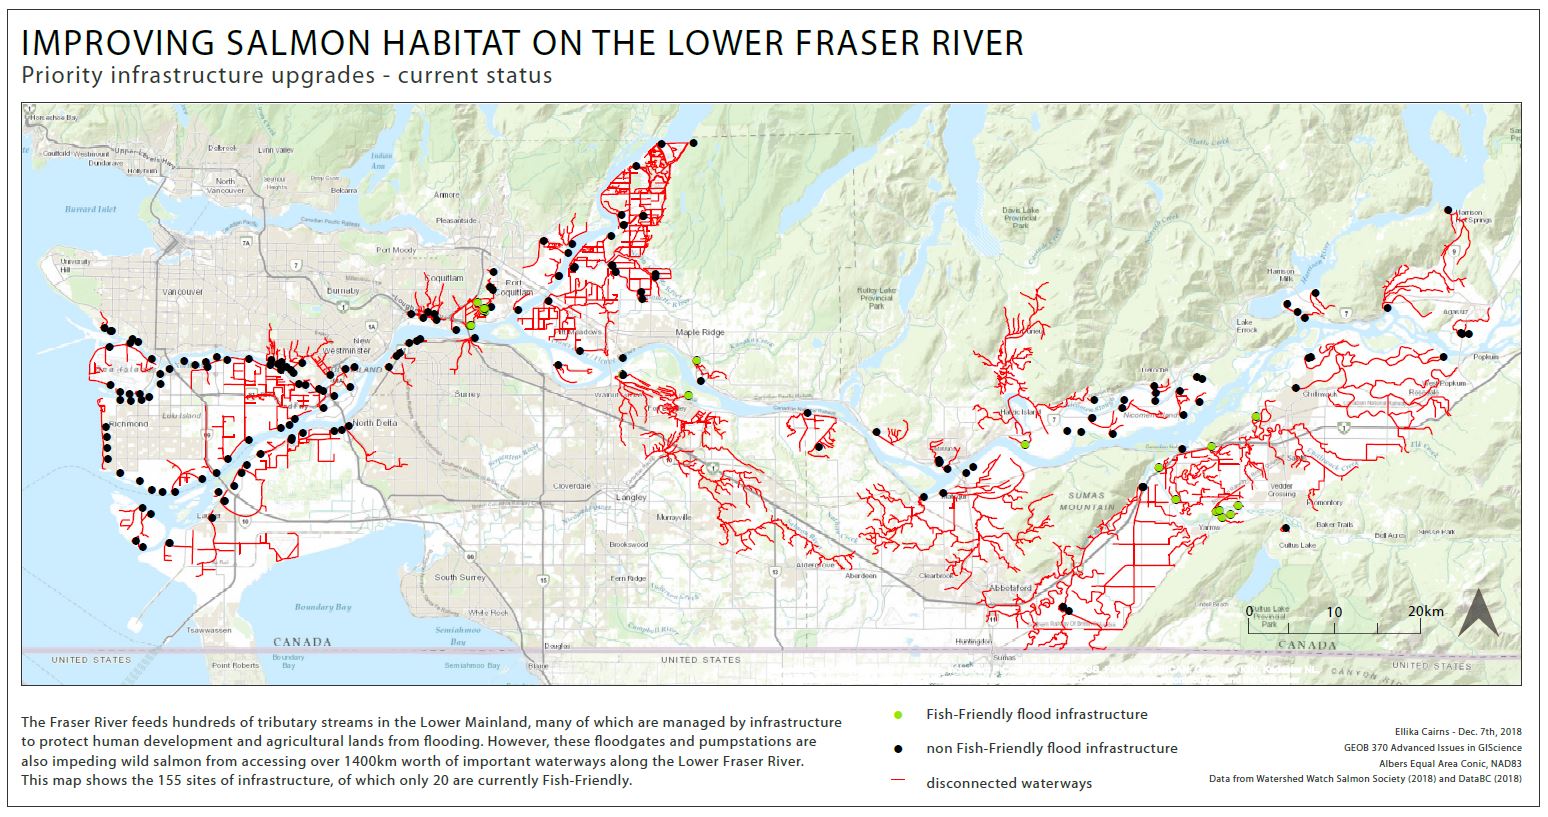
Before beginning analysis, a preliminary map showing the current state of flood infrastructure along the Lower Fraser was created.
In order to determine the top 10 priority floodgates or pump stations for Fish-Friendly upgrades, a Multi-criteria evaluation was conducted using ArcMap software. The following is an overview of the necessary methodology for this evaluation:
Sourcing the data
The primary data used in this analysis was provided by Watershed Watch Salmon Society. It consisted of shapefiles and excel sheets with information about over 155 sites of flood infrastructure located in tributaries from the Lower Fraser River. For all of the sites, there was data provided for location, type of infrastructure, length of the upstream potential salmon-bearing habitat, and whether they were already Fish-Friendly or not. Watershed Watch has also collected data on water quality for some of the upstream waterways, but not all of them.
Base data was sourced from DataBC.
Creating the criteria
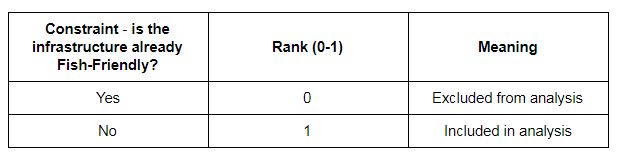
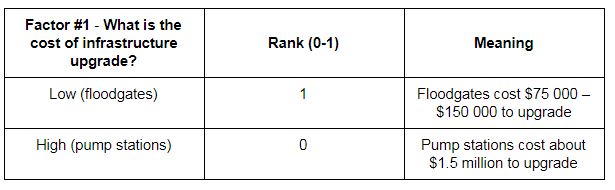
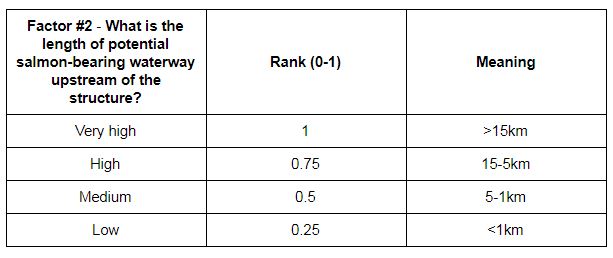
Based on the available data and working with a draft of prioritization criteria from Watershed Watch’s Project Biologist, Tanis Gower, the following constraints and factors were determined:
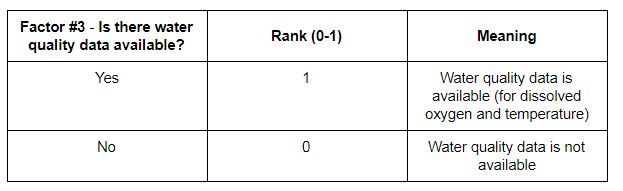
Normalizing the data
After the relevant factors were determined, they had to be normalized so that they could be compared in common units. This was done by attributing scores on a scale of 0-1, with 0 being bad and 1 good. The following is a summary of the normalization:
Weighting the factors
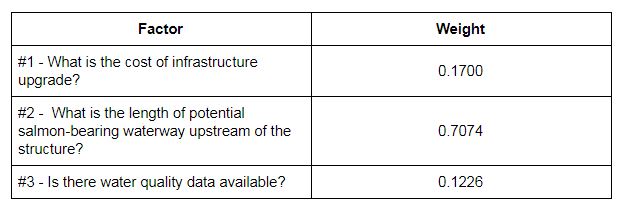
Evaluating the infrastructure