Relating Location Quotients to Today’s Pandemic in Montreal
By Jack Irwin
Abstract
Location quotients are often used in economics to compare local labor characteristics of a place with statewide characteristics. This study aims to apply location quotients to health geography and explore a potential relationship between place of employment and risk of exposure to the coronavirus in Montreal. Focusing on census tract data, the research leads to new ways of visualizing at-risk neighborhoods in both economic and health contexts. As the city of Montreal prepares to reopen markets and businesses, there are underlying considerations that may need to be reconsidered given the distribution of at-risk workers in Montreal.
Introduction
The coronavirus has disrupted the world economy and presented Canadians with new anxieties regarding the exponential growth of infectious diseases. In this study GIS is employed to explore how the impacts of the coronavirus could be felt differently throughout greater Montreal. Using labor data from the 2016 Census, the goal of this project is to explore how the possible spread of the virus through places of employment could affect neighborhoods differently. Certain places of employment are known to have higher exposure rates to diseases. If certain groups of employees that are at a higher risk of contracting the virus at their job are found to live in the same neighborhoods, then there are many implications for better combating the spread of the virus. First, this exploratory research proves useful for city health officials trying to better understand which neighborhoods are at higher risks. Second, essential businesses still operating in such high-risk neighborhoods could require more rigorous efforts to combat the spread of the virus. Local governments can also more efficiently allocate resources aimed at warning the public and slowing the spread in the areas that offer opportunities for public interaction within these high-risk neighborhoods.
Health care workers on the frontline of the pandemic today have the highest potential exposure to diseases of any type of labor. Beyond those working in hospitals, a recent article by Lazaro Gamino (2020) found every type of health care worker ranging from over twenty specific practices such as dentists, pharmacists, personal care aides, or even physical therapists, all ranked very high in their “exposure to disease” ratings and very high in their “proximity to others” ratings. These findings suggest health care workers are at the highest risk right now of contracting coronavirus. So, the first part of this project examines how health care workers are distributed throughout Montreal’s neighborhoods.
Next, this project explores the spatial distribution of the employees in the next two tiers of risk behind health care workers. According to Gamino (2020), the chart suggests the next major type of employee at risk of contracting the virus are teachers. The exposure chart places teachers that deal with younger students at higher risks than those dealing with secondary and post secondary school teachers, but all categories of educational employment are placed at the higher end of the chart (Gamino, 2002). Just below teachers, the next largest categories of employees include cashiers and retail workers (Gamino, 2002). So, this analysis will also explore the spatial distribution of retail employees throughout greater Montreal. Although, most retail salesmen are currently nonessential and may be out of work right now, an overview of the spatial distribution of these workers offers two potential insights. First, it shows where certain neighborhoods may proportionally take on more future unemployment than others. Second, it shows which neighborhoods may suffer disproportionately if quarantine measures were eased too early and people return to work only to contribute to a more severe second wave of the virus.
Finally, this project examines which neighborhoods were better economically and socially prepared going into this pandemic. The Canadian census contains data on people that work from home, and there appears to be a few census tracts in greater Montreal where a more significant proportion of the residents already worked from home.
Location quotients are used as a primary metric for comparison in the analysis. Location quotients are frequently used by economists as a metric that compares the rate of employment in a specific industry between local and national scales. In this analysis the location quotient is used to compare the rate of employment in an industry within a census tract and the rate of that employment in greater Montreal overall. A location quotient above one entails a rate of employment that is higher than the average rate in Montreal. As discussed, the different types of employment explored all present environments for workers with high potential exposure to disease and close proximity to people, with the exception of the dataset containing people that work from home.
Location quotients are not commonly used in health geography. Moineddin, Beyene, and Boyle (2003) note the location quotient metric “has applications in areas such as health care…. [but] has been used sparingly by health care researchers.” They primarily discuss how to go about calculating a confidence interval for location quotients, but also mention how location quotients can be applied in examining the utilization of health care services in Ontario with special attention on rheumatoid arthritis and data on visitations to rheumatologists (Moineddin et al., 2003). Health geographers in Thailand employed GIS and measured location quotients for five specific diseases to compare different localities with national rates (Keola et al., 2002). They were able to display the change in location quotients over five years of data for acute diarrhea, food poisoning, pneumonia, lung tuberculosis, and leptospirosis (Keola et al., 2002). Yorgos Photis (2016) examined the efficacy of the Greek Public Health Care System using GIS and location quotients and was able to observe areas where illness rates were higher than average and had lower than average supply of health care services. So, location quotients have been used in health geography, but Moineddin, Beyene, and Boyle would likely still note that there remains a shortcoming in the use of location quotients in health geography. Nevertheless, the coronavirus presents severe economic implications for specific jobs and poses different risks of spreading between workers of different occupations. This pandemic presents an opportunity to explore the risk of exposure to coronavirus by using GIS to map location quotients of different types of high-risk jobs as proxies for risk factors in census tracts throughout greater Montreal.
Methodology
In order to compare the employment characteristics of neighborhoods in greater Montreal, the location quotients for each type of employment were calculated for each census tract in greater Montreal. Census tracts are a justifiable proxy for neighborhoods as each generally has between 2,500 and 8,000 people according to Stats Canada.
First a shapefile containing all of Canada’s census tracts was downloaded. Then using the “Select by” feature in ArcMap 10.7.1 the census tracts containing “CMANAME” = “Montreal” were kept for the study area. After a feature class containing only Montreal’s census tracts was created, data regarding population, place of work, and type of employment were downloaded from CHASS using data from the 2016 census conducted by Statistics Canada. These datasets were all counts with associated census tract information and downloaded as text files and converted to an excel spreadsheet.
In the excel spreadsheet, totals for the counts of population, retail workers, health workers, education employees, and people that worked from home were calculated for all of the Montreal census tracts. Each total representing a count for greater Montreal was divided by the total population of Montreal to get a rate that would then be used as the denominator for calculating the location quotient of each metric for each census tract. To get the numerator for each location quotient the unique count of each type of employee in each census tract was divided by that census tract’s population. Now each numerator could be divided by its corresponding denominator to get a unique unitless location quotient for all census tracts. After all location quotients were calculated in excel, they were joined to the Montreal shapefile. Each map was then produced using a choropleth pattern using manual intervals. The number of health employee workers in each census tract were also joined to the Montreal shapefile so that a figure could be produced and compared to the location quotient map.
Additionally, the location quotients of retail, education and health workers were averaged for each census and joined to the census tract shapefile and presented in a map to highlight the potential risk tolerance of neighborhoods should businesses reopen too soon.
Discussion
No conclusive results can be drawn from this study, however using location quotient data may allow the city health officials of Montreal to understand new ways to view risk and better mitigate the spread of the virus. Infectious diseases are also not hindered by census tract boundaries, but census tract boundaries do provide a way to organize the people within Canadian cities. Nevertheless, each choropleth map displays data whereby darker shaded census tracts entail populations or location quotients representing proportions of workers at higher risks of exposure to the virus or economic decline. The combined results from each figure show that no neighborhood or census tract is entirely safe from the spread of this virus or the economic decline it may cause.
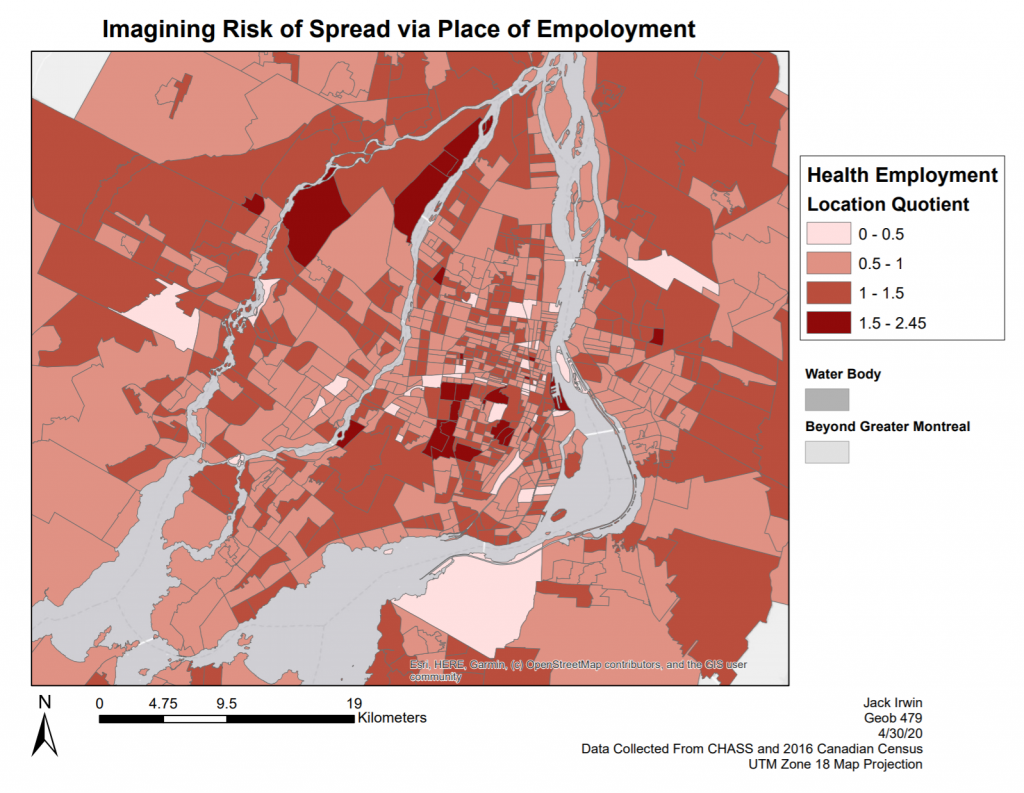
Figure 1.1 and Figure 1.2 display data regarding health employment, yet appear to show different results at first glance. Figure 1.1 shows the distribution of health employees per census tract. Interestingly, there is no distinct pattern and census tracts with over 230 health workers are often adjacent to census tracts with below 75 health workers. There appears to be only one cluster of roughly four census tracts with over 230 health workers in the entire figure. Figure 1.2 notably highlights this cluster and adds two census tracts just north of it, which highlights that there are more health workers in this region than average given the average health employment rate for greater Montreal. City officials may want to extend efforts to warn residents to say that local interactions in public spaces or neighborhood stores here come at a heightened risk of coming in contact with people that work more often in high-risk environments. Figure 1.2 highlights a region to the north of the center of the map in Laval, which was not previously highlighted by Figure 1.1. This area shows how location quotient data is proportionally representative and not directly representative of the populations of certain types of workers. This is not entirely problematic, and allows city officials in Laval to see that interactions between locals in these northern neighborhoods may come with a heightened risk of coming in contact with somebody who is more regularly exposed to environments with the virus. By viewing the potential for the spread of the virus through this perspective, it becomes clear that even areas thought to be more rural and out of sight can also experience heightened risks of catching the virus.
Figure 1.1
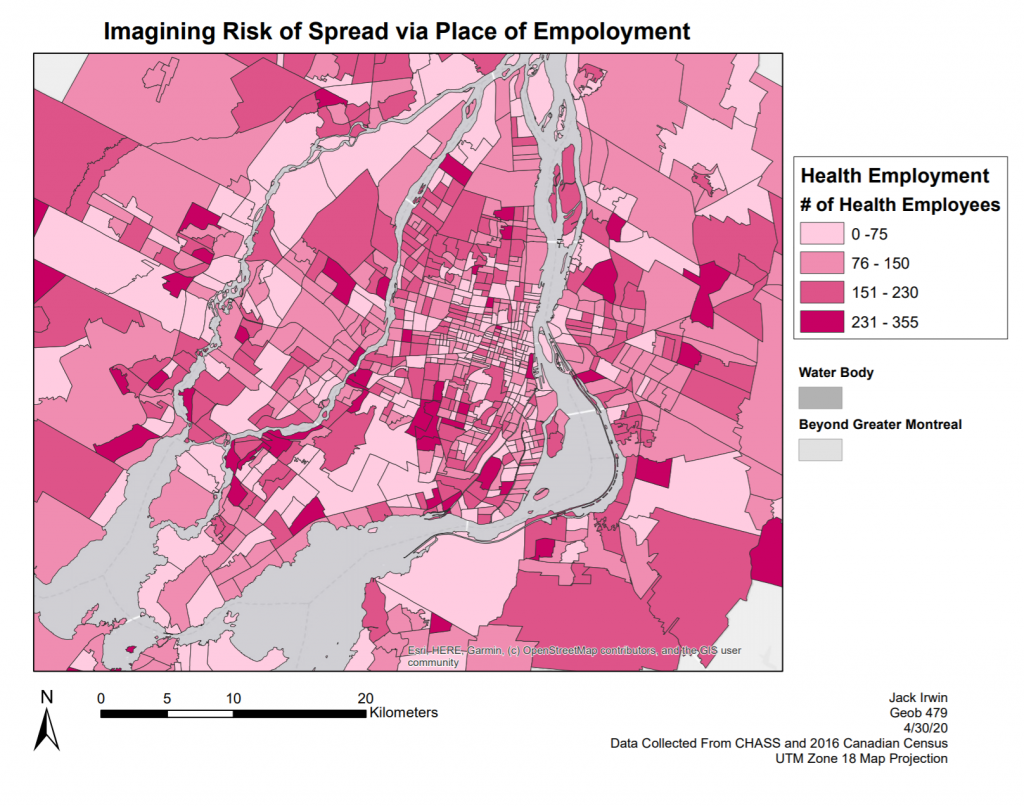
Figure 1.2
Next Figure 1.3 shows the location quotient distribution for retail employment in greater Montreal. Notably most peripheral census tracts of central Montreal along with a few pockets of census tracts within central Montreal show higher than average location quotients for retail employees. Figure 1.3 is unique from the other location quotient figures because only the darkest shaded census tracts represent a location quotient value over one. The maximum location quotient did not exceed 1.75. Today, retail employers have largely put business on hold, so this map better indicates the places in greater Montreal that are more likely to be disproportionately affected by more extended time off work. On the other hand, if greater Montreal reopens businesses too soon and a resurgence of the coronavirus ensues, then Figure 1.3 shows how the periphery of central Montreal is at a heightened risk of spreading the virus through their place of employment.
Figure 1.3
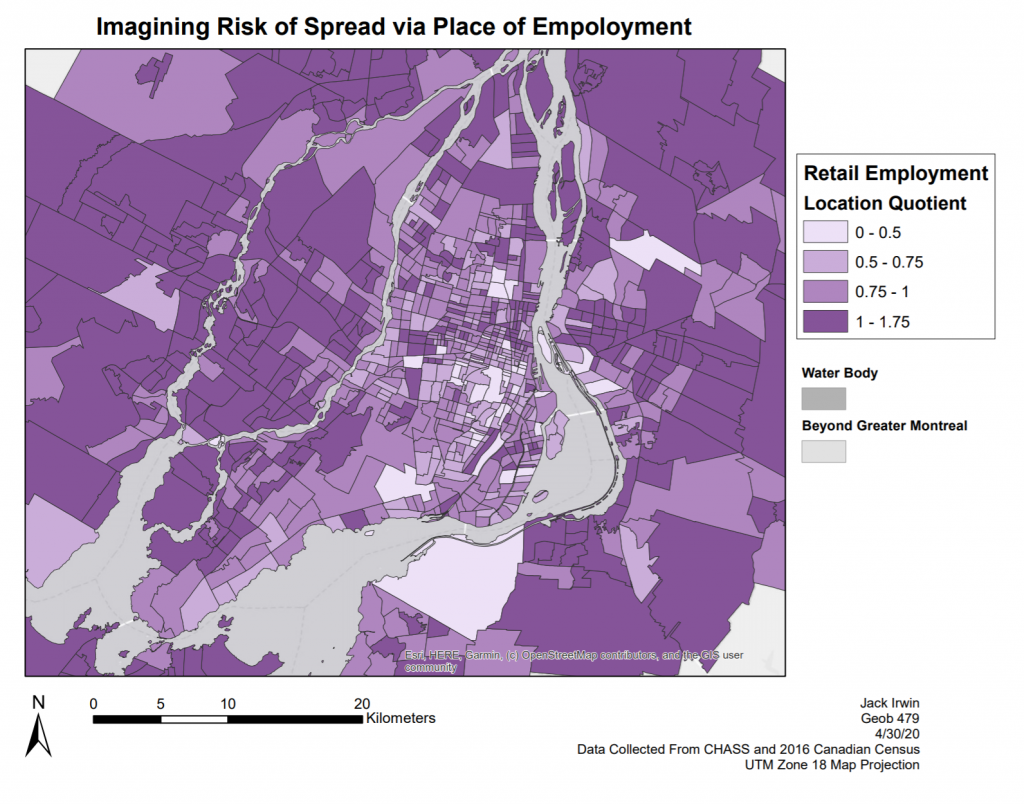
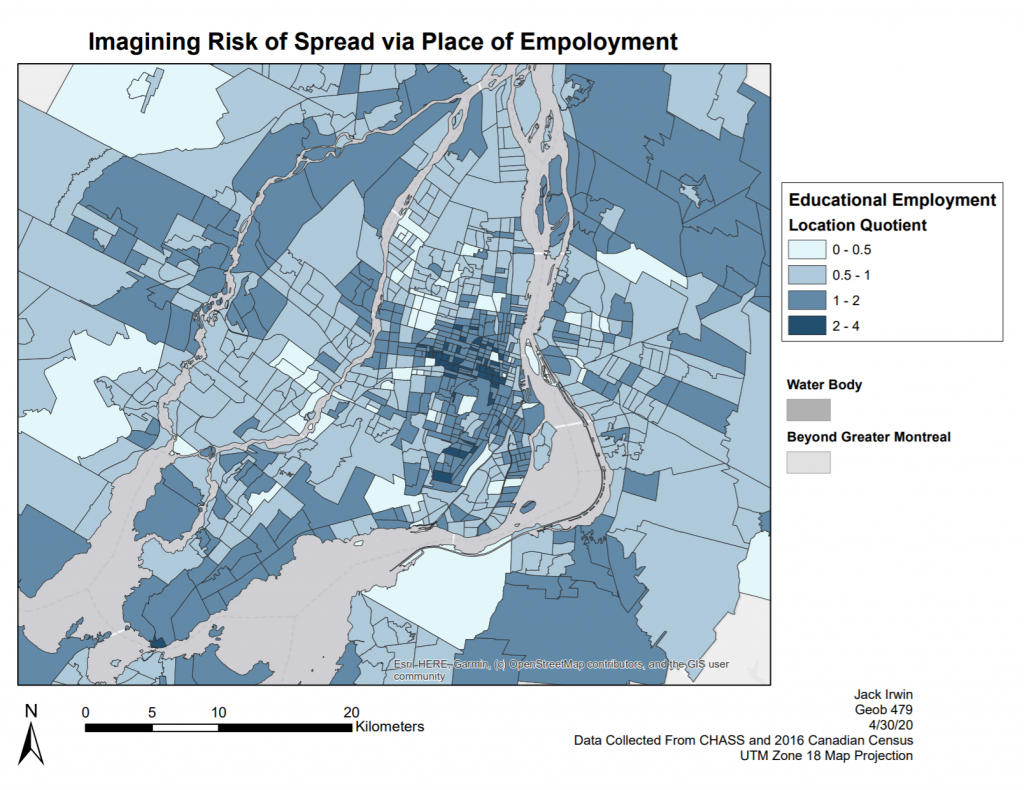
Figure 1.4 spatially contrasts Figure 1.3 and shows the highest location quotients for educational employees in census tracts towards the center of Montreal. However, reasonably above average location quotients are found in the periphery census tracts surrounding the city as well, and suggests that reopening school systems in the fall require careful judgement as these places of work and study are difficult to effectively maintain and reduce exposure. Mentioned previously, Gamino (2020) found that teachers of younger students are at greater exposure risks. Sadly, it is more difficult for kids to learn from online resources at younger ages than it is for older students. This presents an exceptional problem for school boards to consider. If school systems were reopened and a resurgence of the virus occurs in the fall, this map shows which census tracts may experience greater exposure to the virus.
Figure 1.4
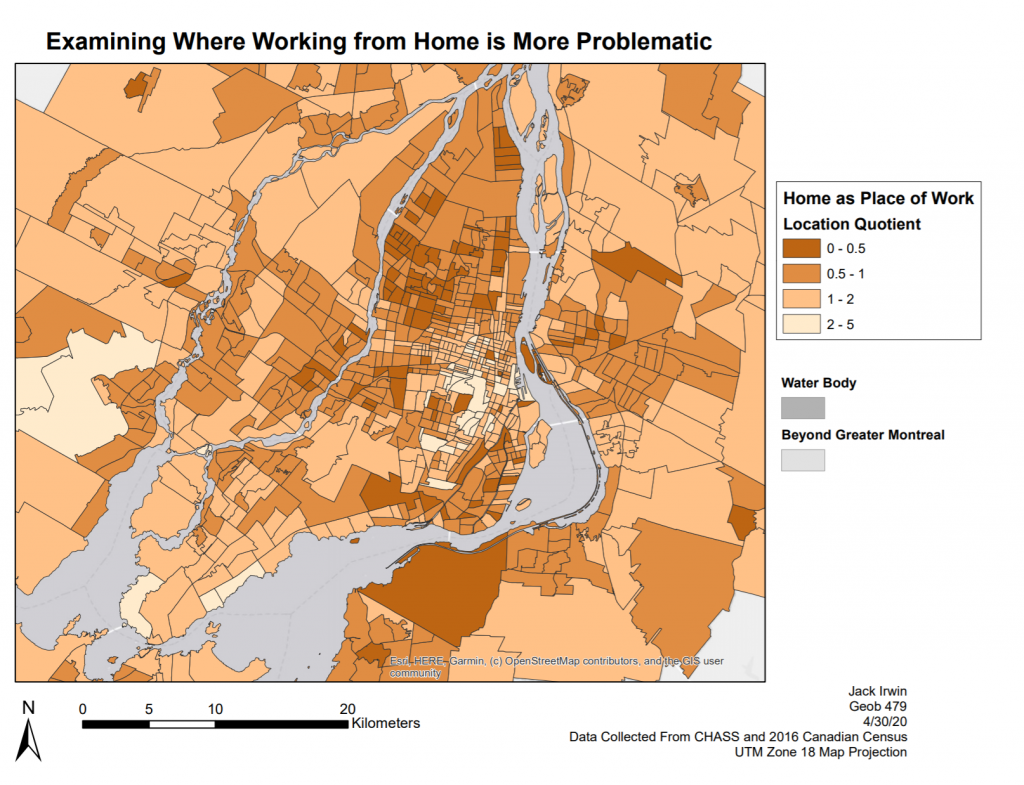
The pandemic has caused many workers to switch their place of work to their own homes if they can. The 2016 census does not provide data regarding the types of labor that can effectively make the switch to work-from-home, but does provide data regarding people that were already working from home. Figure 1.5 shows the location quotients of people working from home in each census tract. This choropleth map continues the theme of darker shaded census tracts as labelled higher risk, so census tracts with higher location quotients of people working from home are given a lighter tone. Notably only a few census tracts close to the city center had a high proportion of people working from home in 2016. It is difficult to say whether the census tracts shaded darker to the north of the city are at higher risks of economic decline because not enough information is known about whether people in these census tracts have the capability to still work from home given their occupation. With that said, this map helps to highlight a few pockets of greater Montreal that may have been better economically prepared heading into this pandemic.
Figure 1.5
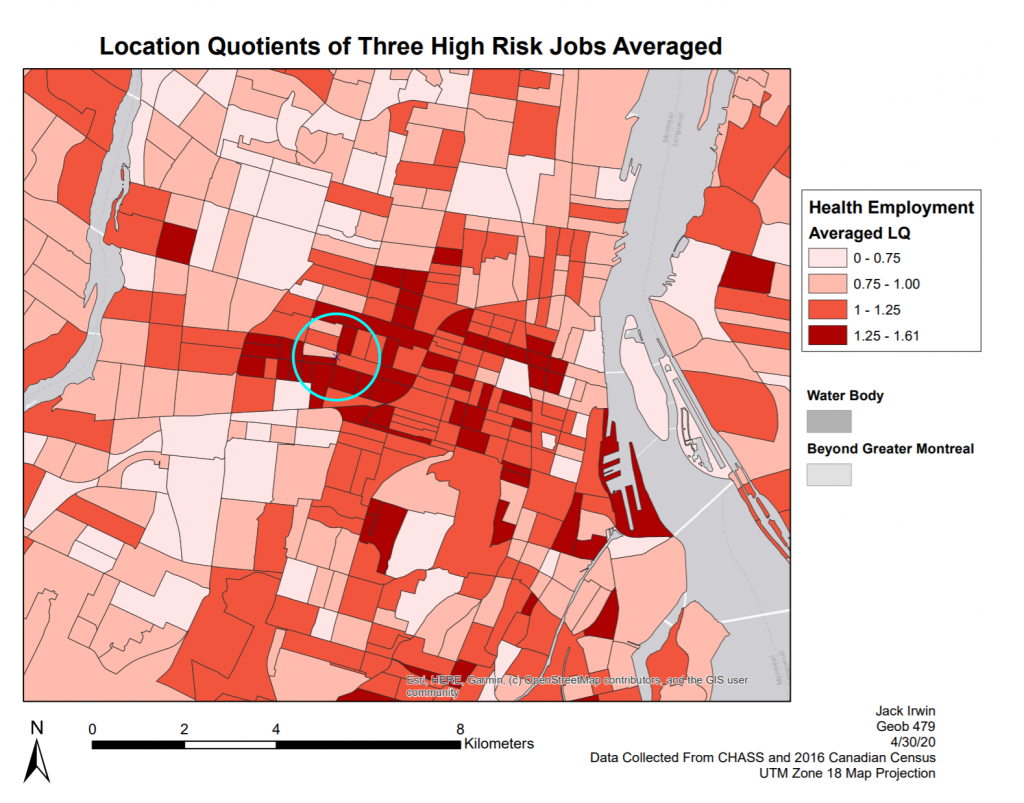
Finally, Figure 1.6 displays the averaged location quotients using the health, retail, and educational workers location quotients from each census tract. This map may prove especially useful in the future for city health officials to highlight regions of greater Montreal that are at greater risks of exposure in the case of a resurgence of the virus. If the economy begins to open back up with retail workers employed again and students attending schools by September, then the city should attempt to focus continued social distancing measures in these census tracts where an averaged location quotient of high-risk workers are greater than 1.25. Figure 1.6 shows the majority of these high-risk census tracts are in the center of the city, with roughly ten high-risk census tracts spread in the periphery of Montreal. City health officials can use this data to advise against areas prematurely opening back up with non-essential business.
Montreal is notorious for its local food markets, and as it stands right now, they plan to open the Jean – Talon Market this summer (Luft, 2020). Although the news reports claim they will limit car traffic to avoid crowds from gathering, reopening this market may only incite a resurgence of cases as Figure 1.7 shows the location of this market with roughly a one kilometer radius. Within this radius are roughly seven high-risk census tracts. I recommend the city take extreme precaution that goes beyond limiting cars to safely reopen a market in such an at-risk part of the city. Apparicio, Cloutier, and Shearmur (2007) found that food deserts in Montreal are not a major issue at all. So, if these markets are not entirely essential then opening them only increases risks to public health when crowding outside becomes an issue in the summer.
Figure 1.6
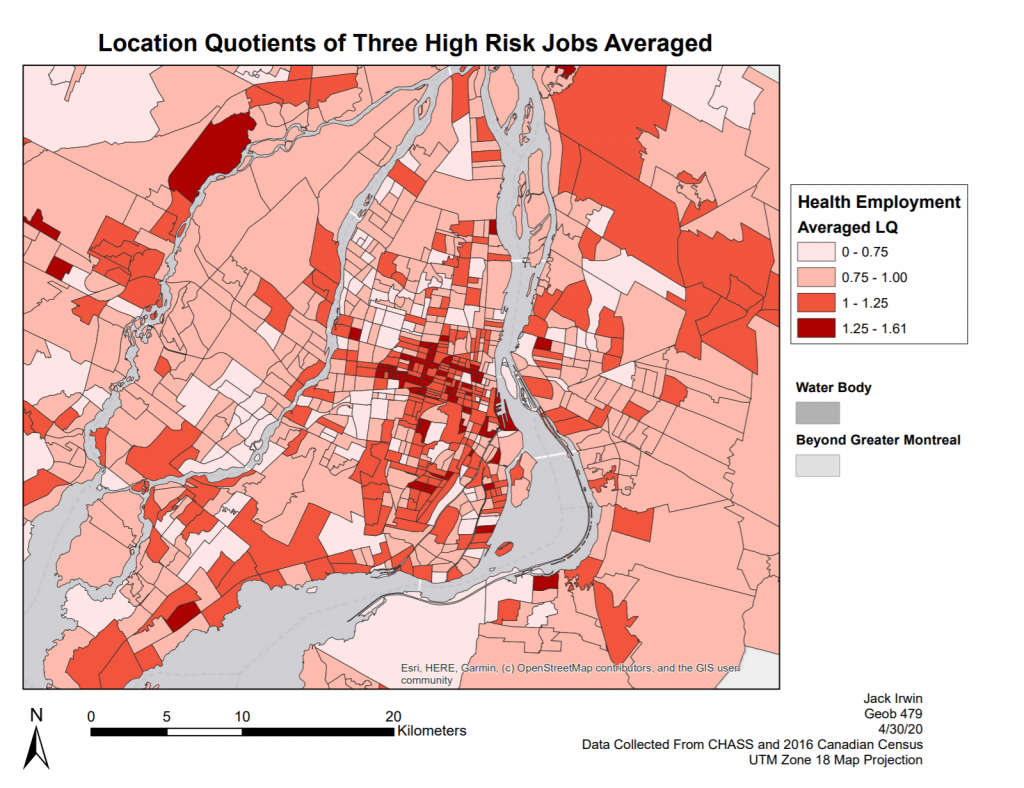
Figure 1.7
Constraints & Other Considerations
Considering this was an exploratory analysis of how location quotients can be used to better understand the varying exposure risks of coronavirus between census tracts, there are certainly many limitations. Only 25% of the people in each census tract were surveyed about their places of employment and the data is four years old, so each census tract has some degree of uncertainty about the actual rates of employment from each sector. As mentioned, infectious diseases also do not abide by invisible borders. So, census tracts displaying low location quotients for high-risk workers that are directly adjacent to census tracts with high location quotients implies that the risks are more realistically higher for those residents. This is related to the modifiable areal unit problem, and if the census tracts were instead agglomerated or drawn differently than this analysis would yield different results.
A major variable to also consider is that high rates of exposure to diseases at places of work may not necessarily entail high rates of spreading the diseases in places around the homes of those workers. For example, although people that work in hospitals are more likely to be exposed to the coronavirus, they are also the most prepared of all workers and likely take extra precautionary measures. So, conducting a new study based on actual rates of types of workers that are likely to spread diseases would be interesting, but data has yet to be available.
Another future study that is more in line with the work presented here could focus on the locations of grocery stores, gas stations, and other essential businesses. Based on the occupations of the surrounding population, a grocery store in one neighborhood may be a more likely site than others to have been exposed to the virus.
Conclusion
The goal of this exploratory analysis was to connect economic data and methods of evaluating spaces with the location quotient metric and connect these concepts to today’s pandemic. Some scholars have noted an academic gap in utilizing location quotients in health geography, so this study partially aimed to address this gap (Mouneddin et al., 2003). Montreal is a forward-thinking city and city health officials there may be looking for new ways to visualize the spread and possible resurgence in order to plan future mitigation. I urge the city to reconsider opening the Jean – Talon Market this summer, as this popular destination in Little Italy is surrounded by workers that have jobs that likely expose them to disease and the virus. More GIS analyses regarding essential businesses and the exposure risks they face are advised for future research.
Work Cited
Apparicio, P., Cloutier, M., & Shearmur, R. (2007). The case of montréal’s missing food deserts: Evaluation of accessibility to food supermarkets. International Journal of Health Geographics, 6(1), 4-4. doi:10.1186/1476-072X-6-4
Gamio, L., (2020, March 15). The workers who face the greatest coronavirus risk. New York Times. Retrieved from
https://www.nytimes.com/interactive/2020/03/15/business/economy/coronavirus-worker-risk.html
Keola, S., Tokunaga, M., Tripathi, N. K., & Wisa, W. (2002). Spatial surveillance of epidemiological disease: a case study in Ayutthaya province, Thailand. GIS@ development. Retrieved from https://www.researchgate.net/profile/Wisa_Wisesjindawat/publication/261722390_GISdevelopment_Spatial_Surveillance_of_Epidemiological_Disease_A_Case_Study_in_Ayutthaya_Province_Thailand/links/0046353552dbe5708c000000/GISdevelopment-Spatial-Surveillance-of-Epidemiological-Disease-A-Case-Study-in-Ayutthaya-Province-Thailand.pdf
Luft, A., (2020, April 29). Car traffic will be limited at Jean-Talon Market this summer to avoid crowds. CTV News. Retrieved from
Moineddin, R., Beyene, J., & Boyle, E. (2003). On the location quotient confidence interval. Geographical Analysis, 35(3), 249-256. doi:10.1111/j.1538-4632.2003.tb01112.xPhotis, Y. N. (2016). Disease and health care geographies: Mapping trends and patterns in a GIS. Health Science Journal, 10(3), 1.