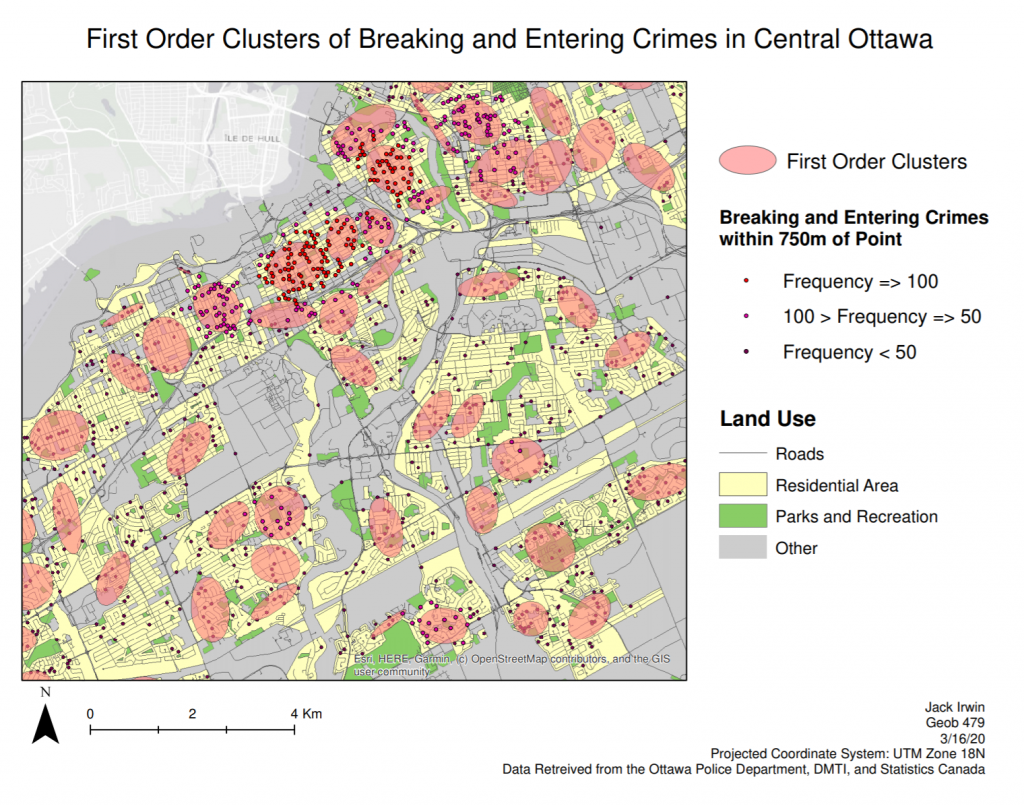
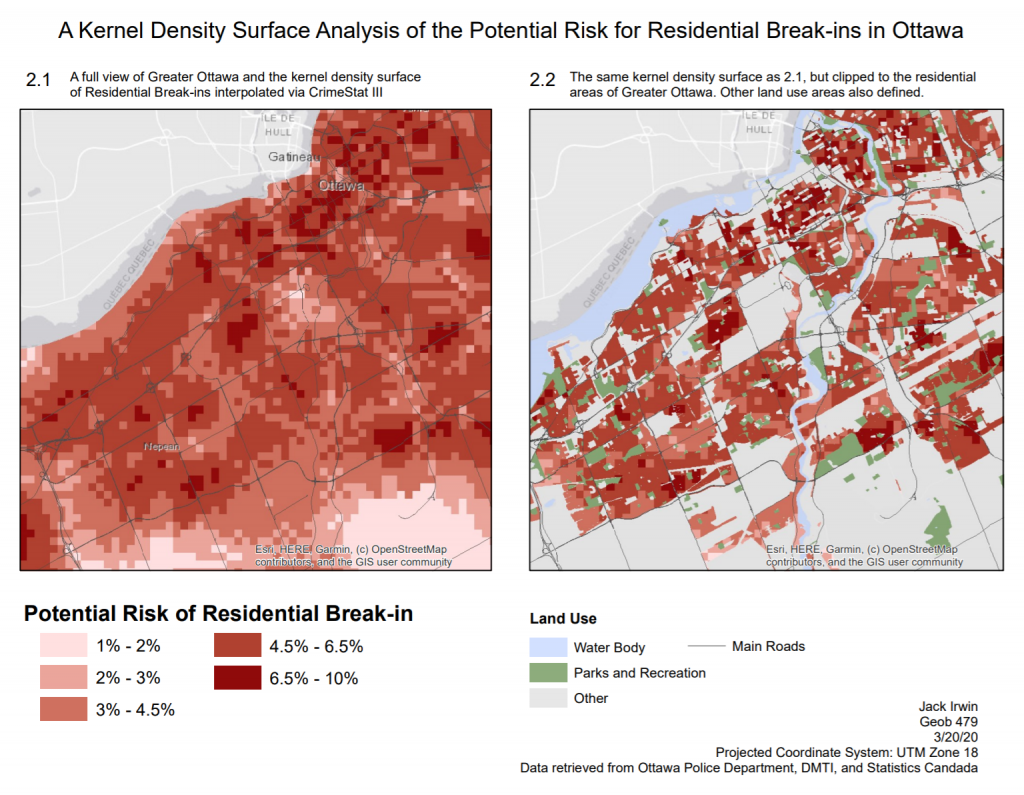
Lab 3 – Using Crimestat to Analyze Crimes in Ottawa
In this lab we use Crimestat sofware to analyze the frequency of breaking and entering crimes in Ottawa. Attached below are two maps produced. The first emphasizes first order clusters. The next gives a kernel density profile of residential break-in crime in central Ottawa. Figure 2.1 is an overall view of Ottawa, while figure 2.2 clips the density profile to residential areas in central Ottawa.
Attached below is an (incomplete) lab report.
Lab 2 – Geographically Weighted Analysis
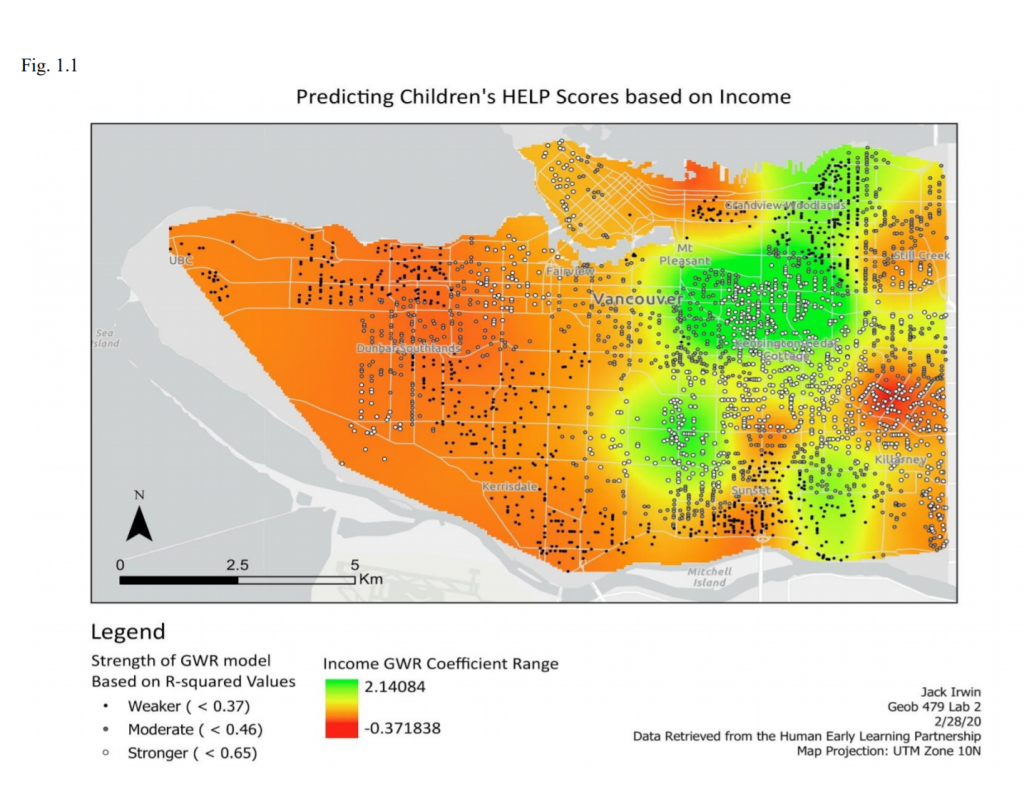
In this lab we conduct a geographically weighted regression analysis to determine
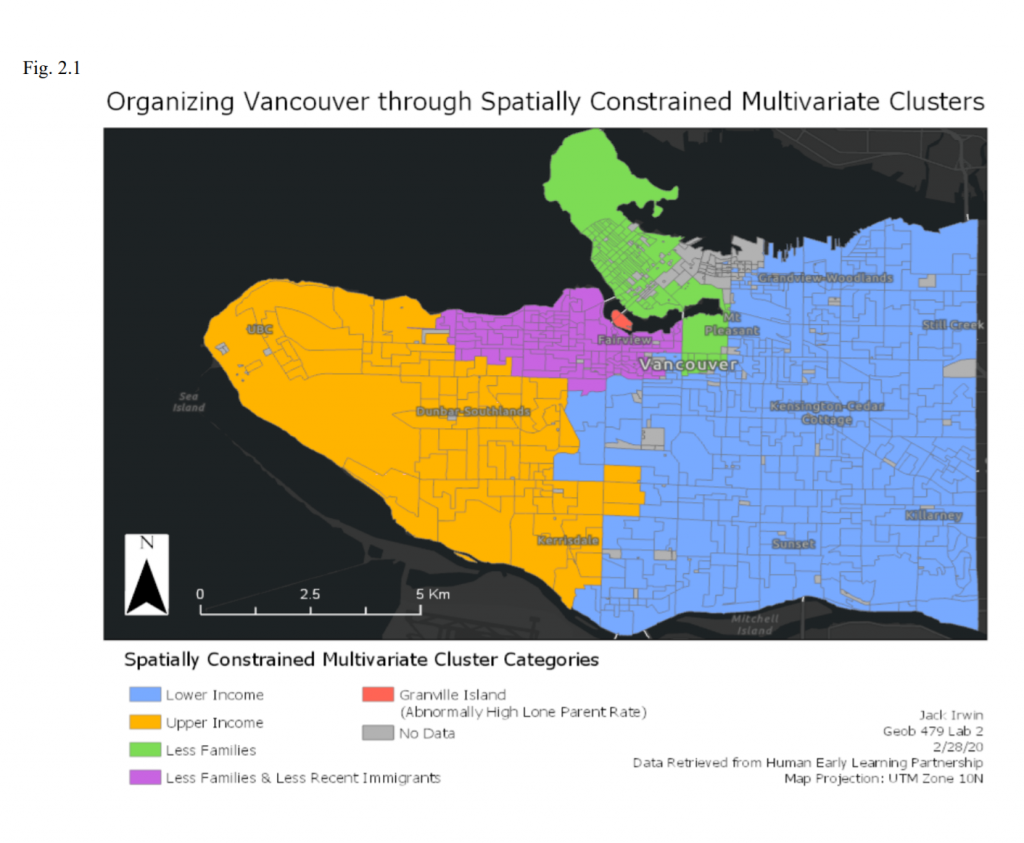
how a child’s language abilities in Vancouver are affected by different variables measured by the Human Early Learning Partnership. The results are compared with an ordinary least-squared regression analysis. Additionally, spatially constrained multivariate clusters are constructed to show how regions within a city often exhibit similar trends. Attached below is the full lab report.
Lab2GeographicallyWeightedRegression
Below are two maps I produced in this lab. The first shows a geographically weighted regression model that calculated a raster profile representing the strength of the relationship between income and a child’s language abilities. The second map shows how spatially constrained multivariate clustering organizes Vancouver based on input data from categories like income, family of 4 households, single-parent family households, recent immigration, and child care. The groups are defined by the categories that were most outstanding in the box-plots shown in the lab report above.
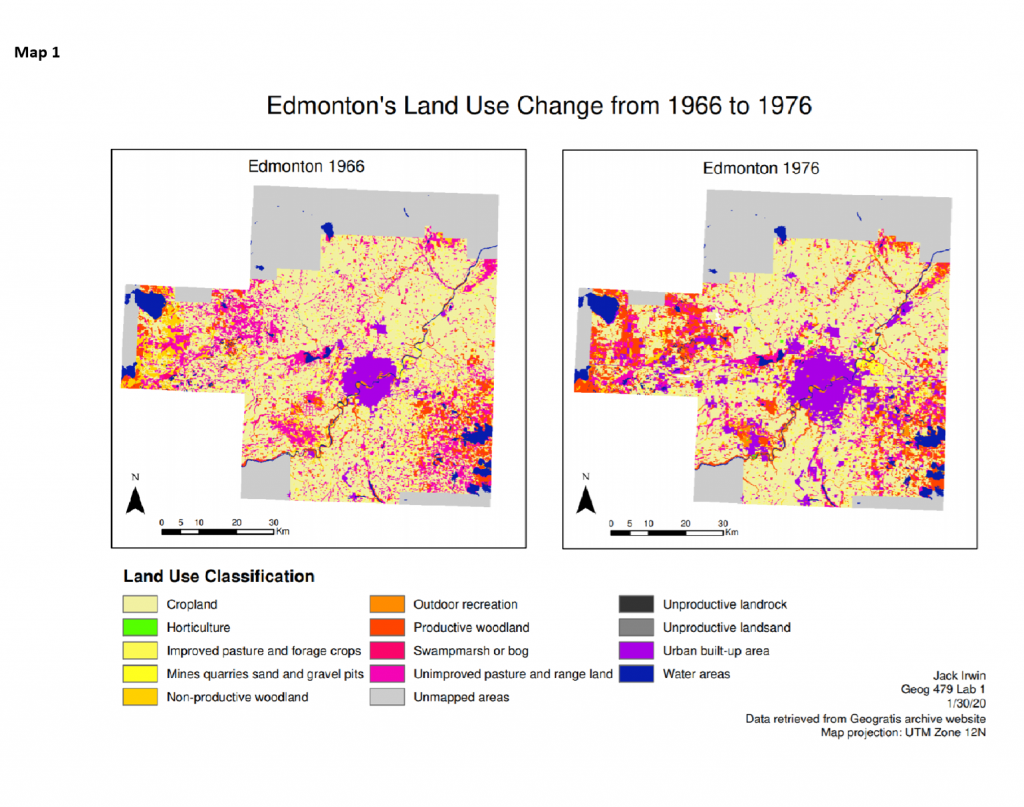
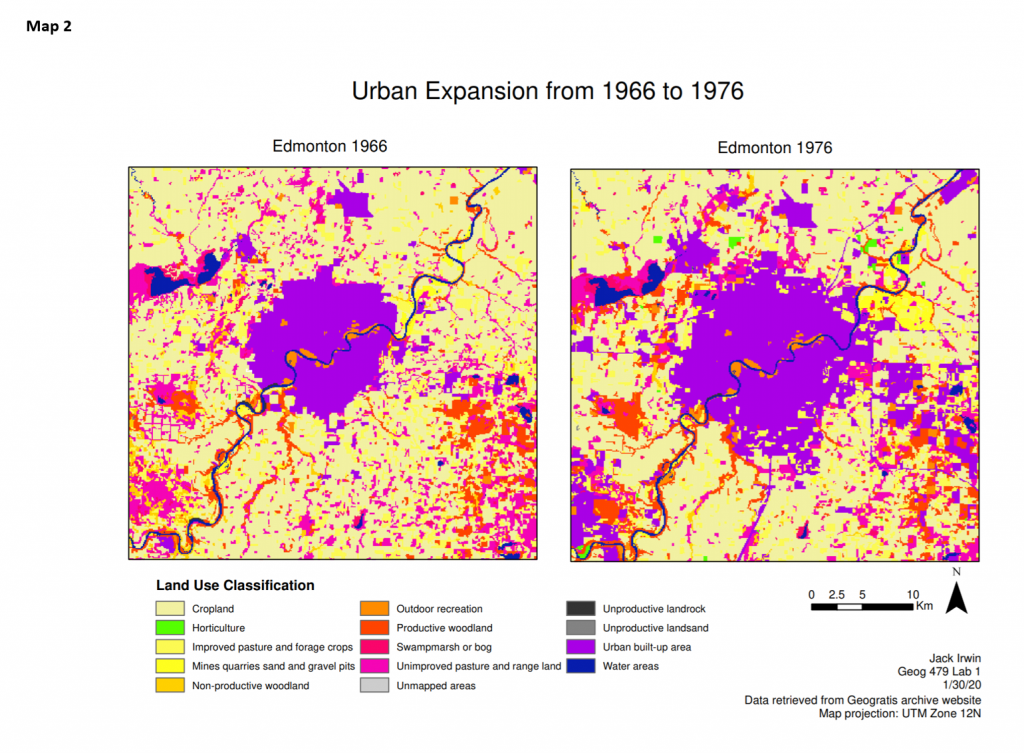
Lab 1 – Examining Land Use Change with Fragstats
In this first lab we use fragstats to examine historical land use data from greater Edmonton during the years 1966 and 1976. In this lab I relate the trend of homogenization of Greater Edmonton to the urban expansion experienced in this decade. Attached below is the full lab report.
Below are maps I produced of the land use change from 1966 to 1976. Map 1 compares the entire study area of greater Edmonton and Map 2 focuses on the urban expansion Edmonton experienced in the decade.