In this lab I used IDRISI software to process images of Central Massachusetts in 1986 and 1994 and analyze the land cover changes that resulted between those two years. See table and images below for results of the land cover changes:
| Land Cover Type | Net Change (km2) |
| Mixed Forest | – 125.72 (loss) |
| Deciduous Forest | – 65.51 (loss) |
| Open Land | + 10.51 (gain) |
| Pasture | – 30.75 (loss) |
| Cropland | – 56.42 (loss) |
| Barren/Waste Disposal/Mining | – 10.25 (loss) |
| Other Urban | + 9.56 (gain) |
| Residential (>2 acre) | + 159.04 (gain) |
| Residential (<2 acre + multi-family) | + 86.28 (gain) |
| Industrial/Commercial | + 30.04 (gain) |
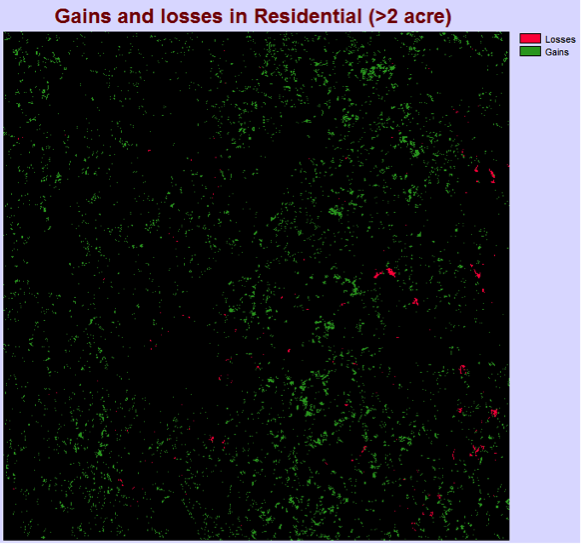
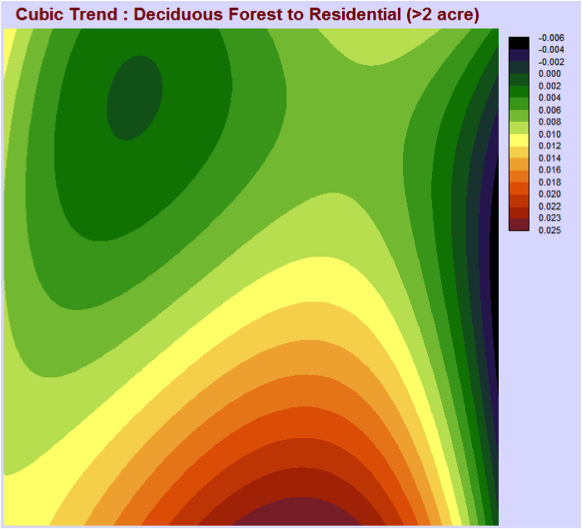
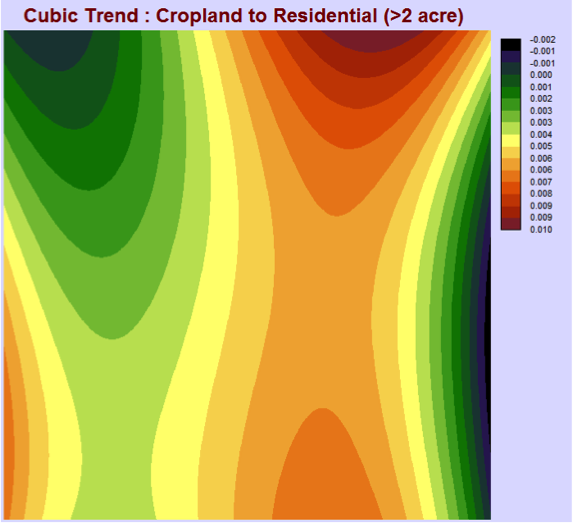
Between the years of 1986 and 1994 the Central Massachusetts area mostly gained in the residential (>2 acre) land cover. The largest gains in the residential (>2 acre) occurred in the north to south strip of land, slightly to the east of the observed area. Also some significant gains can be seen in the southwest corner of the area. Most of the losses for this area are on the very eastern side with a bit of losses, but mostly no change found slightly west of the strip of gains. After observing the contributors to net change in residential (>2 acres) graph, the three major contributing land covers are deciduous forest, mixed forest and cropland.
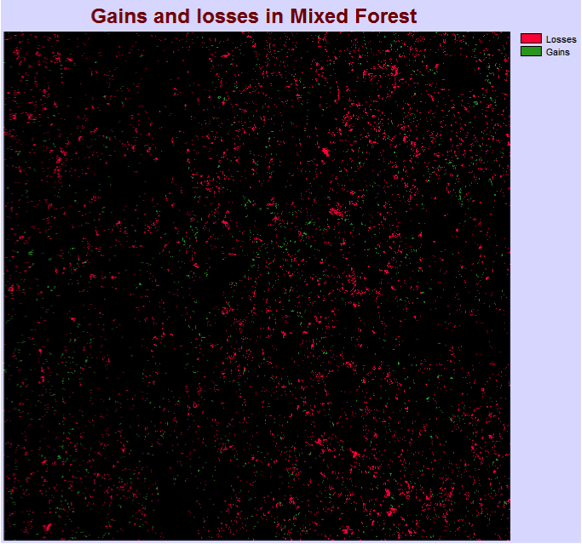
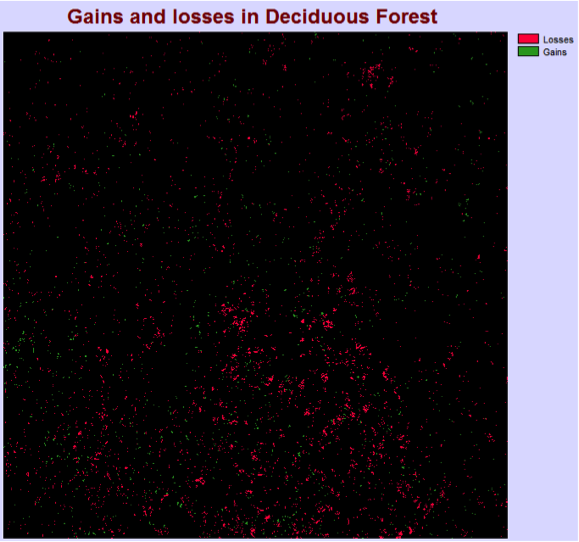
From the map above depicting gains and losses in the deciduous forest land cover it can be seen that this land cover had a net loss of area. Most of the losses are concentrated in the southern part and the trend for gains is very spread out and hard to identify. A net loss can also be observed in the mixed forest area with most of it occurring in the southeast and northeast parts. Some of the gains seem to be more concentrated in the very central and southwest areas.
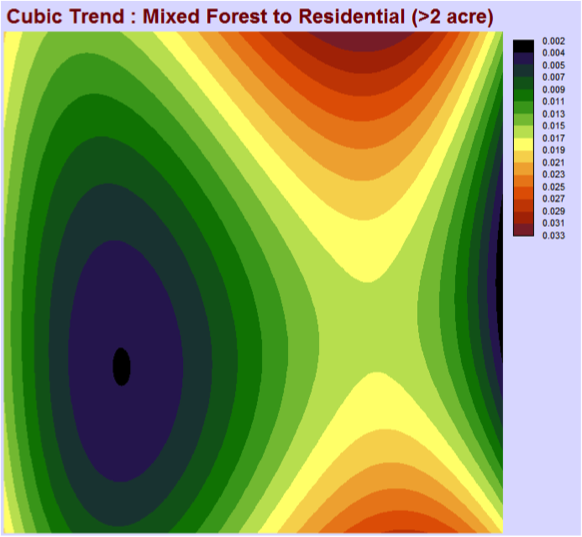
After constructing the cubic trend maps that depict the changes from deciduous forest, mixed forest and cropland to residential (>2 acre) we can observe which areas and land covers contributed the most to a net gain in the residential (>2 acre). The major contribution from the deciduous forest occurs in the south, which corresponds both to the major losses cluster in deciduous forest and a gains cluster in the residential as discussed above. A similar correspondence can be seen from the mixed forest trend that contributed the most in the south and north east areas and is reflected in the gains and losses for mixed forest and residential. The cropland land cover contributed to residential (>2 acre) the most in the south to north stretch of land with most change occurring at the extremes and some in the southwest.
If all three cubic trend maps of deciduous forest, mixed forest and cropland were combined together to form one, it would mirror the gains distribution of residential (>2 acre). Therefore from our analysis we can conclude that the gains in residential (>2 acre) came from the deciduous forest, mixed forest and cropland land covers, which is consistent with the graph of contributors to net change in residential (>2 acre). Also, most of the losses in the deciduous and mixed forest land covers were due to residential development that created gains in the residential (>2 acre) land cover.
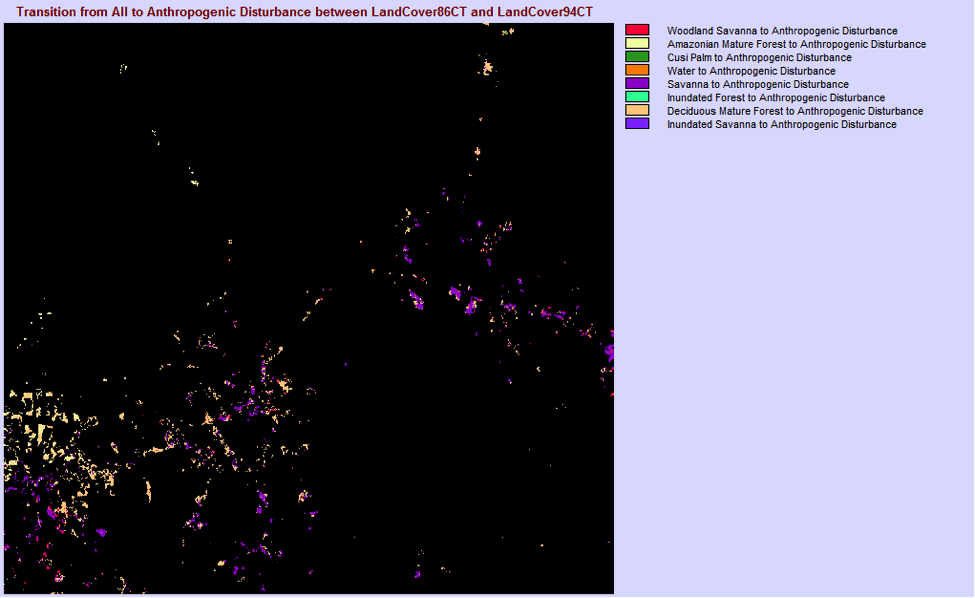
- 365.6 km2 have been lost to anthropogenic disturbance between 1986 and 1994.
- 16249 cells out of 911001 total cells lost to anthropogenic disturbance is 1.78% of the total area of the image.
- The four major land cover classes that are being converted to anthropogenic disturbance are:
- Deciduous Mature Forest – 196.99 km2 lost
- Savanna – 113.78 km2 lost
- Amazonian Mature Forest – 32.00 km2 lost
- Woodland Savanna – 18.97 km2 lost
- The legend classes in the ungeneralized map are:
- Woodland Savanna to Anthropogenic Disturbance
- Amazonian Mature Forest to Anthropogenic Disturbance
- Cusi Palm to Anthropogenic Disturbance
- Water to Anthropogenic Disturbance
- Savanna to Anthropogenic Disturbance
- Deciduous Mature Forest to Anthropogenic Disturbance
- Inundated Savanna to Anthropogenic Disturbance
- The legend classes in the generalized map are:
- Woodland Savanna to Anthropogenic Disturbance
- Amazonian Mature Forest to Anthropogenic Disturbance
- Savanna to Anthropogenic Disturbance
- Deciduous Mature Forest to Anthropogenic Disturbance
These results are expected because when examining the change analysis graph it is clearly visible that only 4 classes significantly decrease and 1 significantly increases. The total area of changes that have been emitted in the second generalized map are 3.87 km2 or 387 ha.
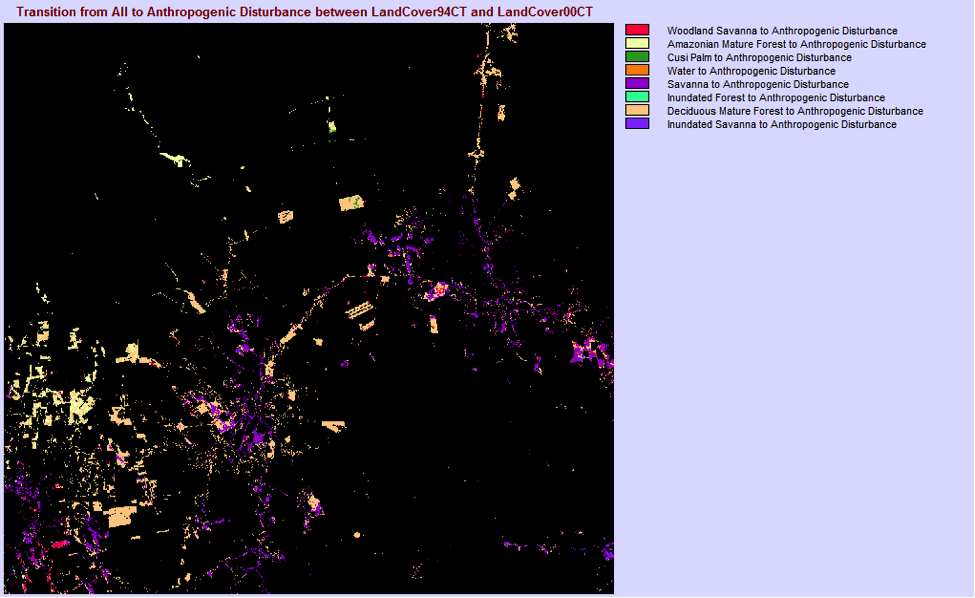
After doing the same analysis for images of the same region between the years of 1994 and 2000 the below results were found:
- 948.89 km2 have been lost to anthropogenic disturbance between 1994 and 2000.
- 42173 cells out of 911001 total cells lost to anthropogenic disturbance is 4.63% of the total area of the image
| Area lost to anthropogenic disturbance | ||
| Major Land Cover Classes | From 1986 to 1994 (km2) | From 1994 to 2000 (km2) |
| Deciduous Mature Forest | 196.99 | 517.16 |
| Savanna | 113.78 | 234.65 |
| Amazonian Mature Forest | 32.00 | 104.22 |
| Woodland Savanna | 18.97 | 48.31 |
| Area lost to anthropogenic disturbance | ||
| Other Land Cover Classes | From 1986 to 1994 (km2) | From 1994 to 2000 (km2) |
| Inundated Savanna | 1.17 | 11.7 |
| Inundated Forest | 0 | 1.03 |
| Water | 2.09 | 6.55 |
| Cusi Palm | 0.61 | 4.54 |
Some of the most notable differences that occurred in the transitions between the two sets of years is that the anthropogenic disturbances land cover increased due to losses in other land covers at least twice as much between the 6 year period from 1994 to 2000 than over the 8 year period from 1986 to 1994. From these changes we can see the rapid expansion of human developments.
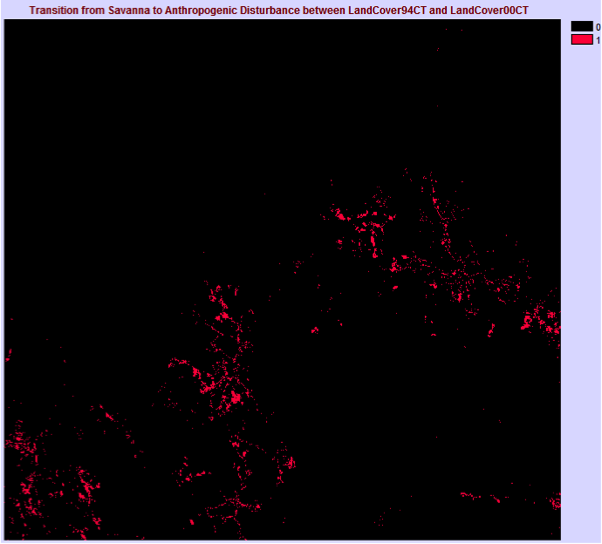
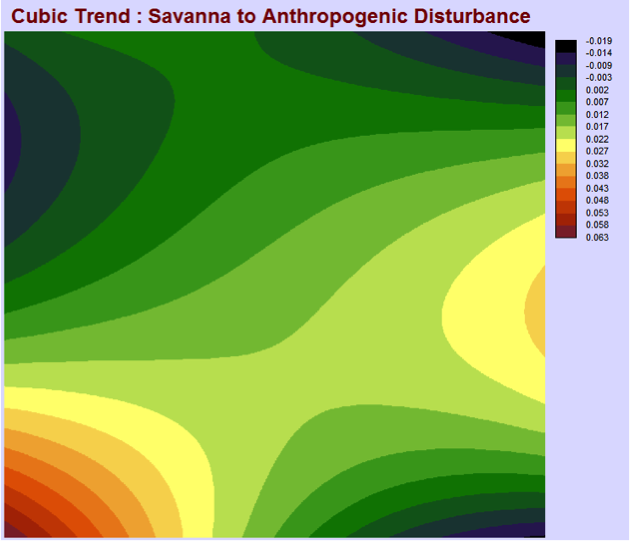
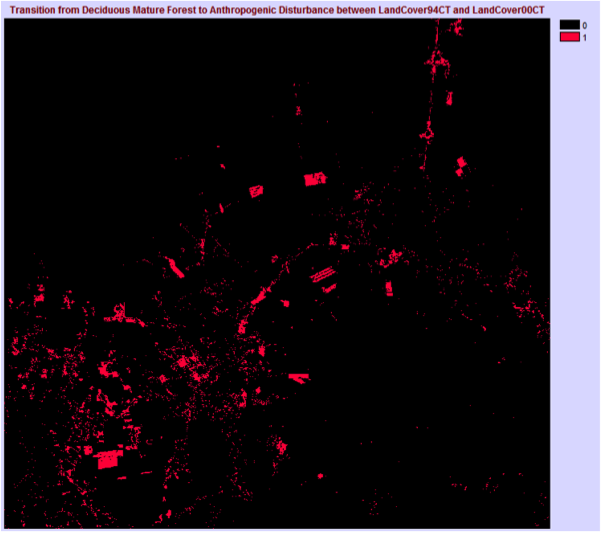
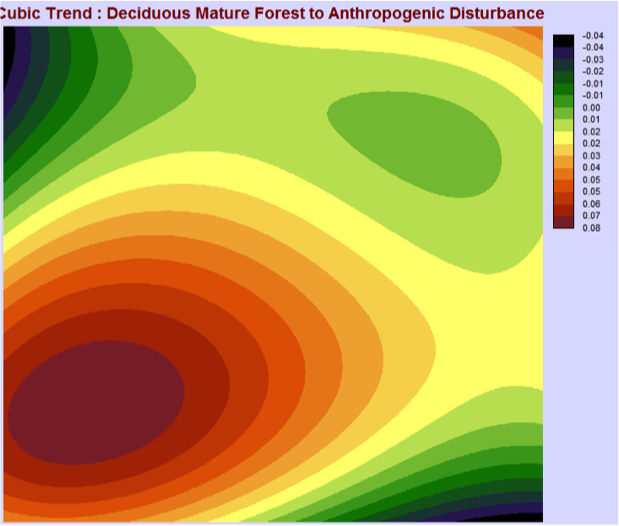
The maps above represent losses in a certain land cover to anthropogenic disturbance between the years of 1994 and 2000 and the associated cubic trends.
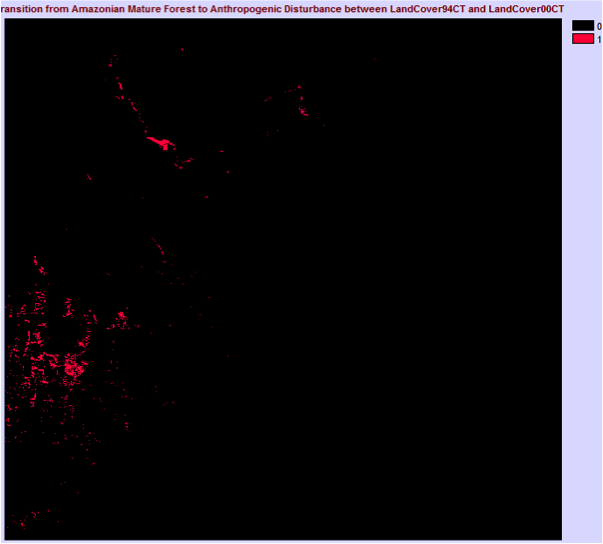
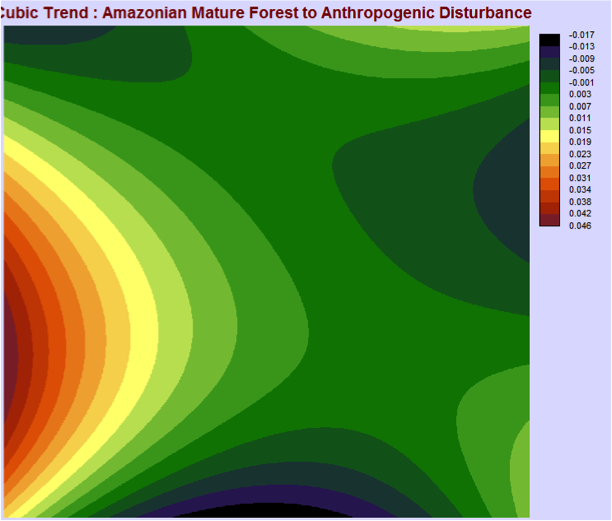
The first map depicts the transition of savanna to anthropogenic disturbance between 1994 and 2000. Major losses to the savanna land cover can be seen in the southwest and east parts of the area. These losses are also reflected in the cubic trend. The map depicting the transition of deciduous mature forest to anthropogenic disturbance reflects losses to the forest land cover from the most southwest part to the northeast, with the most change happening in the southwest. The cubic trend reflects the dramatic change in the southwest, but does not really extend to the northeast. The transition from Amazonian mature forest to anthropogenic disturbance shows losses in the forest cover mainly in the west part of the area. The cubic trend also shows the greatest change in the west with little to no change at all in other areas.
After examining the cubic trends for all three land covers it is evident that most of the changes to anthropogenic disturbance happened in the southeast. This reflects the development and expansion of the city between 1994 and 2000 at the expense of the savanna, Amazonian mature forest and deciduous mature forest land covers.
From the map depicting the losses in deciduous mature forest to anthropogenic disturbance certain spatial development trends can be recognized. After closely examining the map it is evident that deciduous mature forest has been cut down in the northeast part of the area to be replaced by a road. In the same map, the clearly outlined blocks of deciduous forest loss must have been lost to such anthropogenic activities as logging or forest clearing for farming or agriculture.
In the maps that portray the losses of the savanna and Amazonian mature forest land cover types to anthropogenic disturbance, the nature of the anthropogenic disturbance is not as clear as in the deciduous mature forest losses. However, since most changes happen around the core of the city, they are most likely the development of human settlements and the expansion of the city boundaries. Combining these maps with the losses in the deciduous mature forest land cover it can be seen that the supposedly human settlements are mostly clustered around what we determined to be a road as mentioned above.