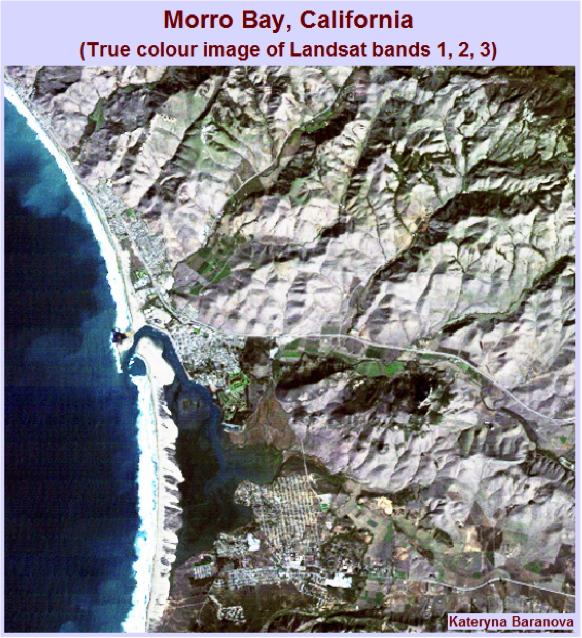
In the ocean areas of morr123, vertical striping can be detected. The composite image is 24 bits because the data type of each of the original bands is byte = 8 bits. It does not make sense for the composite image to be 16 bits, because it is composed of 3 channels.
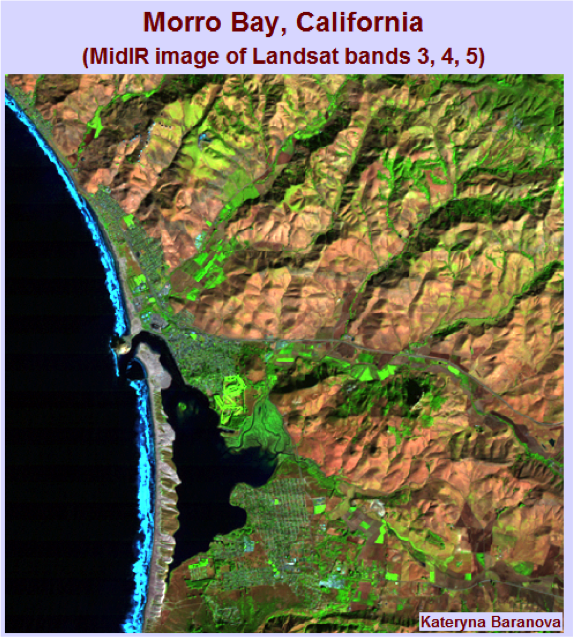
The morr345 image is the “most informative” in terms of vegetation greenness, brightness and moisture content because it uses bands 3, 4 and 5. Band 5 is the best at indicating vegetation and soil moisture and band 4 is most useful for determining biomass content, delineating water bodies and soil moisture. The true colour image is composed of bands 1, 2 and 3 which do not capture soil or vegetation moisture, but are useful for coastal water mapping and vegetation and cultural feature identification. The false colour image is composed of bands 2, 3 and 4 which capture some soil moisture, but the spectral resolution of the image is not very high. For a dry and mountainous area as the Morro Bay, the MidIR image proves to be the “most informative”.
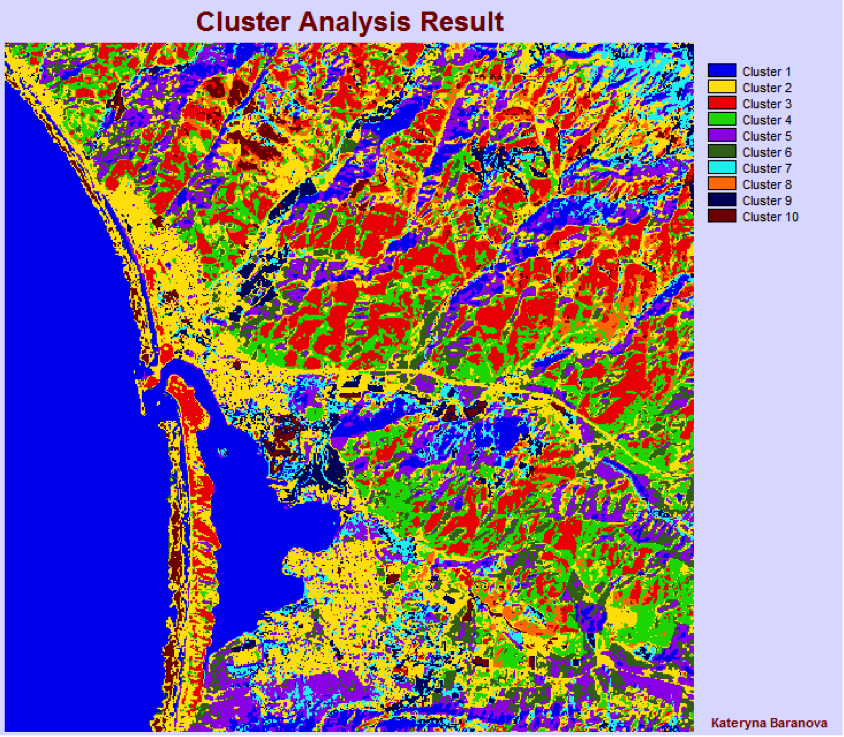
Only the first ten classes appear to be relevant because they contain more than 2,600 pixels each.
Cluster 1 – Water/moisture
Cluster 2 – Sand/Urban
Cluster 3 – Highlands
Cluster 4 – Slopes
Cluster 5 – Valleys
Cluster 6 – Dirt
Cluster 7 – Lowlands
Cluster 8 – Hill ridges
Cluster 9 – Vegetation
Cluster 10 – Vegetation/slopes
The classified image allows distinguishing most of the major features as in the true colour image. The spectral resolution of the images is very different and the true colour image contains much more detail. In the classified image some features are grouped together so it is hard to distinguish between some of them. From both of the images you can get a general understanding of the relief. However if you are unfamiliar with the area it will be very hard to interpret the classified image.
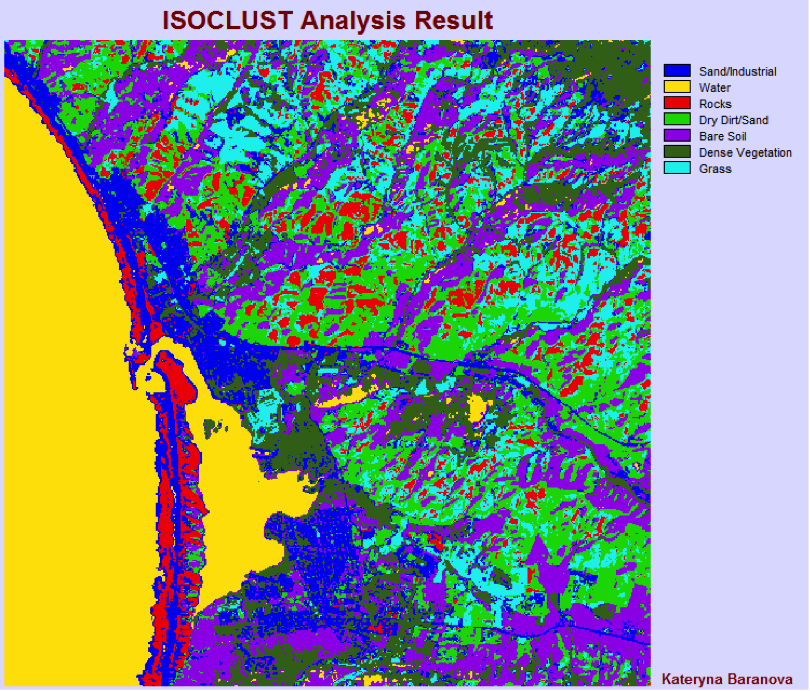
The dark blue colour appears in the near shore areas as well as the city, so it most likely representing sand/industrial. The ocean and bay are yellow, so that cluster must represent water bodies. Red is found on the long strip of beach as well as further inland and comparing the areas with google maps, it seems to represent pebbles/rock. The bright green is found inland where on google maps there seems to be very dry soil, desert like type land, so I classified it as dry dirt/sand. The purple cluster appears around the city and roads and also further inland, there are no special features to be observed in those areas, so I concluded it is most likely just bare soil. Dark green appears where there is forest, so it must represent vegetation. The light blue appears in sparsely vegetated areas and looks like it represents grass.
In the Isoclast analysis image, features are easier to identify than those in the cluster analysis. The Cluster analysis seems very chaotic and hard to understand in comparison. Therefore I feel like the Isoclust routine provides the best output.