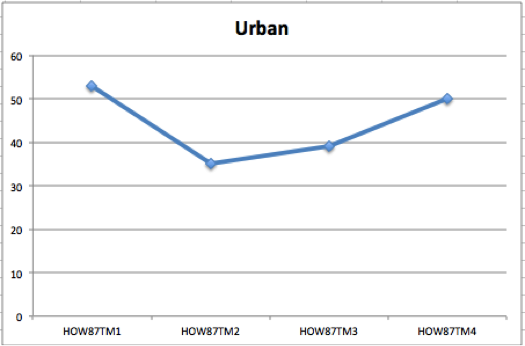
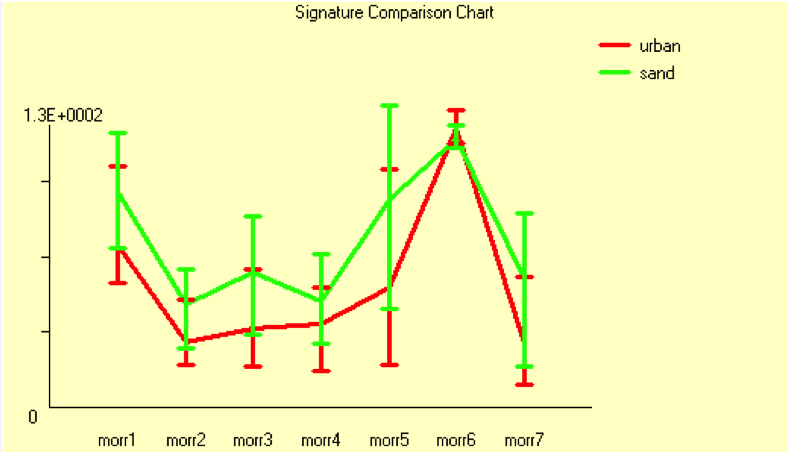
- The band values of urban and sand are very similar, however those of sand are consistently slightly higher than the respective band values of urban in all but one band. In the Thermal IR band, the value for urban is slightly greater than that of sand. As the error bars overlap for all the bands, these distinctions are not of significant enough value.
- The sand reflectance curve has slightly less overall variability between the bands than urban. Both reflectance curves have high value variability between Mid IR and Thermal IR.
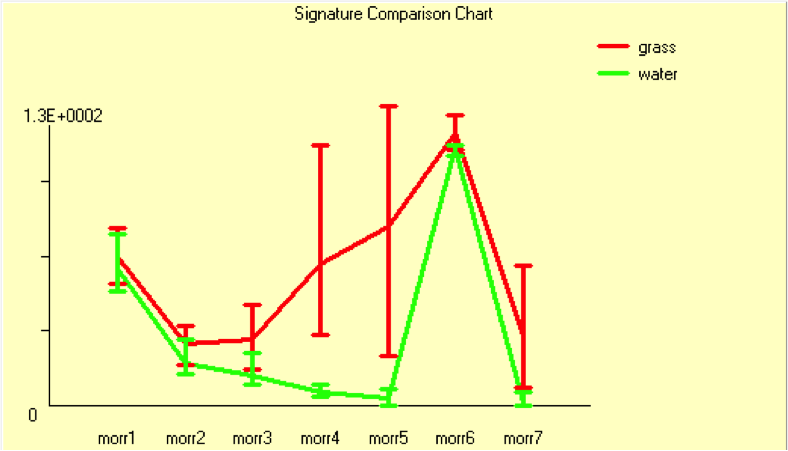
- The band values of grass are higher than those of water in every band. There is also very high uncertainty for the band values of grass in the Near Red and Mid IR bands. And there is overall very low uncertainty for the band values of water.
- The variability between bands in the reflectance curve of water is relatively smooth with the exception of the very high value in the Thermal IR band. There is greater variability in the grass reflectance values with a peak in Thermal IR.
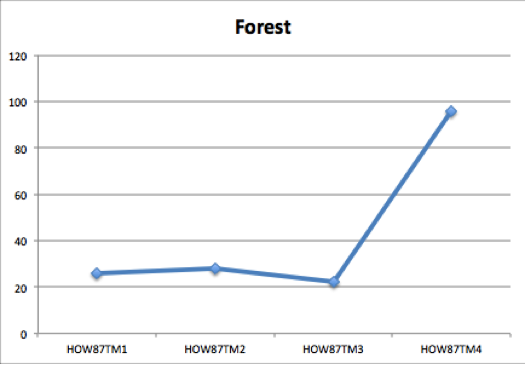
When looking at the grass signature there is a detectable “red edge” as the values in the IR spectrum increase rapidly.
The values in the Thermal IR band are very high and relatively the same for all four reflectance curves.
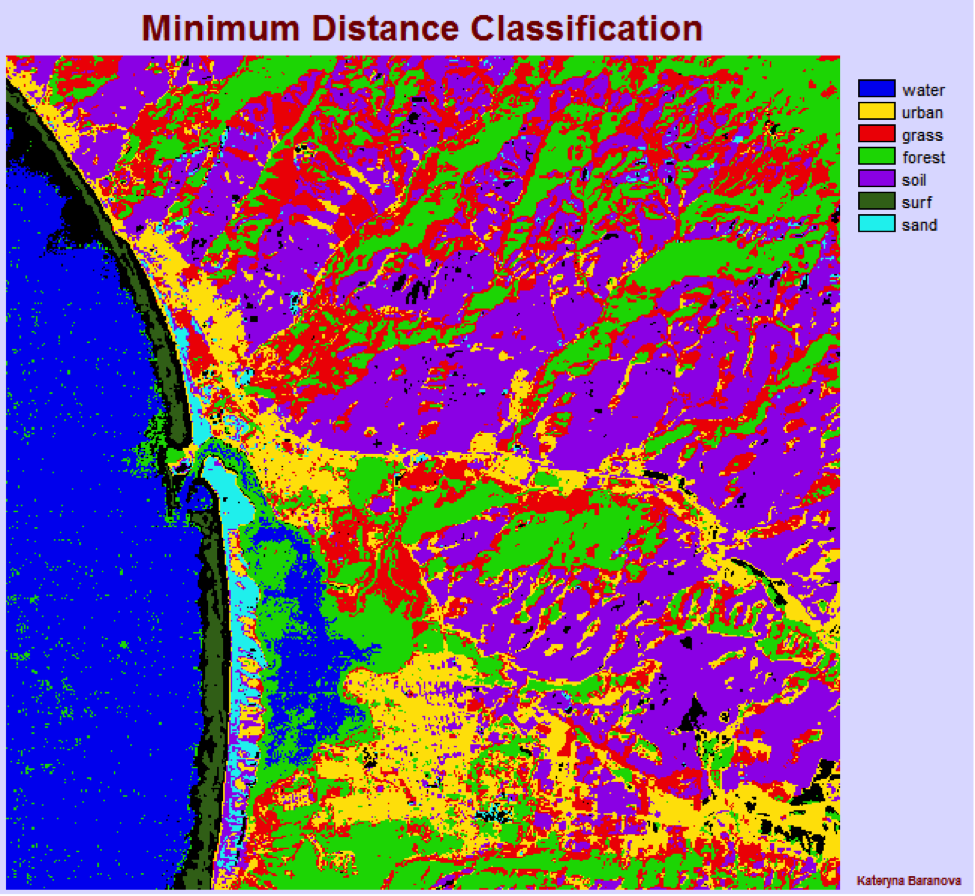
- Total number of pixels: 262,144 = 100%
- Not classified: 9,332 = 3.56%
- Water: 45,476 = 17.35%
- Urban: 31,907 = 12.17%
- Grass: 47,367 = 18.07%
- Forest: 50,487 = 19.26%
- Soil: 70,663 = 26.96%
- Surf: 3,232 = 1.23%
- Sand: 3,670 = 1.40%
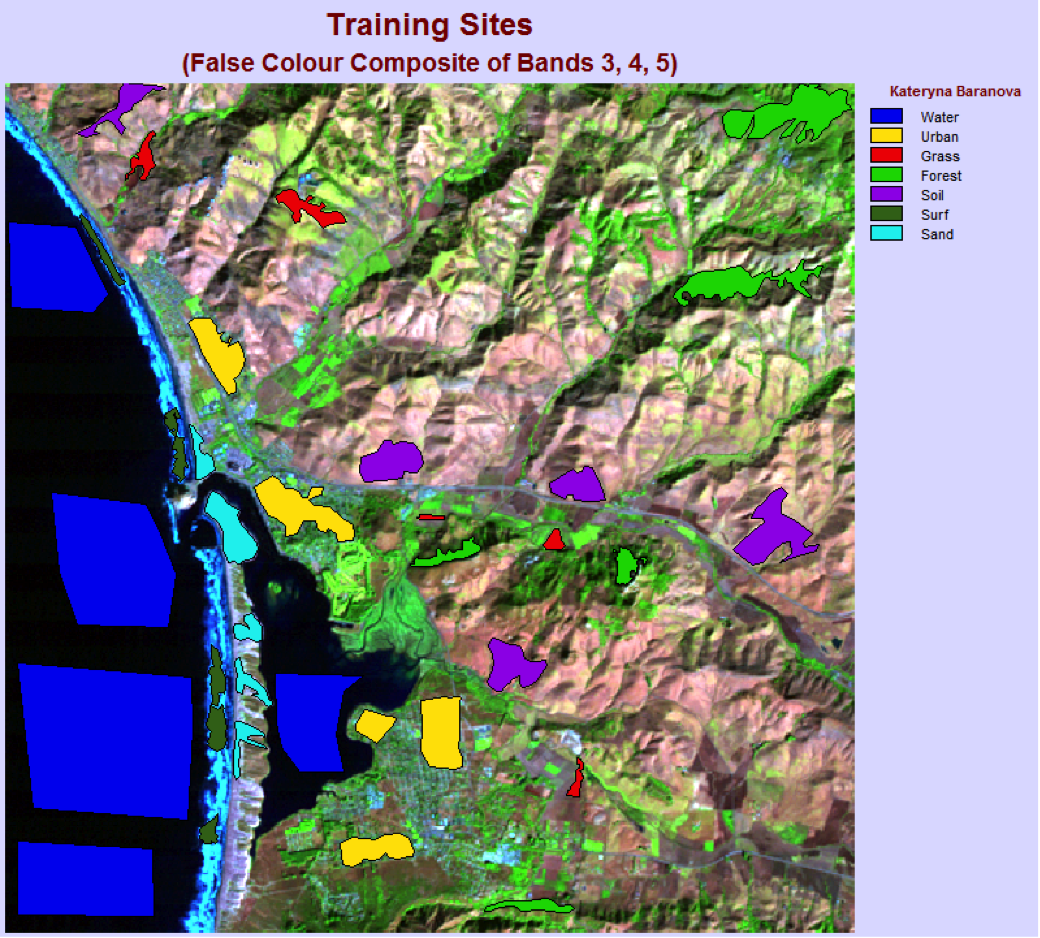
The minimum distance classification output image is similar to the original Morr345 image in that in both images the water surface is distinguishable from the land mass and the general outline of the shore is recognizable. From the classified image we can also see the location of major urban developments and see that most of the land cover is bare soil.
The classification appears to have failed in the bay and ocean areas because a lot of the pixels were classified as forest, where it is obviously water. It is very hard to find what the shape of the bay looks like from this classified image and there are pixels classified as urban land cover in the mountainous areas where it is most likely supposed to be either sand or soil.
The maximum likelihood classification method does a better job of successfully classifying pixels into land categories in this case. This is a “fair” comparison of the two methods as they are both compared to the same original image from which we can deduce how accurate each classification is. The urban, part of the surf areas and the coastal areas adjacent to the urban ones are consistently misclassified.
Urban is most commonly misclassified as the sand land cover and sometimes also as the soil. Urban is so poorly classified because it is very non-uniform and pixels within that class have very different spectral response patterns, making them difficult to classify.
To improve the classification accuracy, a higher quantity of more precise training sites can be selected.