Reflections on the hackathon experience by data presenter/scientist/instructor Dr. Megan Barker
I’d been looking forward to the hackathon for a few months, and it completely blew away my expectations! As a data presenter at the hackathon, my role was to share ideas and data from my collaborative project characterizing classroom practices in UBC biology – all in the hopes of tempting data-savvy hackers to play with the data for the weekend. In my research project team, we currently have pedagogical expertise but are sorely lacking skills in visual and data analysis. This hackathon was a perfect opportunity for us to share the dataset with analysts and students looking for real educational data to work with. The event was a smash success: we built teams, worked on real projects together, and had tangible successes by the end.
In our research, my colleagues and I ask the basic question:
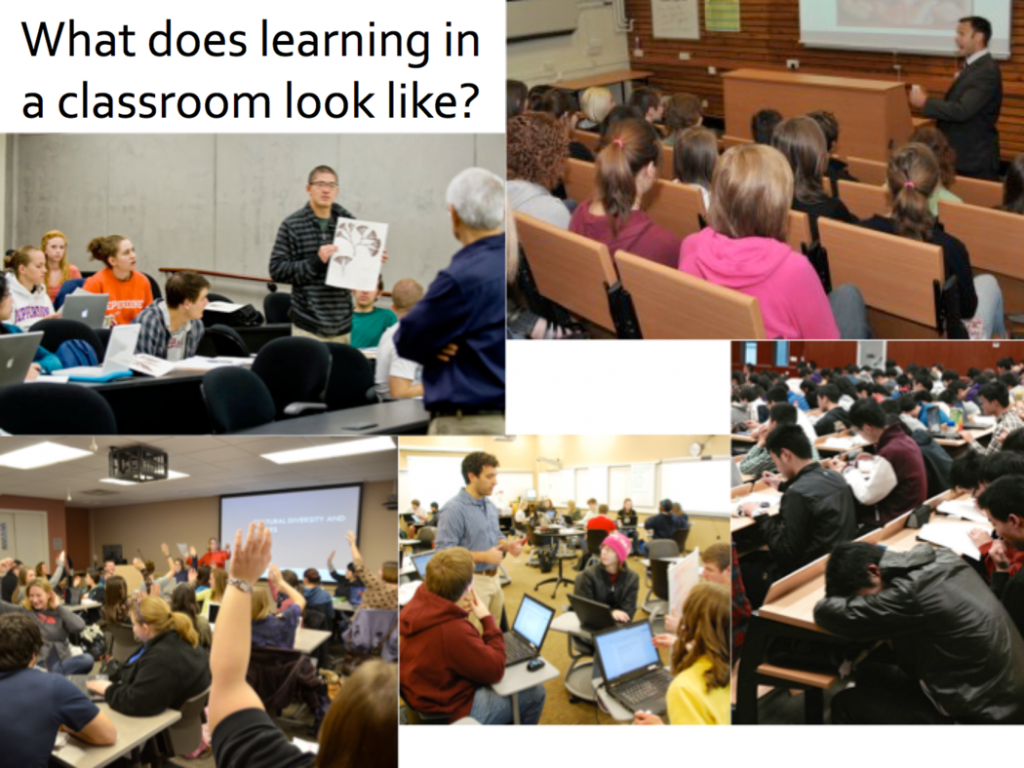
We approach this by observing and collecting data from many classes in our department. The tool we use is called COPUS: The Classroom Observation Protocol for Undergraduate STEM (Smith et al, 2013); and an updated data collection tool available here). By observing what the students are doing in class, and what the instructors are doing, over time, we can build up a picture of what is taking place, and when. Additionally, we can connect this with student performance data, via a set of concept assessments/inventories that we developed and deployed to each class. So, we have a large dataset to explore!
We have previously analyzed and presented this data in aggregate (see our poster presentation). Our analysis thus far has been interesting, but limited to a basic story: how much class time is spent on different activities?
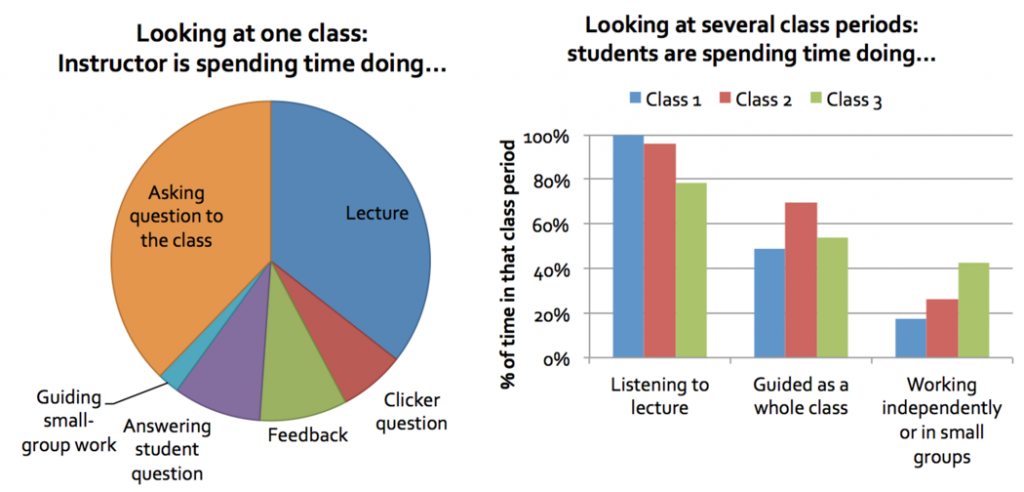
This analysis, while interesting, is similar to asking “How much screentime do Han Solo and Greedo have during Star Wars IV?” It’s really not the most fascinating of stories – like the movies, there is a lot more going on in a classroom, and some notable questions revolve around the unfolding of the story, and what activities follow which – or who shot first.
So, we seek to ask research questions such as:
- Within one class:
- How does class time unfold?
- What kinds of activities happen before/after each other, or simultaneously?
- How much switching between different activities takes place?
- Comparing the unfolding of multiple classes:
- Differences between two classes?
- Comparisons between an entire set of classes?
- Correlating these elements with student performance across different classes
Hackathon teams take on the challenge
During the hackathon, I was incredibly pleased that the groups took up this challenge of visualizing different sections and visualizing the unfolding of class time.
Three groups took this kind of data:
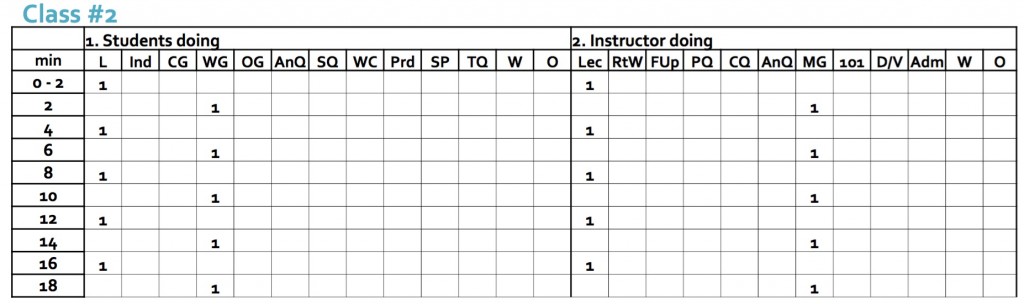
… and turned it into incredible visualizations below.
Group 1: The EduExplorers
This group focussed on comparing the top-performing class relative to the bottom, and characterized classroom activities as active (1) or inactive (0). This visual tells the story of active learning being effectively used, and would be incredibly powerful to share with instructors to reflect on their teaching practices.

Blue: instructor actions Green: student actions
Credit to the EduExplorers: Charmaine, Haider, Jodie, Rebecca, Sarah, Thomas, Weina.
Group 2: Sarah Perez and Rebecca Dickson
Another group created a Classroom Activity Flow, using Sankey diagrams. This allowed me to see, for a given classroom, what activities typically co-occur, and what takes place afterwards. We can also visually compare two classes as below. These two classrooms have roughly similar amounts of time with student listening, but we can see that they are drastically different experiences. What a beautiful visualization that also informs about of what is taking place!
Classroom observation 1:

Classroom observation 2:

Credits: Sarah Perez and Rebecca Dickson
Group 3: Tony Hui, Tyler Robb-smith, Nathan Roberson, Renee Mak
This group focussed on correlations between classroom activity and student outcomes, with a variety of visualizations. I was impressed by their data analysis skills, and their wealth of exploratory visualizations. One notable example was their comparison within a course, and between courses.

Credits: Tony Hui, Tyler Robb-smith, Nathan Roberson, Renee Mak.
Full analysis and contact information for this team can be found at:
https://github.com/hui-tony-zk/LAVA-hackathon/blob/master/Analysis_report.md.
As for the hackathon overall, the format worked really well – each team got to choose which dataset they worked with, and what approach they wanted to take with it. This allowed for different strengths and interests, and also meant that each team had their own set of challenges and opportunities. I had great conversations with some teams about what was straightforward for the participants to generate from the data, and what might be meaningful to the domain experts (educators) – and how these two don’t always overlap. Some teams identified that the work helped them recognize which analysis skills they are strong in, and what they need to work on. For myself, I also learned what types of technical challenges are present in preparing data for analysis, and am becoming more familiar with how data scientists see data – and how I can integrate my own perspective with that viewpoint. And the visuals produced by these hard-working teams helped me see my own data in a new light, and brought more questions to the forefront that we can ask about classroom practices. Fantastic!
The hackathon engendered these conversations and more, which were absolutely beneficial to myself in this project and beyond. I hope the participants also found value in working with an authentic project and want their skills and work to be impactful. Learning Analytics is inherently interdisciplinary, and so these cross-pollinations are essential.
Thank you to everyone who contributed – I was completely impressed by your initiative, creativity, and drive over the weekend and beyond. When’s the next event going to be?