The term “visual analytics” (VA) comes from the 2005 publication by James Thomas and Kristen Cook.
Visual analytics is “the science of analytical reasoning facilitated by interactive visual interface” [1].
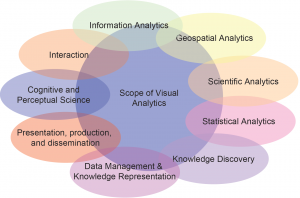
The scope of visual analytics is broad. It is at the intersection of many fields which have traditionally involved information, visualizations, and analysis [2].
The tools in VA allow us (researchers, analysts, you) to gain meaningful insights from larger sets of data by leveraging innate abilities to process data visually. The interactive nature of VA allows us to dig into data sets that may have otherwise been overwhelming.
Resources:
[1] J. Thomas and K. Cook. Illuminating the Path: Research and Development Agenda for Visual Analytics. IEEE-Press, 2005.
[2] D. A. Keim, F. Mansmann, J. Schneidewind, J. Thomas and H. Ziegler.
Visual Analytics: Scope and Challenges.
Visual Data Mining: Theory, Techniques and Tools for Visual Analytics, Springer, 2008.
Dr. Daniel Keim and his group at the University of Konstanz, Germany provide many resources defining VA. You should check out some of their publications too!