Will the next El Nino break a global temperature record?

by Simon Donner

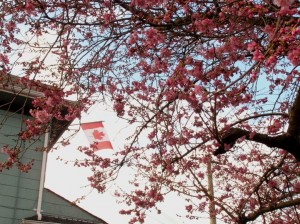
Cherry trees blossomed in Vancouver in early February during 2009-10 El Nino

Long-term forecasts say El Nino could be on the way.

This periodic climate warming of parts of the equatorial Pacific Ocean can affect weather around the world, often creating droughts and fires in Australia, Papua New Guinea and parts of Africa, heavy rains and flooding in California and parts of South America, and warmth across much of Canada and the northern U.S.

If you add it all together, forecasters often say El Nino years are unusually warm worldwide. The last strong El Nino event led to 1998 being the then-warmest year in recorded history.

Would the return of the mischievous brat of the climate system lead to a new global (surface) temperature record and an end to the “pause” in surface warming?

Not so fast. It could, yes. But not all El Nino events are created equal.

According to a recent study by my former student Sandra Banholzer and I, only “Eastern Pacific” El Nino events lead to global warmth. I’ll explain the difference.

Under normal or “neutral” conditions, winds blow from east to west across the equatorial Pacific. This causes the upwelling of cold water in the east that feeds the famous coastal fisheries of South America and the amazing marine life of the Galapagos.

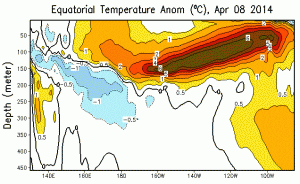
Temperature anomalies, or departures from normal, with depth across the equatorial Pacific

Whenever these easterly winds slow down or stop, the warm water piling up in the western Pacific – and I mean literally piling up, as the ocean can be tens of centimetres higher – can slosh back eastwards. This slow, long, east-moving wave of warmth is called a Kelvin wave. For an example, the image at right depicts the current Kelvin wave using temperate “anomalies” across the Pacific.

In general, if the change in the winds is strong and persistent enough, the Kelvin wave or series of Kelvin waves will be really warm and powerful, enough to cut off the upwelling in the east and dramatically warm the Pacific all the way from the South American coast across the International Dateline. This is what happens in a classic “Eastern Pacific” (EP) El Nino, like 1997/98 or 1982/83 (despite all the excitement about images like the above, the current Kelvin wave is alone not enough to trigger such an event; there would need to be continued or further gaps in the easterly winds).

On the other hand, if the switch in the winds is short-lived or happens only in the western half of the Pacific, the surface warming will be restricted to the middle of the Pacific, around the International Dateline. Scientists have been calling these events “Central Pacific”(CP) El Nino or El Nino “Modoki”.

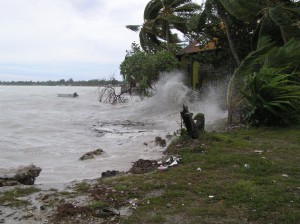
Full image from February 2005 storm in Tarawa

In fact, the header for this blog comes from a photo taken in Tarawa, Kiribati – right in the Central Pacific, 7 degrees west of the International Dateline – during the 2004/5 Central Pacific event. The elevated ocean temperatures caused bleaching of corals in Kiribati (pdf), and launched my field work. In the photo, you’re seeing a combination of high seas from the CP El Nino event, an El Nino driven westerly storm and a high tide blast the homes along the lagoon shoreline with waves.

The effects of an El Nino event on weather around the world (“teleconnections”) can depend on the type of event because of how the location and extent of abnormally warm Pacific waters affects the atmosphere. Our study showed that if you control for the other influences on global average surface temperature (like volcanoes and the human-induced trend), Central Pacific and “mixed” events are not unusually warm globally. Only the Eastern Pacific events affect the global average surface temperature.

This has important implications for the “pause” in surface warming. Over the past 10-15 years, the easterly winds have been abnormally strong, with few gaps sufficient to generate Kelvin waves. This is related to decade-scale variability in the Pacific Ocean conditions, called the Pacific Decadal Oscillation (PDO) or Interdecadal Pacific Oscillation (IPO).

It may then come as no surprise that all the El Nino events since 1998, including the 2009/10 event that made the cherries blossom early in Vancouver, have all been of the CP variety.  The same happens to be true for other “slowdowns” in the rate of global surface temperature change since the Industrial Revolution. This suggests the decade-scale variability in the Pacific affects El Nino development, and in turn, the ups and downs in the rate of human-caused global surface warming. From the conclusion of our paper:

The current mean state of the Pacific tends to restrict wind anomalies and anomalous convection to the central Pacific, and hence favours CP rather than EP events [Xiang et al., 2012]. A shift in the mean state of the Pacific back to a warm phase in a few years may allow for globally warm traditional EP El Niño events to return.

Could this coming El Nino spell the end of the pattern?

It is simply too early to say for certain. There are some telling signs. For one, the change in upper ocean heat content over the past three months is similar to that of the last two Eastern Pacific events (1997/98, 1982/83). We should be careful about reading too much into those numbers. There are other years in which such a pattern in upper ocean heat content did not lead to an Eastern Pacific El Nino event.

Unfortunately, patience is not a virtue on the internet!

The Vancouver Accord – An International Climate Change Agreement

by Simon Donner

Today, my class completed the “20th” Conference of the Parties to the UN Framework Convention on Climate Change. Groups of students representing 25 different countries worked feverishly to complete an agreement, submitting the final text with only a minute to spare.

The final product features many creative and detailed solutions to ongoing international climate policy disputes. Perhaps students should replace the delegates to the upcoming COP in Lima this fall!

Without further ado, here is the text of the Vancouver Accord, without the many bilateral side agreements:

OUTCOME OF THE MOCK 20th CONFERENCE OF THE PARTIES TO THE UN FRAMEWORK CONVENTION ON CLIMATE CHANGE

1. The parties of this convention agree with the findings of the Fifth Assessment of the Intergovernmental Panel on Climate Change that climate change represents a serious threat to the ecological and economic future of the planet.

2. A central goal of long-term collective action is the stabilization of greenhouse gas concentrations in the atmosphere at level that will keep global surface warming at minimum of 2°C above the pre-industrial average, contingent on the developed world providing financial and technical support to the developing world. Continue reading

The IPCC and finding the balance between science and advocacy

by Simon Donner

Media coverage of the latest Intergovermental Panel on Climate Change (IPCC) report has followed the usual Goldilocks and the Three Bears pattern. The report, which focuses on impacts, adaptation and vulnerability, is either too soft (too conservative), too hard (overstating impacts, veering into advocacy) or just right.

Which is it? One problem is that every scientist or journalist you ask will have a different answer on the “right” IPCC message and the right next steps for the world. The answer depends a bit on the values of the person making the judgement. If the answer comes from a scientist – a profession with respect in society – the judgement will be seen as objective. Scientists, however, are also human beings! So, like the rest of humanity, our judgements can be influenced by our values.

The question of how scientists can choose their place on this continuum between science and advocacy is the subject of my new essay in Climatic Change.  The concept is straight-forward:

Scientists may be best served viewing science and advocacy as different ends of an approximate continuum. On the science-dominant end, judgements are more objective in nature. As scientists proceed towards the advocacy side of the continuum, personal worldview tends to have a greater influence on those judgements. The scientific uncertainty embedded in those judgements tends to increase, as scientists must draw upon additional models or decision-making processes each of which contain some uncertainty. The professional risk of judgements also increases along the continuum due to the cultural norms of science and the public perception of science as objective.

From there, I write about how scientists can be “scientific” about public engagement — make choices based on the available research on communications, advocacy, perception of scientists, and leakage of “normative” judgements into scientific decisions. My hope is that scientists will think carefully about their personal comfort level, whom they represent (in their eyes, and in the audience’s eyes), and the effectiveness of their chosen position:

The only “wrong” position on the continuum is one assigned by others or chosen without careful reflection.

What about the IPCC? Despite what you may read, the IPCC panels themselves are extremely thoughtful about providing an objective reading of the findings, often spending hours, even days, debating about how individual words will be perceived. This is reflected in the careful language the latest IPCC report uses surrounding the definition of “dangerous” climate change:

Human influence on the climate system is clear. Yet determining whether such influence constitutes “dangerous anthropogenic interference” in the words of Article 2 of the UNFCCC involves both risk assessment and value judgments.

Conservative? Alarmist? You be the judge. That’s the whole point.

Quote of the Week: Time Magazine on climate change, in 1956

“Since the start of the industrial revolution, mankind has been burning fossil fuel (coal, oil, etc.) and adding its carbon to the atmosphere as carbon dioxide. In 50 years or so this process, says Director Roger Revelle of the Scripps Institution of Oceanography, may have a violent effect on the earth’s climate…

Dr. Revelle has not reached the stage of warning against this catastrophe, but he and other geophysicists intend to keep watching and recording. During the International Geophysical Year (1957-58), teams of scientists will take inventory of the earth’s CO2 and observe how it shifts between air and sea. They will try to find out whether the CO2 blanket has been growing thicker, and what the effect has been. When all their data have been studied, they may be able to predict whether man’s factory chimneys and auto exhausts will eventually cause salt water to flow in the streets of New York and London.”

– “One Big Greenhouse“, Time Magazine, May 28, 1956

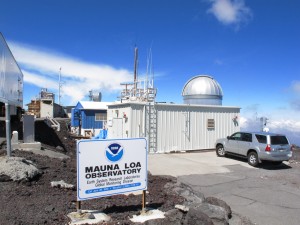
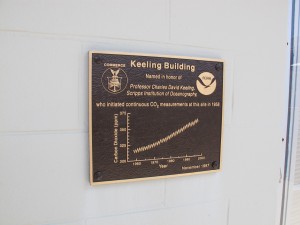
As part of the International Geophysical year, Revelle’s post-doctoral associate David Keeling established the CO2 monitoring station atop Mauna Loa in Hawaii (photos taken by an embarrassingly excited S. Donner). The now famous Keeling Curve is the longest continuous record of atmospheric CO2 measurements.

Funding for the regular measurements at Mauna Loa has long been an issue. You can now donate directly through a crowd-sourcing program to maintain this incredible record of planetary change.

The full range of future sea level rise, and what it means

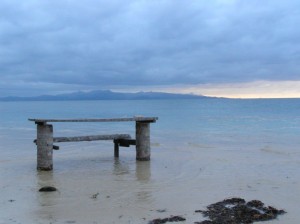
High tide in Caqelai, Fiji reaches an old table (S. Donner)

by Simon Donner

We have been thinking a lot here about sea level rise, from the effect on tides to the UNESCO heritage sites at risk. If you search the media for the most recent IPCC sea level rise predictions, you’ll read that the 2013 report concluded that sea level was “likely” to increase by 45-82 cm by the “end of the century”. These numbers are misleading for two reasons, as was explained very well in a December letter to Science magazine by the very authors of the IPCC sea level rise chapter. The nuances may be important when making adaptation decisions.

First, what people present as “end of century” from the IPCC is, technically, an average of model-projected values for the year 2081 through the year 2100. Since sea level is expected to be rising rapidly at the end of the century – 8-16 mm/year, up to five times today’s rate – the difference between an average for those last twenty years and the value for actual end of the century is meaningful. The “likely” range for 2100 is actually 52 – 98 cm, not 45-82 cm. Continue reading