Weather, climate and the “limiting” nutrient in waterways

Nutrients are a good thing. They promote growth of cells in plants and animals. Food manufacturers love to advertise that their products, like breakfast cereals, are chock-full of “key” or “vital” or “healthy” nutrients.

OLYMPUS DIGITAL CAMERA

In waterways, however, you can have too much of a good thing. Load a lake or an estuary with too much of the nutrient that limits productivity and you might choke the system with algae – the process that scientists call eutrophication because we stink at naming things. All that algae eventually decomposes, or is consumed by other organisms that eventually decompose,  which uses up oxygen crucial to other organisms. That’s a rough explanation of what has happened in the Gulf of Mexico at the mouth of the Mississippi River. Nutrients, particularly nitrogen, leach off agricultural fields and empty into the continental shelf, driving the development of a large “hypoxic” or “dead” zone each summer.

The key issue for the algae is the stoichiometry (again, we stink at naming things) or the ratio of the nutrients: the relative availability of key chemical players like nitrogen (N), phosphorus (P) and silica (Si). Say the ratio of nitrogen to phosphorus in the water is greater than what most algae need; they typically 16 nitrogen”s” for every phosphorus. Then phosphorus becomes the “limiting nutrient”. Add more phosphorus and you should get more growth because there’s already enough nitrogen available. Add more nitrogen, no dice, as there’s not enough phosphorus to match the existing nitrogen levels.

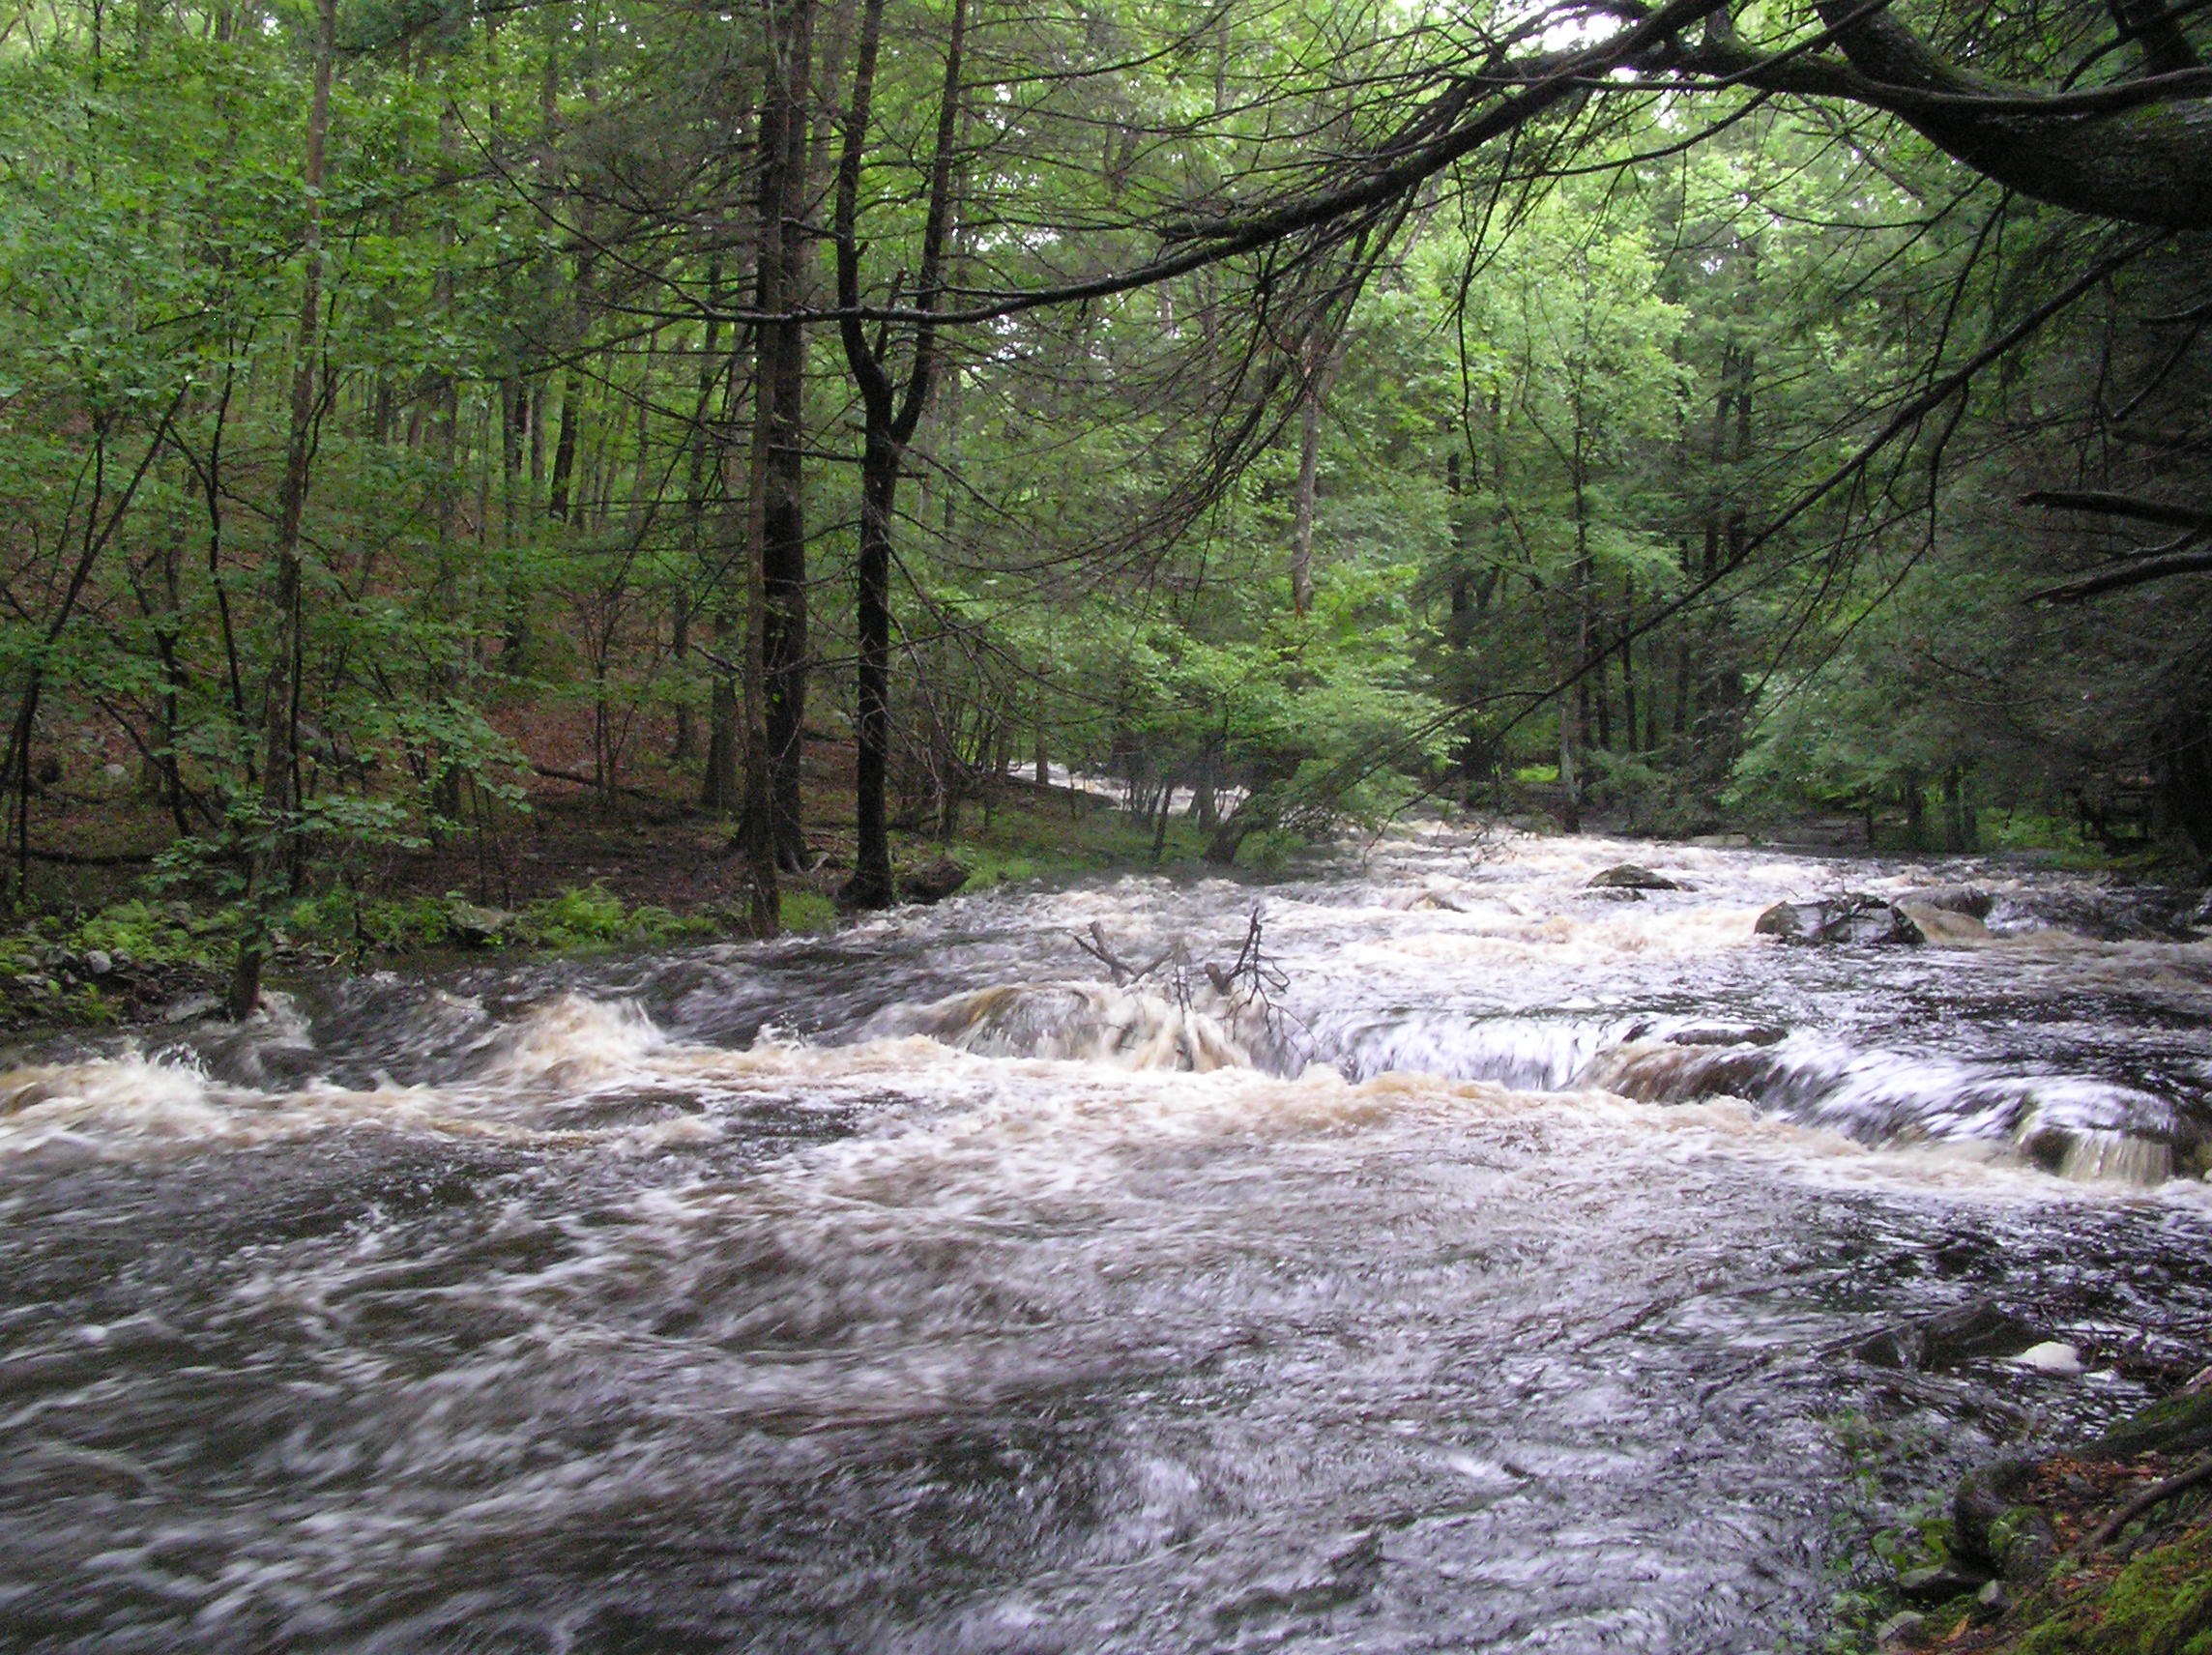
Now, past research has shown that thanks to things like fertilizer loading agricultural soils and groundwater full of nutrients, the key determinant of how much actually ends up flowing down a agricultural river is the weather. For example, a study by myself and Don Scavia showed that a wet fall (which “recharges” the groundwater) in the Midwestern U.S. followed by a wet spring means a large flux of nitrogen down the Mississippi, and all else being equal, a large “dead” zone. But most of that type of runoff and nutrient analysis has focused on individual nutrients, when what really matters to the algae, is the ratio between the nutrients.

11283786-large

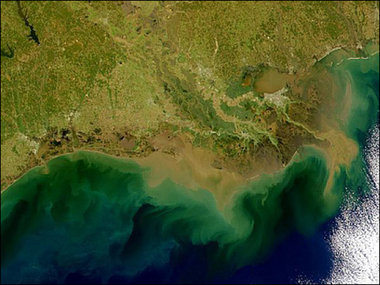
Mississippi Delta and northern Gulf of Mexico

A recent paper led by my former student Doris Leong looked sensitivity of the nutrient ratios to variability in runoff, and hence rainfall. The idea was that, since N, P and Si come from different sources and have different solubilities and adsorptive properties, the flow of each nutrient in a watershed may respond differently to a change in rainfall and runoff*. We hypothesized that in an agricultural river basin, where there is a lot of nitrogen in a soluble form in the soils and groundwater, the N:P and N:Si ratio in the river should increase during wetter periods. An analysis using data from across the Mississippi River Basin confirmed the hypothesis, particularly for N:P:

A doubling of the discharge by the Mississippi and Atchafalaya Rivers to the Gulf of Mexico is found to increase the N:P by 10% and the N:Si by 4%. Analysis of data from upstream stations indicates that the N:P increases with discharge in subbasins with intensive row crop agriculture and high fertilizer application rates.

The effect suggests that the weather could influence nutrient limitation productivity downstream. It may also subtly influence the relative abundance of different primary producers (e.g. algae) in river or in the coastal zone. For example, research shows that if N:Si reaches well above 1:1, there can be a shift away from the production of diatoms, which require Si to build their shells.

The results of the paper suggest that, if all else is equal, a wetter climate in the central U.S. would mean higher N:P and N:Si in Mississippi water. It is important to note, however, that all else is unlikely to equal. Changes in agricultural practices, river management, erosion control, etc. will also influence the availability and movement of nutrients. From the conclusion:

The flux of nutrient ratios depends on multiple environmental characteristics of a watershed, including land use, land management, climate and geology, and the river network, and it is difficult to determine the relative importance of these different effects. The dominant nutrient species, sediment transport, presence of dams, as well as in-stream uptake of nutrients, all play a role in controlling the movement patterns of nutrients over the landscape and within rivers. High-resolution data and models that incorporate sediment and dissolved nutrient cycling are needed to understand the multiple factors that influence how nutrient ratios respond to changes in discharge. As future climate change drives an increase in hydrologic variability, the predictability of the response of nutrient ratios to discharge may be important to understanding ecosystem responses to climatic change.

* Technically speaking, we modeled the relationship between river discharge and nutrient load as a power law. Thus the hypothesis was that for a given watershed, the exponent in the power law would be different for N, P and Si.

Emissions of Convenience: The other side of oil spills

The fear of oil spills on Canada’s west coast was heightened by the recent small spill of bunker fuel, basically fuel oil, from a container ship parked in Vancouver’s harbour. Amidst all the furor over the recent spill, one question was missing: What would have happened to that fuel oil if it had not leaked into English Bay?VCRD129_Oil_Spill_20150409

It would have been burned, adding CO2 and a number of air pollutants to the atmosphere.

Transporting goods around the world via ships represents around 3% of global greenhouse gas emissions, roughly the same as air travel, or all of Canada. A recent study by Alice Bows-Larkin and others in Nature Climate Change concluded that shipping emissions are going to continue to grow at a rapid pace into the future despite the availability of technological advancements in ship design and energy sources.

The question of tackling greenhouse gas emissions from shipping will be up for debate at the upcoming meeting of the International Maritime Organization (IMO)’s Marine Environment Protection Committee (May 11-15th, 2015) thanks to a push from a surprising source: the Republic of the Marshall Islands. This small Pacific Islands country may sadly be best known to outsiders as the site of U.S. hydrogen bomb tests in the 1950s.

Why are the Marshall Islands leading the charge for regulation of shipping emissions?

Thanks to the weird system of international shipping in which vessels fly the flag of distant countries in order to avoid regulations, the Marshall Islands is legally the home port of 3,400 large vessels. If you live in Vancouver or another port city, look through some binoculars at the back of the supertankers and container vessels and you will likely see one of three names: Panama, Monrovia (the capital of Liberia), or Majuro, the capital of the Marshall Islands.

Unlike most economic sectors, shipping emissions are not part of the U.N. Framework Convention on Climate Change and thus not part of the emissions total for countries. Under the Kyoto Protocol negotiations, the responsibility for shipping emissions was handed to the IMO, similar to how aviation emissions were made the responsibility of the International Civil Aviation Organization.

Majuro

Flooding in Majuro, 2014 (rtcc.org)

The Marshall Islands is using the leverage of its large ship registry to push for a sector-wide emissions target. With most land less than 2-3m above sea-level, the coral atolls of the Marshall Islands are highly vulnerable to climate change. The damaging “king” tides from last year gave a glimpse of the future of the Marshallese. Here’s Minister of Foreign Affairs Tony de Brum:

We are an island nation and shipping is one of our lifelines – we cannot survive without it.  At the same time, carbon emissions, including those from shipping, pose an existential threat to our people and our country.

Right now, the Marshall Islands and others are jockeying for support within the IMO, especially from neighbouring Pacific Island countries. They could use support from places like Canada, which pays attention to shipping fuel only when it spills into our waters.

The federal government has spoken of making Canada a world leader in oil spill response. The recent budget included $13.9 million to fund research on effective response to oil spills, as well as money to help establish an International Maritime Centre in Vancouver.

The next step is to deal with the oil that ships actually burn.

The long-term threat of sea-level rise

OLYMPUS DIGITAL CAMERA

Road repair along Nippon Causeway, 2014

My recent article in Scientific American discusses how low-lying coral atolls, like the islands of Kiribati, are a lot more resilient to sea-level rise than dire stories in the media may have you think. But don’t let the nuances of reef island geology described in the article create any doubts about the reality of sea-level rise.

The oceans are rising, and the long-term picture for places like Kiribati is not pretty. This was brought home in the past few days by storm surges again damaging Tarawa atoll’s key causeway that links the most populated islet and international port to the rest of Tarawa.

Here’s a short sidebar of the science of sea-level rise which had to be cut from the article due to space considerations:

The oceans are rising, and the rate of that rise is increasing. Global average sea-level has risen 20 cm since the beginning of the last century, and may rise up to a metre or more by the end of this century.

We can blame greenhouse gas emissions and the basic physics of water.
The planet is absorbing extra heat thanks to the human enhancement of the natural greenhouse effect. The atmosphere gets all the attention, but actually receives only 1-2% of that extra heat. The majority – roughly 93% – goes into warming those deep pools of salt water covering two-thirds of the planet. When water warms up, it expands. That thermal expansion of the ocean is responsible for over half of sea-level rise since 1900.

The key issue for future sea-level is the 3% of the extra heat in the climate system going towards melting ice, especially the Greenland and West Antarctic ice sheets. The rate of melt from these great ice sheets, which hold enough water to raise sea-level by about 12 metres, will define the coasts of the future.

The most recent Intergovernmental Panel on Climate Change report concluded that sea-level would likely rise by 52 – 98 cm by the end of this century, but allowed that far greater changes were possible. It all depends on the complicated process of ice sheet melt.

We know that during periods of Earth’s history when temperatures and greenhouse gases were at levels expected for mid-century, ice sheet melt may have raised the oceans more than 5 metres above current sea-level. We don’t know exactly how long it takes for all that ice to break off or melt. Estimates run in the centuries or longer.

The long-term change is the existential concern for a place like Kiribati. From the article:

The fact that reef islands can grow in some cases and that adaptation measures can help will not save Kiribati forever, especially if the world fails to reduce greenhouse gas emissions. Climate models project that if we stay on the current emissions path, sea-level could be rising at the end of the century at more than five times today’s rate. Even in the unlikely case that islands are able to continue, on net, to accumulate material at their current rate, they may become narrower, steeper and possess less freshwater, making them prohibitively expensive to inhabit.

After a discussion of adaptation needs and ongoing initiatives in Kiribati, the article concludes with a thought I’ve had every time my local colleagues and I return to land from collecting data:

Tarawa's lagoon, visible in the distant clouds

Tarawa’s lagoon, visible to a trained eye in the distant clouds

As you travel out to sea in Kiribati, the flat islands quickly disappear below the horizon. In the old times, fishers navigated home by looking for the reflection of the shallow, greenish lagoon waters in the clouds. One day in the distant future, many of the islands of Kiribati could succumb to the sea. The people may leave, the trees may die and the land may become a submerged reef. The lagoons, still shallow in contrast to the deep open ocean, would remain green as before.

To outsiders, Kiribati would be gone. To the Kiribati people, the ghost of their former homeland would live on in the clouds.

Life as a climate change poster child: the new Scientific American article about Kiribati

???????????????????????????????I have a feature (“Fantasy Island”) in the latest issue of Scientific American and accompanying online slideshow about the reality of sea-level rise in Kiribati.

The article summarizes the complicated science of sea-level rise in coral islands and the even more complicated politics of being a poster child for the impacts of climate change on the developing world. In reflecting on years of research on the ground and on (and in) the water, I try to provide an antidote to all those well-meaning but generally inaccurate pieces of popular disaster porn written about remote island nations like Kiribati and Tuvalu.

If you are interested in what actually is happening in places like Kiribati, I encourage you to buy the issue. An excerpt:

A North American or European traveling to Kiribati may as
well be stepping through a wormhole into another universe. Combine
that naïveté with the reserved nature of the Kiribati people,
the custom of deferring to outsiders, the legacy of countless
past i-Matang asking about climate change and the lack of local scientific
capacity to verify claims, and a naturally flooding village
becomes a victim. Add in the geopolitics—the legitimate need for
a tiny country lacking agency on the world stage to raise awareness
of a threat to its existence—and the exaggeration about the
impacts of sea-level rise can look intentional, whether it is or not.
As my friend Claire Anterea of the Kiribati Climate Action Network
says, “This is not a story that you will just journalize in one
week or two weeks.”

The article is  a testament to all the wonderful people in Kiribati that I have interviewed and worked with over the years, as well as to Mark Fischetti and the editors at Scientific American, who were willing to embrace a story about the incredibly important but less glamourous nuances of climate change.

Warming El Niños on a warming planet

According to the World Meteorological Organization, this year is on pace to be the warmest in recorded history. Whether or not 2014 is awarded the gold, silver or bronze in the global warming’s equivalent of the 100 m dash will probably depend on the temperature dataset. The precise placement of any one year on the medal standings is, of course, immaterial to the broader issue of the longer term trend, described beautifully by Eric RostonENSO-temps-v2-wTrends-638x431.

What is remarkable to many observers is that a record might be set without the help of a “full El Niño”, to use the WMO’s term. In the last few decades, global average surface temperature records have generally been set by a combination of the long-term warming trend and the bump from everyone’s favourite Latin American weather nickname. An increasingly common way to plot global average surface temperatures is with additional labels for El Niño, La Niña and neutral years, as was done in the WMO report and this figure from Skeptical Science. The take-home message – El Niño, La Niña, neutral, it is all warming.

The labeling is the tricky part, for two reasons. First, El Niños normally develop and peak over the “boreal” or northern hemisphere winter, which means they span two calendar years. There’s usually a few months lag between the development of El Niño and the global temperature effect. Thus, for the global temperature analysis purposes, the “El Niño” year is the year after the onset of the event. The best example is the 1997/98 event which helped bump 1998 to a warmest year gold medal.

Second, there’s no one perfect way to classify El Niño events. For example, in the Skeptical Science plot, 2005 is classified as an El Niño year. In a plot in the WMO report, 2005 is classified as a neutral year. These conflicts arise with “weak” El Niño years because different groups use different classification systems. The U.S. agencies NOAA and NASA disagreed as to whether 2004/05 was an El Niño event.

The suggestion that El Niño events be divided into types or flavours may address some of this potential disagreement. The recent paper led by my former student Sandra Banholzer concluded that the global average surface temperature is anomalously warm – statistically-speaking – during the canonical or traditional “Eastern Pacific” El Niño events like 1997/98, but not during “Central Pacific” events or “Mixefig2 - banholzer and donnerd” events. A more nuanced classification system allows 2004/05 to get status as El Niño-ish, but not a classic El Niño.

There are a variety of ways to perform the classifications and it is safe to say that the scientists involved do not agree on the “best” method. Whatever method is used, the underlying surface warming trend is the same. As is clear from this figure from the recent paper, the warming trend is robust.

NOTE: We will have a poster on this subject at AGU on the afternoon of Wednesday, December 15th, 2014.