Bernardo Bordeira, MEL Candidate | December 2020
APPP 506 – Master of Engineering Leadership Capstone Project, University of British Columbia
Abstract
Energy demand in the residential sector has been increasing since 1974 and in Canada it was the second largest energy consumer in 2017. Currently, there are more than 250 different energy programs available for Canadians with the main objectives to reduce energy energy bills, reduce greenhouse gas emissions and increase homes’ overall comfort. Two programs implemented in Alberta with different approaches are analyzed and both quantitative measures and behavior programs (qualitative measures) are analyzed to assess the main differences between the prescriptive and diagnostic programs deployed in the province between 2018 and 2019.
Introduction
The residential sector is known for being one of the top energy consumers and greenhouse gas (GHG) emitters worldwide. 30% of global energy consumption is under this sector, where there is great potential to improve energy efficiency. Since 1974, the energy demand from buildings, including residential and commercial buildings, has grown by 1.8% per year and it is predicted to grow from 117 EJ in 2010 to over 184 EJ by 2050 (1 EJ = 1018J).
Although this rise is mainly driven by the increasing population, urbanization, and economic growth in developing countries, the growing energy demand in the residential sector is also a major concern for developed countries like Canada, considering its negative impacts in global warming and climate change. Canada is part of a set of ten countries that account for 67% of global CO2 emissions.
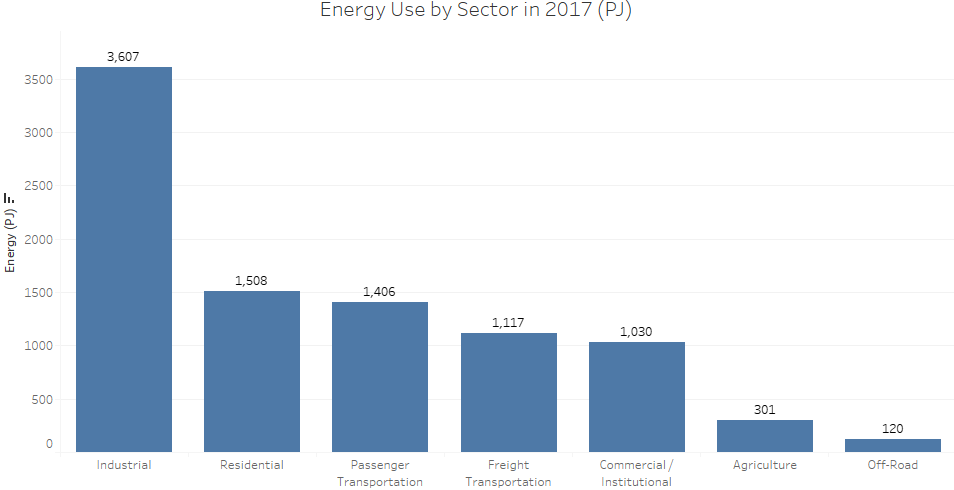
The residential sector was Canada’s second largest energy consumer in 2017, being responsible for approximately 1,508 PJ (1 PJ = 1015J) , around 17% of the total energy consumed countrywide (Figure 1).
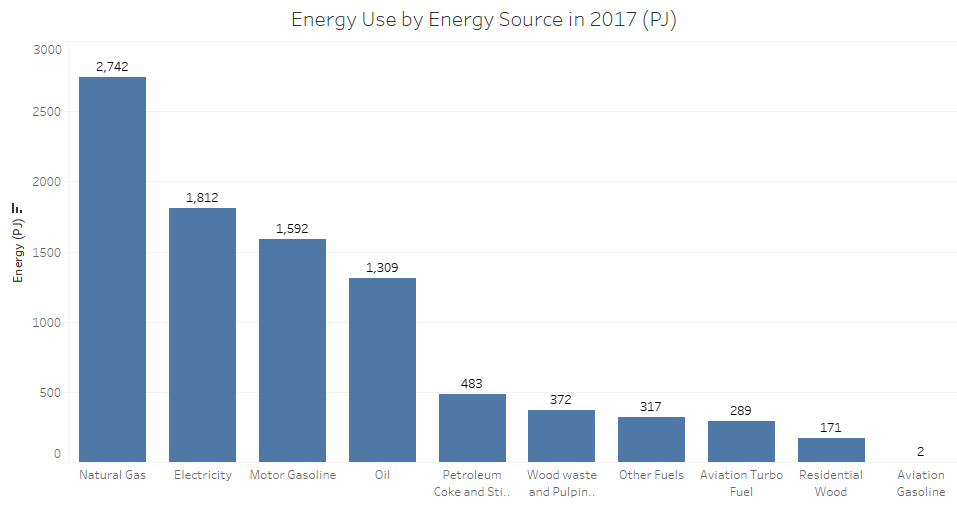
Analyzing the energy consumption by energy sources, natural gas and electricity were the two main sources, respectively responsible for 30 and 20% of the total energy consumed. These two sources contributed to half of the total energy consumed in Canada in 2017, as shown in Figure 2.
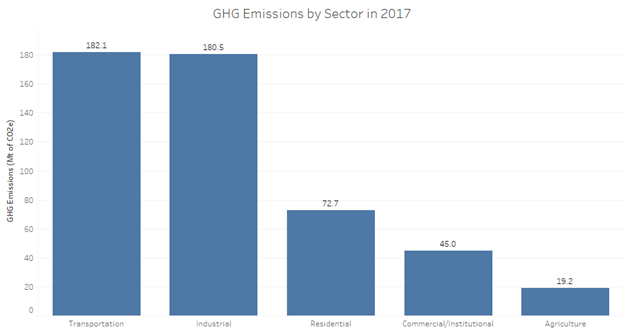
Regarding GHG emissions, Figure 3 shows that the residential sector was the third largest emitter in 2017, with approximately 73 Mton of CO2-eq, behind the industrial and transportation sectors.
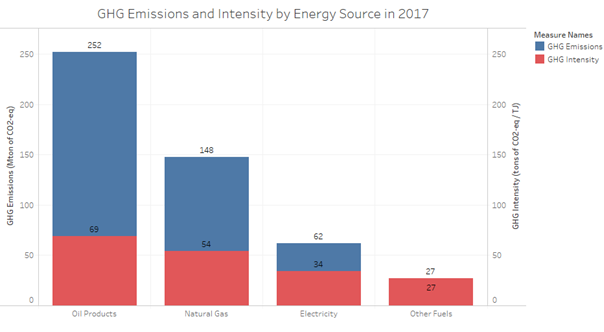
When analyzing the emissions per type of source, Figure 4 shows that natural gas and electricity are the second and third top emitters, with 148 and 62 Mton of CO2-eq, and both maintain their standings when the comparison is made based on GHG intensity (54 and 34 tons of CO2-eq per TJ, respectively). 1 TJ = 1012J.
Objective
In order to reduce energy demand and consequently GHG emissions, Canada’s ten provinces and three territories offer different financial incentives and programs for Canadians to make their homes more energy efficient and, as a consequence, reduce their monthly energy bills (electricity and gas). As of November 2020, there were 259 different energy efficiency and alternative energy programs throughout Canada that offer rebates, free help upgrading housing units and incentives for eligible equipment/systems.
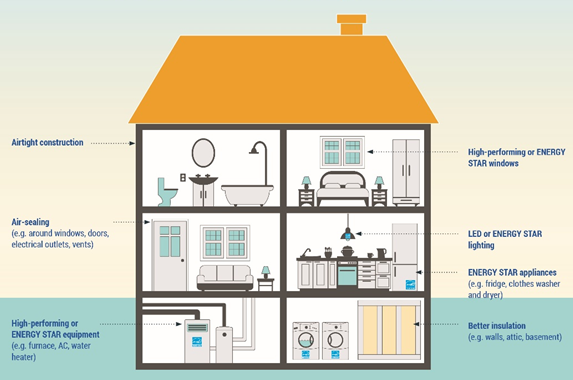
There are several possibilities to improve a home’s energy efficiency. Airtight construction, air-sealing, high-performing equipment and windows, LED or Energy Star lighting, insulation and Energy Star appliances are some of the examples illustrated in Figure 5. The more of these elements can be combined in a home, the more energy efficient it will be.
This project has as its main objective to analyze qualitatively and quantitatively two different home energy efficiency programs which were implemented in the Province of Alberta between 2018 and 2019. These programs were carried out with the support of Energy Efficiency Alberta (EEA), which is a provincial agency that helps Albertans consume less energy, emit less GHG and pay less for their utility bills. Although the goals were basically the same in both programs, the approaches used to achieve these goals were different. While one program used a prescriptive approach, the other was based on a diagnostic approach.
Prescriptive and Diagnostic Approaches
The prescriptive approach is historically the most widely type of program implemented for DSM (demand-side management) programs. It can be summarized as having a pre-defined list of items that are going to be added, substituted or removed in all homes engaged in the program. This means that the set of modifications made is standardized and that the “as-is” situation of each specific residence is not taken into consideration. On the other hand, the diagnostic approach is based, as can be inferred from its name, on a previous diagnosis. In the diagnosis phase, an analysis is carried out for each residential unit in order to identify the current situation and propose the modifications that are the most needed and that can bring better results in terms of energy efficiency. It results in a customized solution for each home engaged in the program. The idea behind the pre-study phase in the diagnostic approach is to deliver the greatest per home impact given a financial constraint that all programs face. Table 1 summarizes the programs’ main characteristics.
| Prescriptive | Diagnostic |
| The modifications are made in a straightforward way | Modifications are only made after a diagnosis phase is carried out |
| The “as-is” situation of engaged homes is not taken into consideration | The “as-is” situation of each home is previously studied and assessed to identify the necessary modifications |
| Standardized solution | Customized solution |
Methodology
Energy efficiency programs have the goal to reduce energy consumption and increase the resident’s overall comfort. This goal can be achieved by investing in both quantitative and qualitative measures. For this project, the quantitative measures are the ones that allow an objective numeric analysis to be carried out to compare energy and GHG emissions savings for the diagnostic and prescriptive programs. In contrast, the qualitative measures are the ones in which a subjective analysis is done to compare both programs. The qualitative comparison will be assessed on how the different behavior measures can impact the user’s attitudes in a way to re-educate them and reduce energy consumption.
Quantitative Analysis
The first parameter that will be calculated for both programs is the average energy saved per installation. This parameter simply calculates the ratio between the total energy saved (electricity plus natural gas, in GJ) for all residences for one year and the amount of participant installations (homes) in the program.
- Average energy saved (GJ per home) =
Total energy saved during a year (GJ) / number of homes
For this parameter, the higher the result the better, since the idea is to maximize energy savings.
The second parameter to compare both programs is the first-year acquisition costs, which is the ratio between the total cost associated with the program ($) and the energy saved throughout one year (GJ). The parameter can be calculated as shown below.
- First-year costs is $ per GJ =
total annual program cost ($) / annual energy saved (GJ)
This parameter returns the budget spent for every GJ saved. That means that the lower cost per GJ the better.
The last parameter is the the first-year costs of saved GHG emissions This parameter is analogue to the first-year acquisition costs, but instead of dividing the program cost by the energy saved, the denominator is now the saved GHG emissions. It is calculated as shown below:
- First-year costs of saved GHG emissions ($ per kgCO2-eq) =
total annual program cost ($) / annual GHG emissions saved (kgCO2-eq)
Like the previous parameter, the lower the cost per kgCO2-eq saved the better, since the goal is to minimize the cost per GHG saved.
In order to calculate the total mass of equivalent carbon dioxide emitted (CO2-eq), the emissions intensity factors considered for electricity and natural gas are the ones stated in the Documentation of Program Performance Metrics for Energy Efficiency Alberta and represented in Table 2.
| Source of Energy | Intensity Factor |
| Electricity | |
| Natural Gas |
Qualitative Analysis
The different behaviour programs that will be studied and assessed to compare the diagnostic and prescriptive programs are:
- Social Interaction: the idea behind this program is to have energy experts to visit homes and provide in-person assessment and advice so that residents can have a better understanding of energy efficiency measures and adopt them to reduce their monthly consumption
- Home Energy Reports: by delivering regular energy reports, this program allows home owners to compare their performance in terms of energy consumption reduction with similar households in their neighborhood
- Real-time feedbacks: this program discusses how devices that provide real-time / online feedback can help re-educate residents and decrease their energy consumption

- Audit programs: similar to the social interaction program, specialists provide guidance on how residents can make their homes more energy efficient, which is also a great opportunity to gain trust, build credibility, and more actively encourage participants to engage with the program and complete recommended upgrades.
- Education and Training: the focus on this type of program is to deliver teaching experiences to residents in order to change their behavior to become aware of how simple measures can reduce consumption and their carbon footprint.
Results
Quantitative Analysis
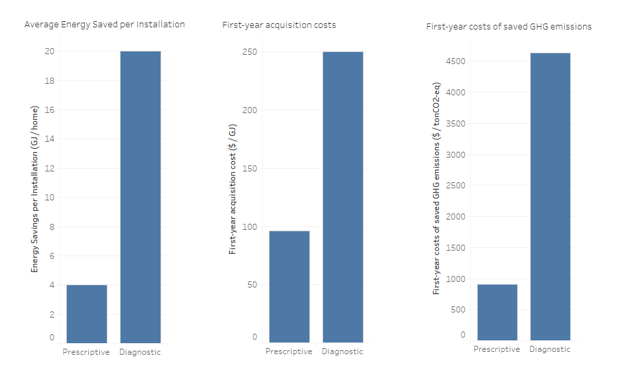
The three bar graphs show that the diagnostic program had better energy savings per installation (20GJ/home vs 4GJ/home). However, when comparing the costs per energy savings and GHG emissions saved, the prescriptive program presented better outcomes. These results can be interpreted as the prescriptive program involved small measures (e.g., LED lights, aerators, smart thermostats) which often prove to be very cost-effective regardless of the age of homes. Comparatively, the diagnostic program – besides having the cost associated for the diagnosis phase – it incorporates large amount of attic insulation, furnace, and window upgrades, which are subject to high upfront cost and slow paybacks. Therefore, the diagnostic program leads to larger savings per home but not as cost-effective as the prescriptive program.
Qualitative Analysis
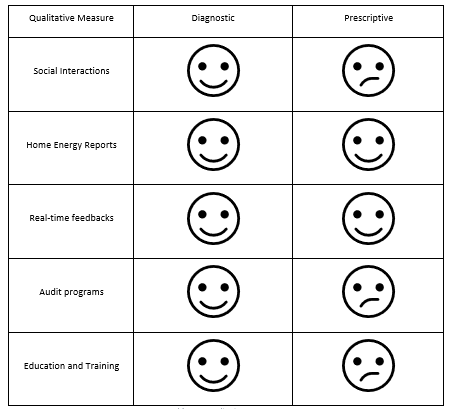
The qualitative analysis presented in Table 3 shows how different behavior programs respond to the different types of programs implemented. The five behavior programs have the opportunity to increase homes’ energy savings for the diagnostic programs. However, for the prescriptive approach, programs such as social interaction, auditing and education and training would not achieve the same benefits due to its intrinsic characteristics.
Conclusions
Both programs had the goal to reduce homes’ energy consumption while increasing residents overall comfort. While the diagnostic program had an average energy savings per installation which was five times higher when compared to the prescriptive program, the costs associated to the diagnostic program (costs per energy savings and costs per GHG saved) were also higher. Behavior programs have the purpose to complement technical programs by re-educating residents, specially in the diagnostic program, but some of them have little influence in the prescriptive program due to its characteristics.
References
[1] Nejat, P., Jomehzadeh, F., Taheri, M. M., Gohari, M., & Abd. Majid, M. Z. (2015). A global review of energy consumption, CO2 emissions and policy in the residential sector (with an overview of the top ten CO2 emitting countries). Renewable & Sustainable Energy Reviews, 43, 843-862
[2] Energy Efficiency Trends Analysis Tables. Retrieved from https://oee.nrcan.gc.ca/corporate/statistics/neud/dpa/menus/trends/analysis/tables.cfm on Oct 31, 2020.
[3] What is an energy efficient home? (2020, February 1). Retrieved from https://www.nrcan.gc.ca/energy-efficiency/energy-efficiency-homes/what-energy-efficient-home/20548 on Nov 20, 2020
[4] Documentation of Program Performance Metrics for Energy Efficiency Alberta
[5] Allcott, H. (2011). Social norms and energy conservation. Journal of Public Economics, 95(9-10), 1082-1095
[6] Schultz, P. W., Nolan, J. M., Cialdini, R. B., Goldstein, N. J., & Griskevicius, V. (2016;2007;). The constructive, destructive, and reconstructive power of social norms. Psychological Science, 18(5), 429-434
[7] Karlin, B., Zinger, J. F., & Ford, R. (2015). The effects of feedback on energy conservation: A meta-analysis. Psychological Bulletin, 141(6), 1205-1227.
[8] Billingsley, M., Stratton, C., & Martin Fadrhonc, E. (2016). Energy advisors: Improving customer experience and efficiency program outcomes.
[9] Behavior Change Programs: Status and Impact. (2016, October). Retrieved from https://www.aceee.org/sites/default/files/publications/researchreports/b1601.pdf on Oct 16, 2020
Contact

Bernardo Bordeira, bbordeira@yahoo.com
(604) 518-7082