DRAFT
Climate Change Challenges for Alpine Ski Resorts in Western USA
by MICHAEL PIDWIRNY, KALIM BAHBAHANI, SHANE PEDERSEN and JACOB GOODE
By the end of the 21st century, the Intergovernmental Panel on Climate Change (IPCC) predicts that the continued emission of greenhouse gases by human activity will significantly increase surface air temperatures and change patterns of precipitation on our planet at local, regional, and global spatial scales. Being able to predict how climate change will influence socio-economic systems is important to assess potential impact to humans. Understanding this impact will also allow for the development of effective adaptation and mitigation strategies to minimize the negative effects of this human caused climate change.
Analysis of the climatic impacts associated with human caused climate change at alpine ski resorts can be accomplished using recently developed techniques which mathematically interpolate measurements from weather stations to other nearby locations. The research presented here uses such spatially interpolated climate data generated by a software database known as ClimateWNA (Wang et al., 2012). This climate software database can produce data for the historical period 1901-2016 and future climate forecasts for the 21st century generated by a subset of fifteen climate simulation models used in the 5th Assessment Report of the IPCC.
Alpine ski resorts in western USA receive considerable year-to-year variation in surface air temperature and snowfall during the winter season (December, January, and February). This variability can sometimes hide trends when the data record is short. Figure 1 illustrates the variation in winter mean temperature for Stevens Pass Ski Resort located about 95 kilometers east of Seattle, Washington for the period 1901 to 2016. Over this 116-year period, we can observe an obvious warming trend for winter mean temperature of about 1.8° C. It is important to note that the winter mean temperature of 2015 was warm enough to cause this resort to close down about 43 days earlier than normal (Catchpole and Nile, 2015).
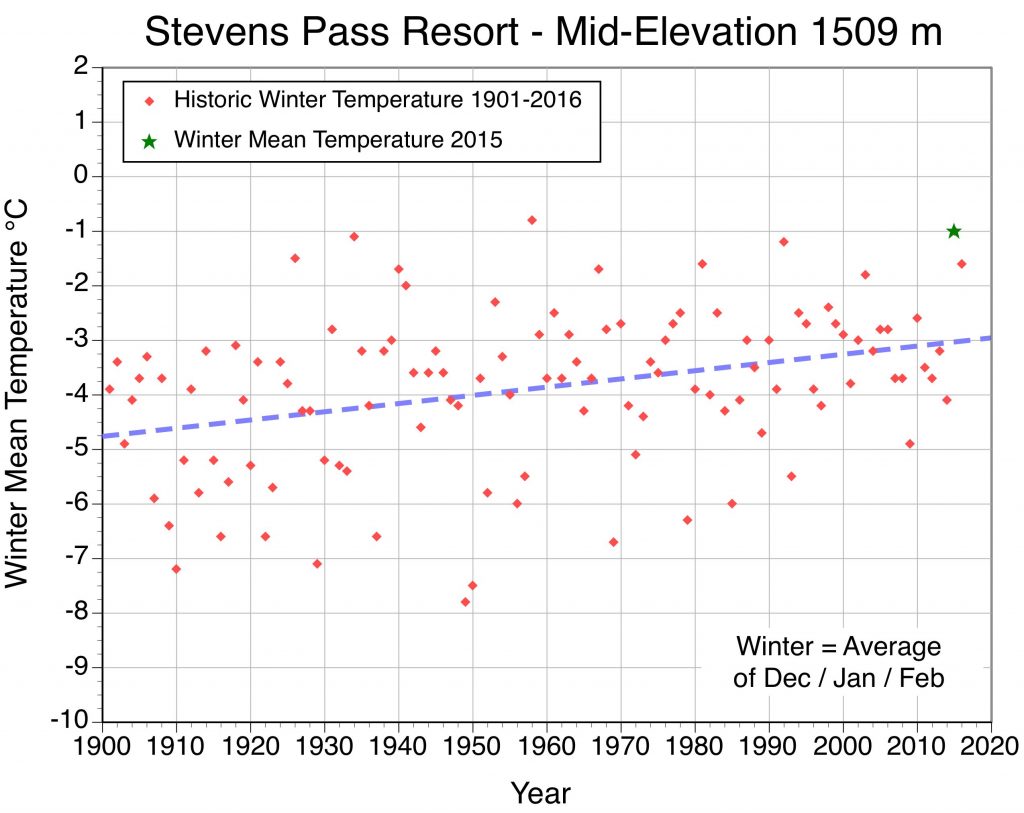
Figure 1. Observed winter (December, January, and February) mean temperatures from 1901 to 2016 at Stevens Pass Ski Resort, elevation 1509 meters, Latitude 47.744436, Longitude 121.089169. The segmented blue line describes the best-fit trend line through the 116 yearly observations. This graph also identifies with a green star the year 2015, one of the warmest winters in the history of Stevens Pass Ski Resort.
Trying to forecast how future climate change during the 21st century will affect other resorts in western USA can also be accomplished by using ClimateWNA. However, the exact nature of this climate change is somewhat uncertain because it will depend on our future efforts to reduce greenhouse gas emissions into the atmosphere. Table 1 describes the estimated future atmospheric concentrations of the main greenhouse gases under a best-case (called RCP4.5) and a worst-case (called RCP8.5) scenario available in ClimateWNA. The best-case scenario correlates to a warming of the Earth’s surface globally of about 2.0° C relative to pre-industrial greenhouse gas levels. Many climate scientists believe this scenario can be achieved if nations act soon to reduce emissions primarily through reforestation, other carbon capture techniques, increased energy-use efficiency and switching to renewable based energy generation. The worst-case scenario corresponds to a future pathway where greenhouse gas emissions continue to increase exponentially and average global temperature becomes between 3.0 to 5.0° C warmer by 2100.

Table 1. Historical and future forecasted concentrations of carbon dioxide, methane and nitrous oxide in the atmosphere.
Figures 2 and 3 describe historical and future forecasted changes in winter mean temperature and winter snowfall for twelve ski resorts with latitudes between 40 and 49° along a longitudinal gradient from the west coast of Washington and Oregon to the mountains of Montana and Wyoming. Table 2 describes the latitude and longitude coordinates of these resorts and their mid-elevation. For winter mean temperature, we can see the selected resorts have already experienced between 1 to 2° C of warming from 1901-1930 to 1981-2010.
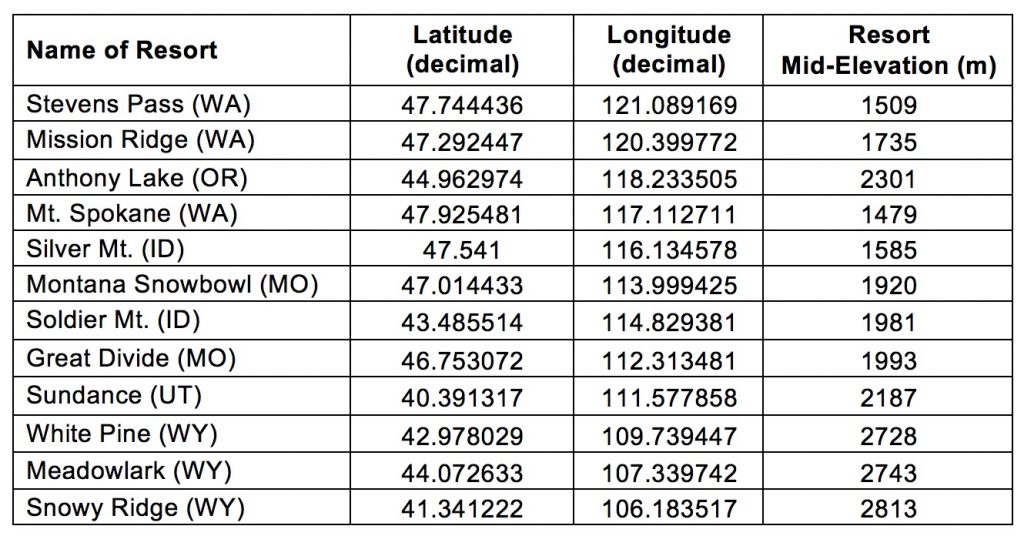
Table 2. Latitude, longitude and mid-elevation of the twelve ski resorts found between latitude 40 and 49° North.
Figure 2 also shows the anticipated future warming for the best-case and worst-case greenhouse gas emission scenarios. Under the best-case scenario, all of the resorts will see their mean winter temperature warm up to about 2.0 to 3.0° C by 2071-2100. The worst-case scenario will see more than half of the resorts studied along this longitudinal gradient warm to temperatures above freezing. The interior resorts of Montana and Wyoming will have mean winter temperatures between about -1.0 and -3.0 below zero by 2071-2100 with the worst-case scenario. Wyoming resorts, White Pine and Snowy Range will have winter mean temperatures under the worst-case scenario that are similar to the current conditions being experienced at Stevens Pass in Washington state.
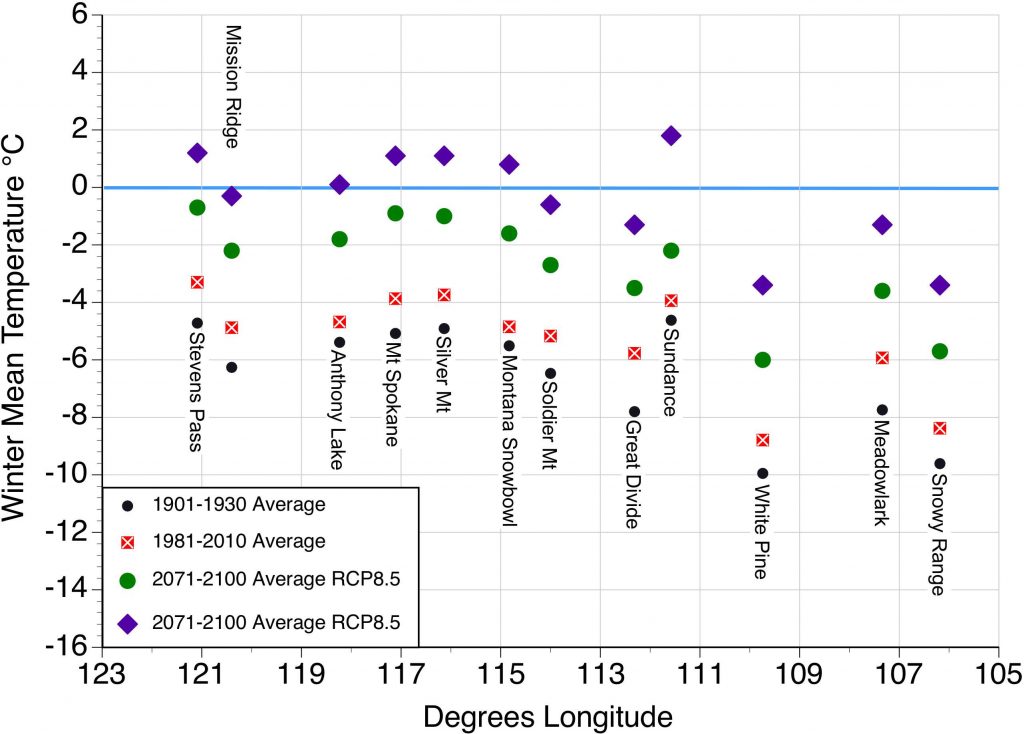
Figure 2. Historic and future forecasted changes in winter (December, January, and February) mean temperature for twelve selected ski resorts in western USA with a latitude between 40 and 49° North. Values displayed based on data generated by ClimateWNA for the mid-elevation of each ski resort.
Figure 3 suggests that ski resorts in Washington, Oregon, Utah and Idaho will face significant declines in winter snowfall in the future for both the best-case and worst-case scenarios. More interior ski resorts in Wyoming and Montana will experience no change or slight increases in snowfall under the best-case scenario relative to the 1981-2010 average. The worst-case scenario will cause a small decline in winter snowfall for Montana Snowbowl, Great Divide, White Pine and Meadowlark, and no change at Snowy Range relative to the 1981-2010 average.
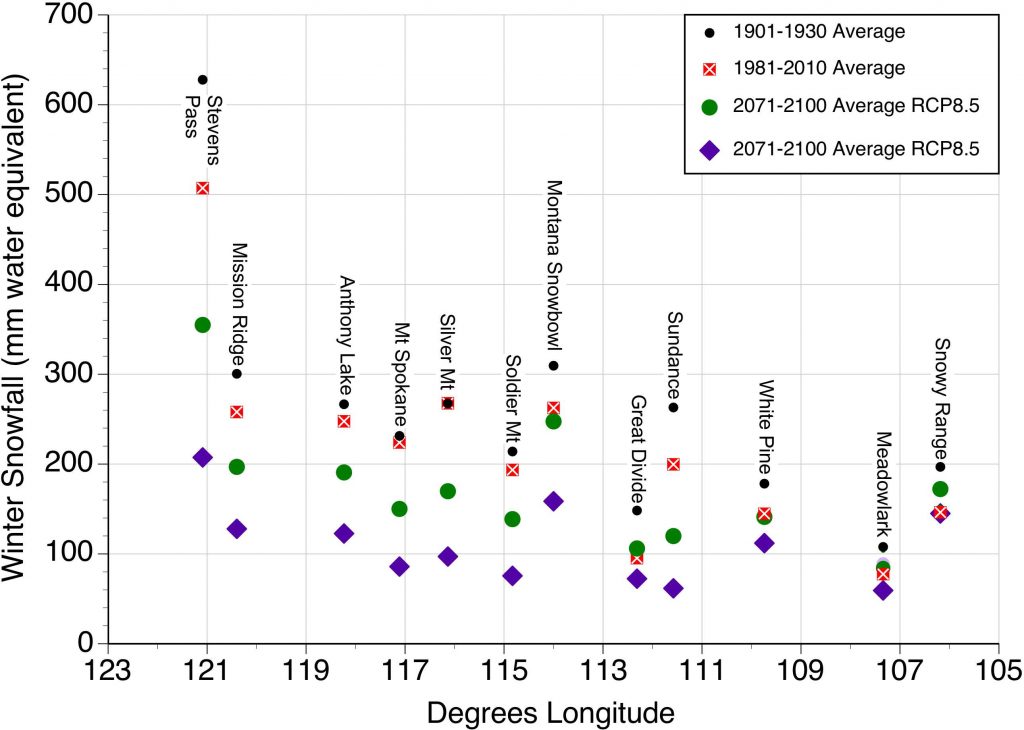
Figure 3. Historic and future forecasted changes in winter (December, January, and February) snowfall for twelve selected ski resorts in western USA with a latitude between 40 and 49° North. Values displayed based on data generated by ClimateWNA for the mid-elevation of each ski resort.
Figures 4 and 5 describe historical and future forecasted changes in winter mean temperature and winter snowfall for twelve ski resorts with latitudes between 30 and 39° along a longitudinal gradient from the west coast to western New Mexico. For winter mean temperature, we can see the selected resorts have already experienced between 1 to 2° C of warming from 1901-1930 to 1981-2010.
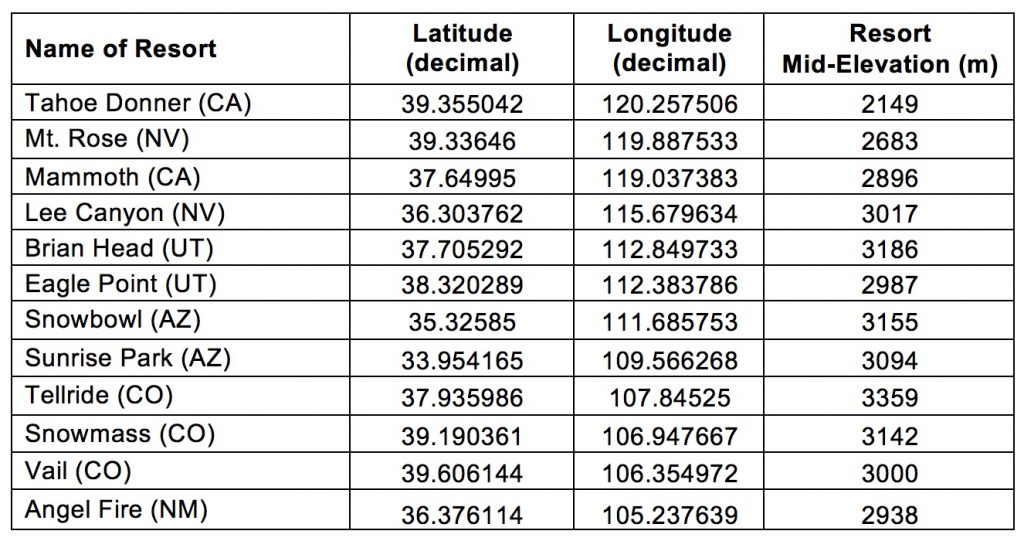
Table 3. Latitude, longitude and mid-elevation of the twelve ski resorts found between latitude 30 and 39° North.
Comment
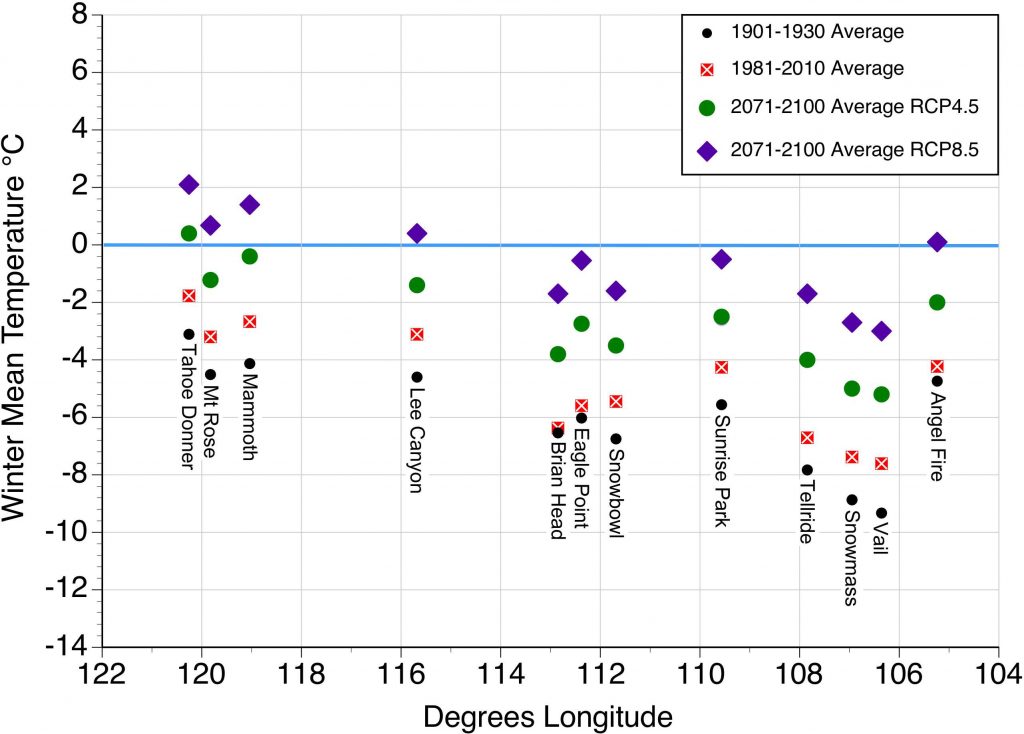
Figure 4. Historic and future forecasted changes in winter (December, January, and February) mean temperature for twelve selected ski resorts in western USA with a latitude between 30 and 39° North. Values displayed based on data generated by ClimateWNA for the mid-elevation of each ski resort.
Comment
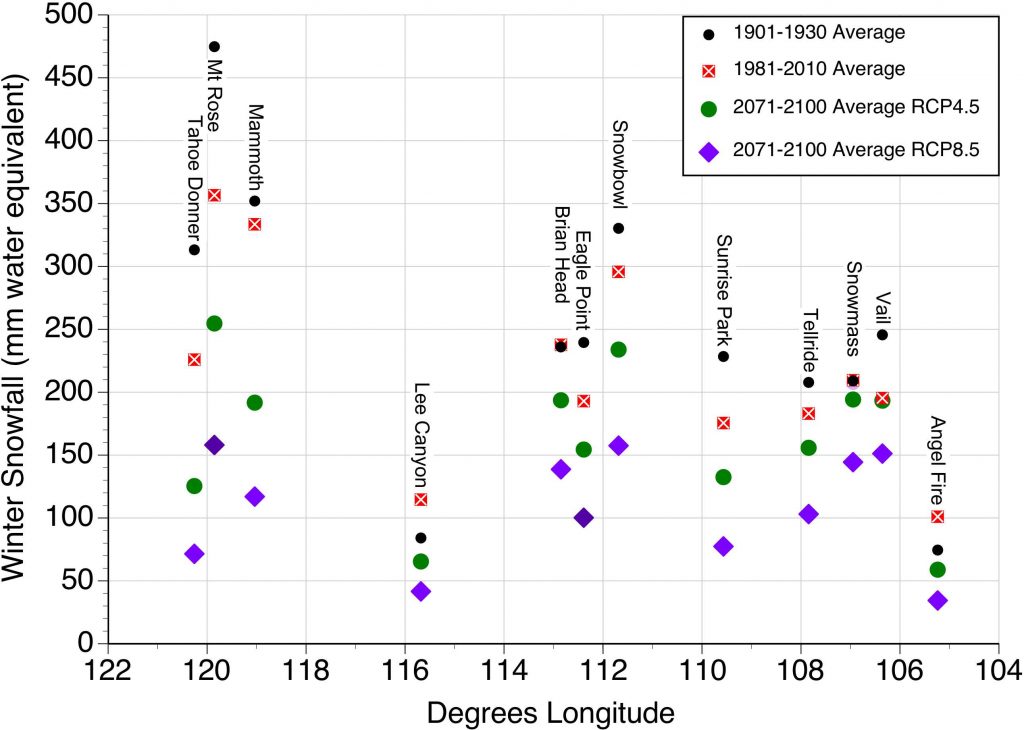
Figure 5. Historic and future forecasted changes in winter (December, January, and February) snowfall for twelve selected ski resorts in western USA with a latitude between 30 and 39° North. Values displayed based on data generated by ClimateWNA for the mid-elevation of each ski resort.
In conclusion, human caused climate change in the near future is predicted to result in warmer winter temperatures and changes in snowfall for the alpine ski resorts of western USA. How detrimental these changes will be to the ski industry in western USA depends on whether governments can implement meaningful reductions in the future emissions of greenhouse gases.
References
Catchpole, D. and A. Nile. 2015. The future of Washington’s ski areas is not looking so cool. Herald Net, article published November 28, 2015. http://www.heraldnet.com/news/the-future-of-washingtons-ski-areas-is-not-looking-too-cool/.
Wang, T., Hamann, A., Spittlehouse, D., and Murdock, T. N. 2012. ClimateWNA – High-resolution spatial climate data for western North America. Journal of Applied Meteorology and Climatology 61: 16-29.