Analysis and Comparison of the Temperature and Snowfall Conditions for the Winters of 2014/15 and 2015/16 at Three Ski Resorts in British Columbia, Canada
by MICHAEL PIDWIRNY and SHANE PEDERSEN
Introduction
Many ski resorts located close to the west coast of Canada experienced extremely poor weather conditions during the winter of 2014/15. During this year, a persistent area of high pressure created “the Blob” in the North Pacific Ocean, which influenced weather patterns on the west coast of North America producing very mild temperatures inland (Bond et al., 2015). Further, for many coastal ski resorts winter precipitation that normally arrives in the form of snow, instead fell as rain on many occasions. In Western Canada, ski resorts saw an 18% decrease in skier visits in 2014/15 relative to the average of the previous 8 years according to the Canada West Ski Areas Association. NOAA seasonal forecasts for the winter of 2015/16 indicated another mild winter because of a developing strong El Niño event. Previous research suggests that El Niño events normally produce relatively warm winters with below-average snowfall for ski resorts in souther British Columbia, Canada (Pidwirny and Mei, 2014) Despite the NOAA forecast ski resorts in Western Canada experienced a very good ski season in 2015/16.
Objectives
This research examines the climate characteristics (temperature and snowfall) of the ski seasons of 2014/15 and 2015/16 in detail for three ski resorts in British Columbia, Canada: Whistler-Blackcomb, Cypress Mountain, and Big White. These two years were also compared to the previous five ski seasons between 2009/10 and 2013/14.
Methods
1) Three ski resorts were examined in this study: Whistler-Blackcomb (latitude 50.10375° N, longitude 122.91353° W), Cypress Mountain (latitude 49.40093° N, longitude 123.19856° W), and Big White (latitude 49.73556° N, longitude 118.95083° W). The elevation used for each resort was its midpoint.
2) Data for this study came from Snow-Forecast.com, a web-based company that provides tailor-made weather forecasts for ski resorts around the world using NOAA weather model forecasts. From Snow-Forecast.com, we mined archived hindcast data that was available at the daily level from November 1 to March 31. Snow-Forecast.com produces a morning, afternoon, and night forecast for each day at bottom, middle, and top elevations of the ski resorts. Continuous climate data only went back to the fall of 2009.
3) Mean daily temperature was determined by averaging daily minimum and maximum values. This data was then graphed on a line graph (top graphs in Figures 1, 2 and 3). Mean daily temperature values were also graphed using a 11-day moving average to better see the patterns and trends (middle graphs in Figures 1, 2 and 3). The climate of 2012/13 was also used for comparisons because its Southern Oscillation Index for the period December to March is close to zero. This value suggests this year was typical or in between El Niño and La Niña extremes. Average temperatures were calculated from the beginning of November to the end of March for 2009/10 to 2015/16 (Table 1).
4) Snowfall data from November to March was plotted in a cumulative line graphs (bottom graphs in Figures 1, 2 and 3). These 2 years were then compared to the snowfall data from years between 2009/10 to 2013/14.
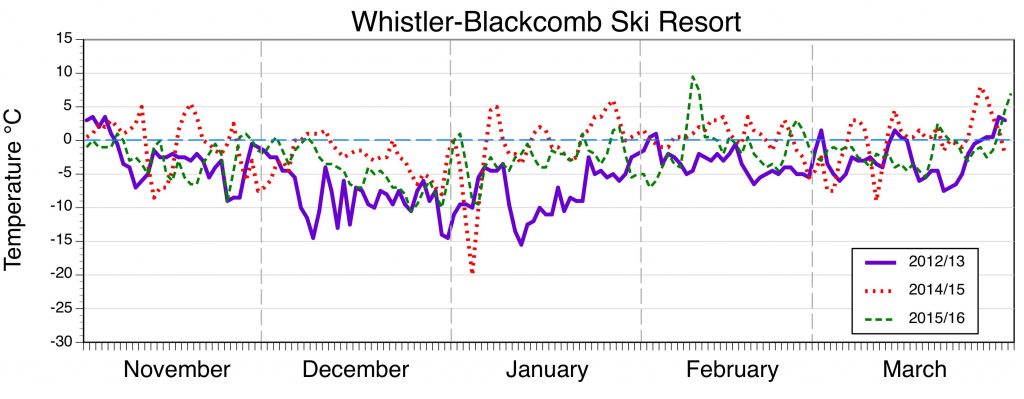
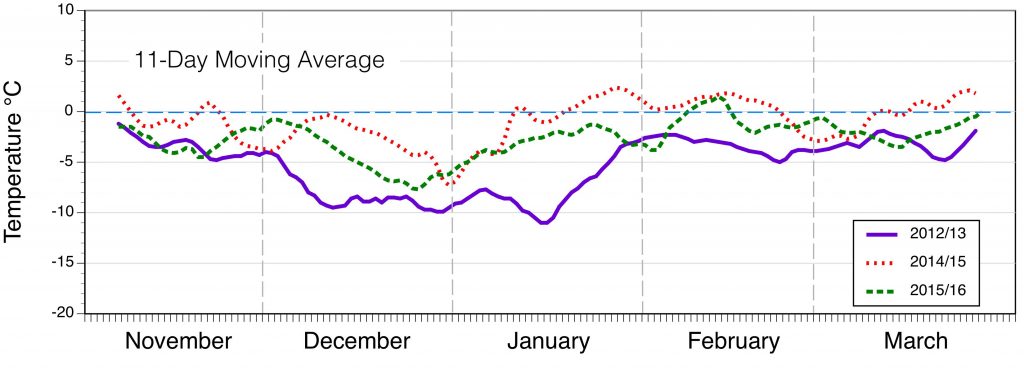
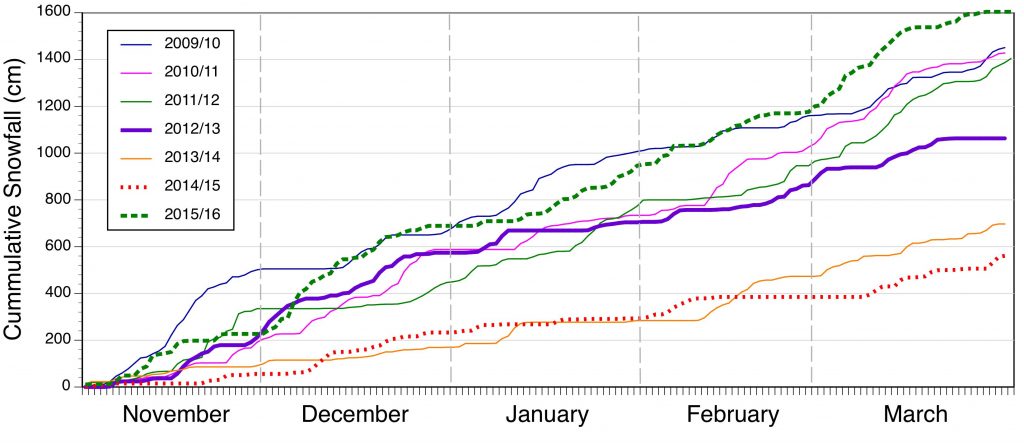
Figure 1. Climate data for Whistler-Blackcomb Ski Resort for 2012/13, 2014/15, and 2015/16 ski seasons. Top graph describes mean daily temperature (°C) for the months of November to March. Middle graph shows an 11-year moving average applied to the mean daily temperature data. Bottom graph shows cumulative snowfall (cm).
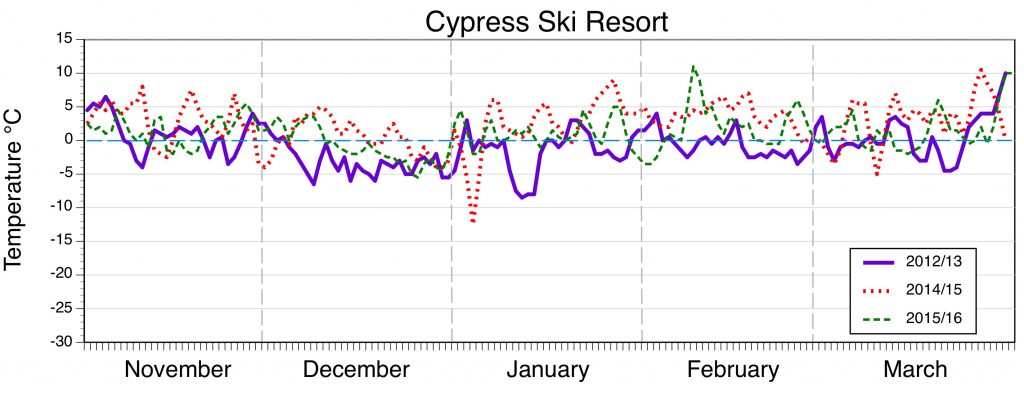
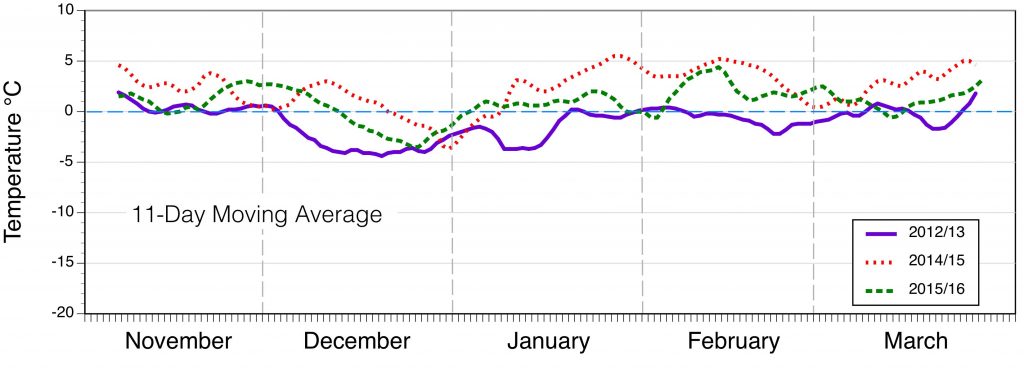
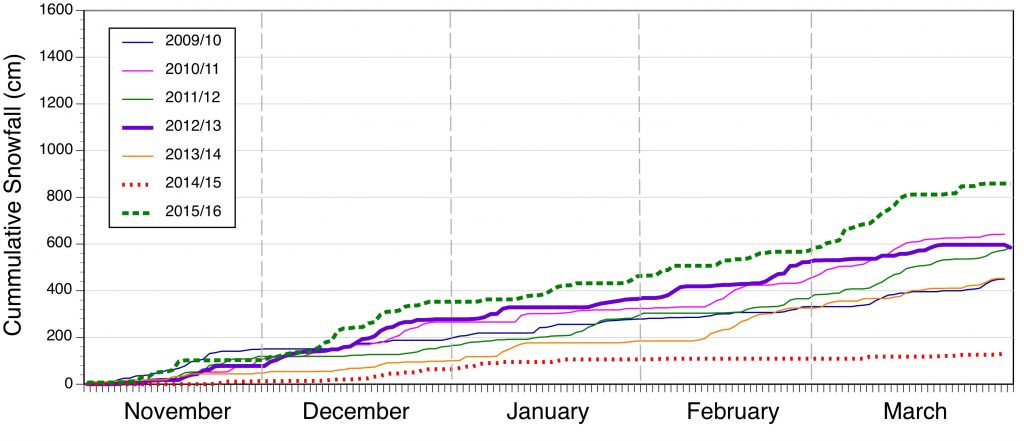
Figure 2. Climate data for Cypress Mountain Ski Resort for 2012/13, 2014/15, and 2015/16 ski seasons. Top graph describes mean daily temperature (°C) for the months of November to March. Middle graph shows an 11-year moving average applied to the mean daily temperature data. Bottom graph shows cumulative snowfall (cm).
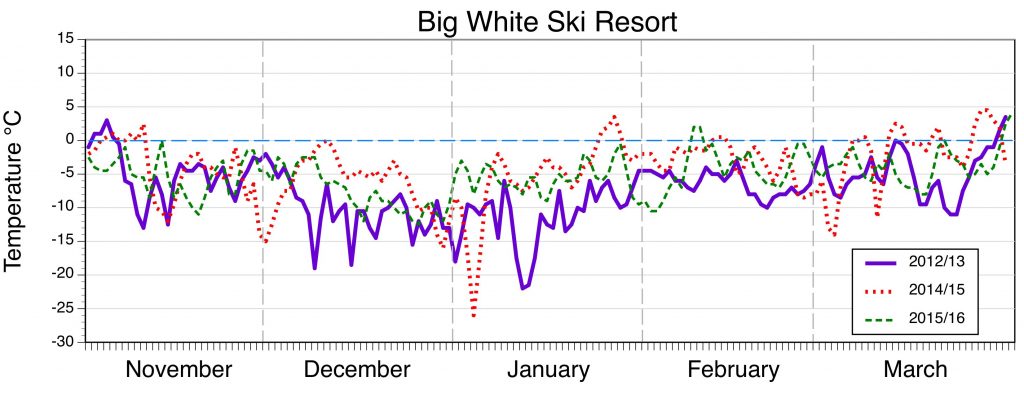
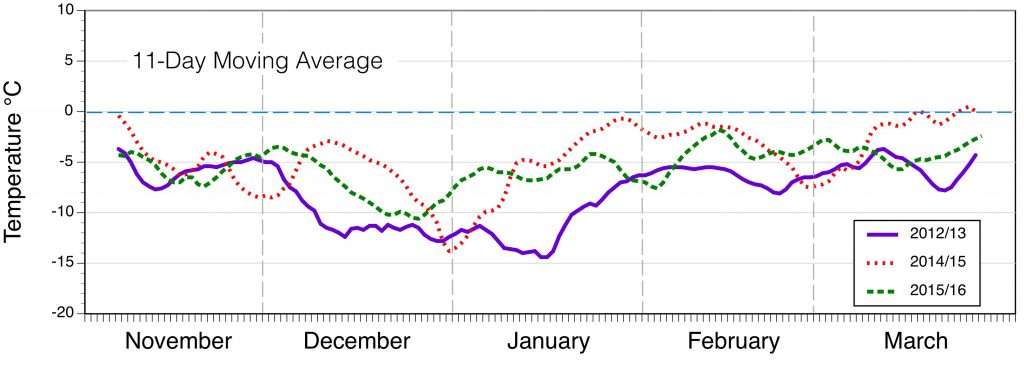
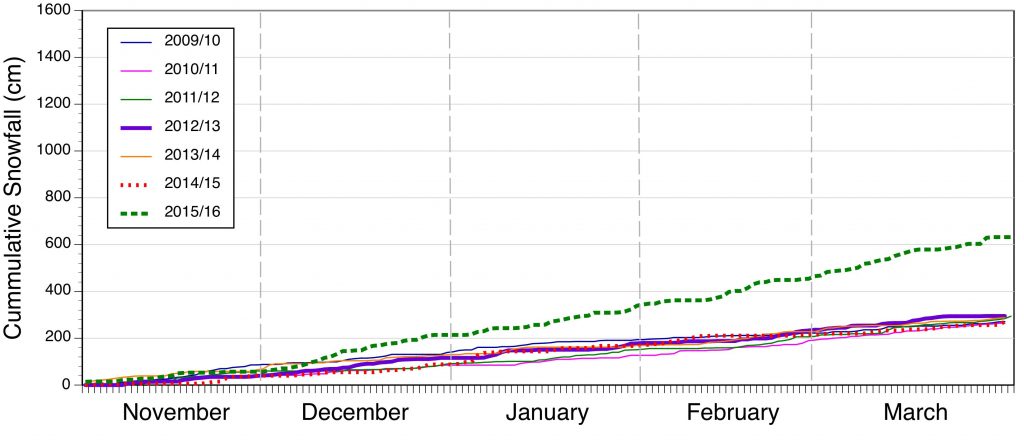
Figure 3. Climate data for Big White Ski Resort for 2012/13, 2014/15, and 2015/16 ski seasons. Top graph describes mean daily temperature (°C) for the months of November to March. Middle graph shows an 11-year moving average applied to the mean daily temperature data. Bottom graph shows cumulative snowfall (cm).
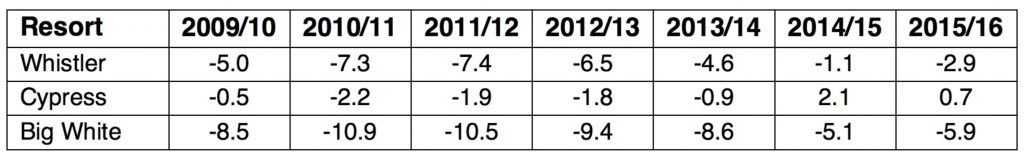
Table 1: Average temperatures from November to March for 2009/10 to 2015/16.
Results and Discussion
The Blob weather event of 2014/15 produced much warmer winter conditions than the strong El Niño of 2015/16 for the three ski resorts examined (Table 1). According to the 11-day moving average graphs, the winter of 2012/13 had sustained relatively cold temperatures for about 6 weeks from the beginning of December to the middle of January at all three resorts (Figures 1, 2 and 3). These same graphs show that 2014/15 and 2015/16 had periods of sustained cold temperatures that were much shorted in length and severity occurring from late December to early January. The 2014/15 season had an extensive period of exceptionally warm temperatures that lasted for most of January and February when compared to 2012/13 and 2015/16. For Whistler-Blackcomb and Cypress ski resorts, snow accumulations during 2014/15 were the lowest of the seven years examined. Big White’s snow accumulation for 2014/15 was not much different from five of the six other years studied. More specifically, end of season snowfall accumulations decreased by about 78% for Cypress, 47% for Whistler-Blackcomb, and just 8% for Big White in 2014/15 when compared to 2012/13. In contrast, the winter of 2015/16 saw end of season snowfall accumulation increases of 44% for Cypress, 51% for Whistler, and 114% for Big White relative to the year of 2012/13. In conclusion, cooler temperatures and significantly higher snowfall are responsible for the much better than expected ski conditions in 2015/16 when compared to 2014/15.
References
Bond, N.A., M.F. Cronin, H. Freeland, and N. Mantua. 2015. Causes and impacts of the 2014 warm anomaly in the NE Pacific. Geophys. Res. Letters 42: 3414–3420, doi:10.1002/2015GL063306.
Pidwirny, Michael and Alexandra Mei Turney. 2014. The Influence of El Niño and La Niña on Winter Climate Conditions at 138 Ski Resorts in Western North America. Poster presented at the American Geophysical Union Annual Conference. San Francisco, December 15-19, 2014.