The Influence of El Niño and La Niña on Winter Climate Conditions at 156 Ski Resorts in Western North America
by MICHAEL PIDWIRNY, KALIM BAHBAHANI and ALEXANDRA MEI TURNEY
Introduction
Winter weather at ski resorts in western North America varies annually. However, several large scale climate oscillations have been shown to significantly influence temperature and snowfall in mountain environments globally via teleconnections (Lehr et al., 2012). For western North America, El Niño and La Niña are the phenomena thought to have the greatest influence on winter weather. Accurately determining how El Niño and La Niña events influence winter snowfall and temperature would be beneficial to the operation of ski resorts in western North America as these weather events can be predicted several months in advance of occurring.
Objectives
This research examines the effect of El Niño and La Niña on the climate at 156 ski resorts in western North America. ClimateBC and ClimateNA were used to produce high quality interpolated climate data based on historical records for mid-slope elevation of the ski resorts in this study (Wang, Hamann, Spittlehouse, and Aitken, 2006; Wang, Hamann, Spittlehouse, and Carroll, 2016). This data was then statistically analyzed with linear correlation analysis with Southern Oscillation Index (SOI) data, which measures the strength of El Niño and La Niña events (Trenberth, 1984). Correlation output was grouped based on statistical significance and then mapped to identify possible spatial patterns.
Methods
1) Using the historical climate data found in ClimateBC and ClimateNA, monthly values for snowfall and average temperature were generated for the mid-slope elevation of the 156 ski resorts for the months of January, February and March. From this data, composite values were computed by summing the three months analyzed for each of the two variables. December was not included in this analysis because the climatic influence of El Niño and La Niña typically begins in January (D’Aleo, 2002).
2) Correlation analysis was used to measure the linear cause and effect relationship between the two climate dependent variables and the summed composite of the monthly standardized Southern Oscillation Index (SOI) over the same period. Values for SOI came from the National Center for Atmospheric Research (NCAR, 2016). All correlation coefficients (r) were determined by analyzing the variables for the time period 1901-2015.
3) The correlation coefficients for the 156 resorts and two climate variables analyzed were then mapped using ARCGIS geographic information system software to display possible spatial patterns across the area studied. Different map symbols were used to identify whether the correlation coefficient was positive or negative, and whether it fell within four levels of statistical significance: P < 0.05 (r = > 0.184 to 0.240 and < -0.184 to -0.240); P < 0.01 (r = > 0.240 to 0.303 and < -0.240 to -0.303); P < 0.001 (r = > 0.303 to 0.355 and < -0.303 to -0.355); and P < 0.0001 (r = > 0.355 and < -0.355). Correlation coefficients with probability values equal to P > 0.05 (r = 0.184 to -0.184) were considered not significant.
Results and Discussion
Figures 1 and 2 below show the generated maps for the correlation analysis output for the variables snowfall and average temperature for the 156 ski resorts studied.
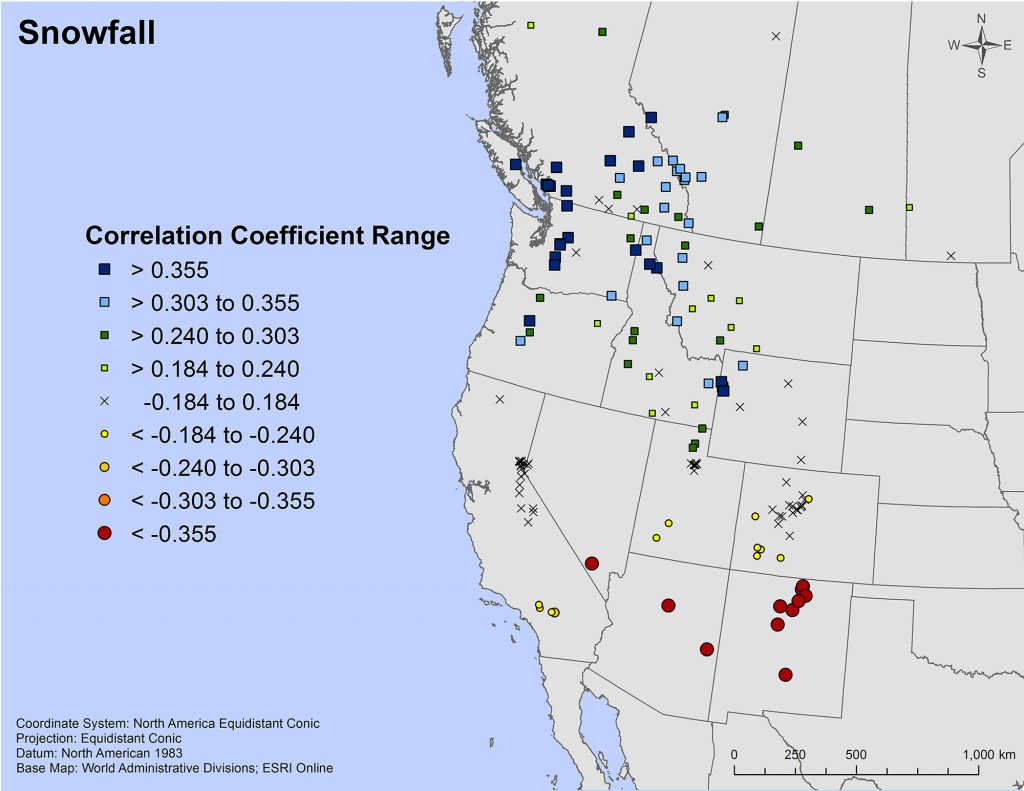
Figure 1. Mapped correlation analysis output for the variable snowfall for the combined months of January, February, and March.
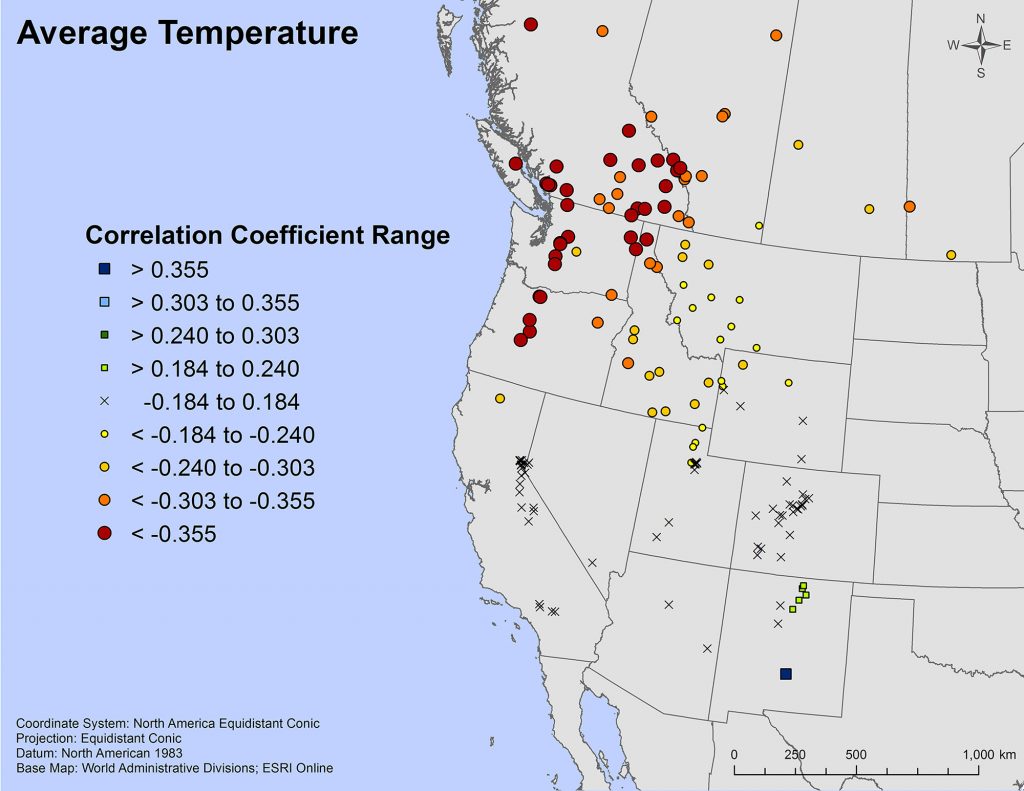
Figure 2. Mapped correlation analysis output for the variable average mean temperature for the combined months of January, February, and March.
Snowfall was found to be higher during La Niña and lower during El Niño events for most resorts above 42° North latitude. Further, the strength of correlations mostly decreased with distance from the coast. In contrast, resorts in southern California, Nevada, southern Utah, New Mexico, Arizona, and southern Colorado had more snowfall with El Niño and less during La Niña’s. An area of no correlation was found separating these two zones.
For average temperature, resorts above 42° North latitude were generally warmer during El Niño and colder during La Niña. Once again, the strength of the correlation generally decreased with proximity from the coast. A pocket of resorts in New Mexico saw colder temperatures during El Niño and warmer temperatures during La Niña. Again, a zone of no correlation was found separating these two regions.
The results of this study are corroborated by previous research on how El Niño and La Niña influence temperature and snowfall patterns in western North America (Clark et al., 2001; D’Aleo, 2002; Castello and Shelton, 2004; Larkin and Harrison, 2005; Mote, 2006; Lehr et al., 2012).
References
Castello, Amy F. and M.L. Shelton. 2004. Winter precipitation on the US Pacific coast and El Niño–Southern Oscillation events. International Journal of Climatology 24(4): 481-497.
Clark, M.P., M.C. Serreze and G.J. McCabe. 2001. Historical effects of El Niño and La Niña events on the seasonal evolution of the montane snowpack in the Columbia and Colorado River Basins. Water Resources Research 37, 741-757.
D’Aleo, J.S. 2002. The Oryx Resource Guide to El Niño and La Niña. Oryx Press, Wesport, Connecticut.
Larkin, N.K. and D.E. Harrison. 2005. Global seasonal temperature and precipitation anomalies during El Niño autumn and winter. Geophysical Research Letters 32(16), L16705, doi:10.1029/2005GL022860.
Lehr, C., P.J. Ward, and M. Kumma. 2012. Impact of large scale climate oscillations on snowfall related climate parameters in the world’s major downhill ski areas: A review. Mountain Research and Development, 32(4):431-445.
Mote, P.W. 2006. Climate-driven variability and trends in mountain snowpack in western North America. Journal of Climate 19(23): 6209-6220.
NCAR. 2016. Southern Oscillation Index (SOI). http://www.cgd.ucar.edu/cas/catalog/climind/soi.html
Trenberth, K.E. 1984. Signal versus noise in the Southern Oscillation. Monthly Weather Review 112: 326-332.
Wang, T., A. Hamann, D. Spittlehouse and C. Carrol 2016. Locally downscaled and spatially customizable climate data for historical and future periods for North America. PLos ONE 11(6) doi:10.1371/journal.pone.0156720.
Wang, T., A. Hamann, D. Spittlehouse and S.N. Aitken. 2006. Development of scale-free climate data for western Canada for use in resource management. International Journal of Climatology 26: 383-397.