The Year Without a Ski Season: An Analysis of the Winter of 2015 for Three Ski Resorts in Western Canada Using Historical and Simulation Model Forecasted Climate Data
by MICHAEL PIDWIRNY, JACOB GOODE and SHANE PEDERSEN
Introduction
The winter of 2015 (Dec 2014 and Jan and Feb 2015) will go down as “the year without a ski season” for many ski resorts located near the west coast of Canada and the USA. During this winter season, a large area of the eastern North Pacific Ocean had extremely high sea surface temperatures. This high sea surface temperature event was given the name the Blob and it influenced weather patterns on the west coast of North America (Bond et al., 2015 and Kintisch, 2015) producing very mild winter temperatures inland (Figure 1). Further, in alpine environments precipitation that normally arrives in the form of snow, often instead fell as rain. This research examines the climate characteristics of the winter of 2015 in greater detail for three ski resorts in British Columbia, Canada: Mount Washington, Cypress Mountain and Hemlock Valley. The climate of this particular warm year is also compared to historical climate data (individual years between 1901-2013 and the 1961-1990 average) and to climate model future predictions for 2025, 2055, and 2085.
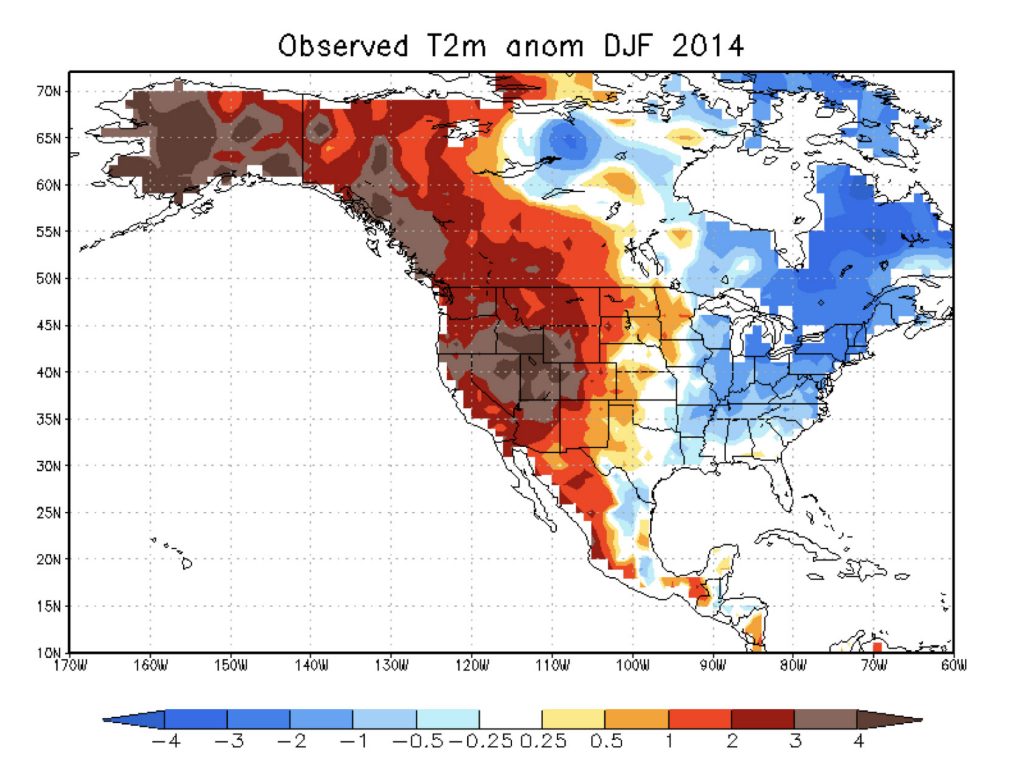
Figure 1. Observed surface temperature anomalies across North America in degrees Celsius during the winter of 2015 (December 2014 and, January and February 2015) relative to average values for the normal period 1981-2010 (Source, NOAA).
Objectives
To determine severity of the climate associated with the winter of 2015 relative to three ski resorts in coastal British Columbia, Canada relative to historical patterns and to the RCP8.5 future predictions from fifteen general circulation models (GCMs) used in the fifth IPCC Assessment Report.
Methods
1) Three Canadian ski resorts were examined in this study: Mount Washington (latitude 49.74687 N, longitude 125.29916 W), Cypress Mountain (latitude 49.40093 N, longitude 123.19856 W), and Hemlock Valley (latitude 49.38018 N, longitude 121.93564 W). The elevation used for each resort was its midpoint.
2) This research uses a high quality spatially interpolated climate dataset program known as ClimateBC (Hamann and Wang, 2005 and Wang et al., 2006) to determine directly calculated and derived climate variables for the ski resort locations based on latitude, longitude and elevation. ClimateBC downscales and integrates PRISM monthly data for the period 1961-1990 (Daly et al., 2002), historical datasets for the period 1901-2013 (Mitchell and Jones, 2005) and future climate datasets (2020s, 2050s and 2080s) generated by fifteen general circulation models (GCMs) used in the fifth IPCC Assessment Report.
3) The following historical climate data (1901-2013) was generated from ClimateBC and used to access the severity of the winter (December, January and February) of 2015 at the three ski resorts: monthly and winter season degree days < 0°C (cumulative sum of daily mean temperature departures below 0°C) and monthly mean temperature.
4) Monthly mean temperature historical data and measurements for the 2015 season were obtained from nearby Environment Canada meteorological stations located in Comox (for Mt. Washington), Vancouver (for Cypress) and Agassiz (for Hemlock).
5) Estimates for monthly mean temperatures (December, January and February), and monthly and winter season monthly degree days < 0°C at the midpoint of each ski resort were determined using regression modelling techniques. Table 1 describes the coefficients of determination (r2) between historical data from the meteorological stations (X) and the historical data (Y) generated by ClimateBC for the ski resorts.
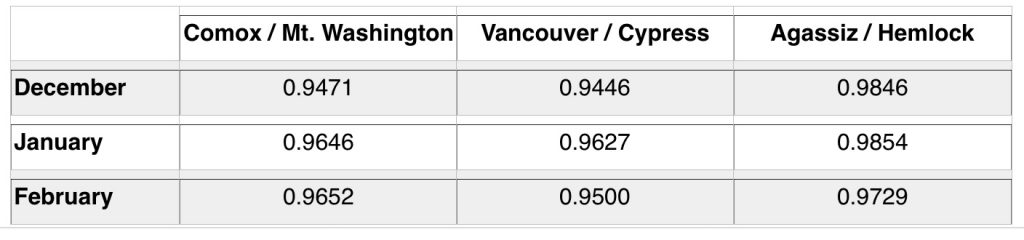
Table 1. Linear regression calculated coefficients of determination (r2) between meteorological station data and ClimateBC ski resort data. For all values P < 0.001.
Results and Discussion
Figures 2, 3 and 4 describe the December, January and February monthly values of degree days < 0°C for Mount Washington, Cypress Mountain, and Hemlock Valley ski resorts. Also plotted on these graphs are the 1961-1990 average values with the error bars equal to one standard deviation. For all three resorts, December (2014) temperatures deviated about one standard deviation warmer than the 1961-1990 average. January temperatures were slightly more than 1 standard deviation warmer. By February, temperatures were almost 2 standard deviations warmer. During this winter season, warm temperatures and poor snow accumulations caused Mount Washington and Hemlock Valley ski resorts to not open at all during the 2015 ski season. Cypress Mountain had sporadic operations during January and then finally had to close down for the season because of lack of snow after the first week of February.
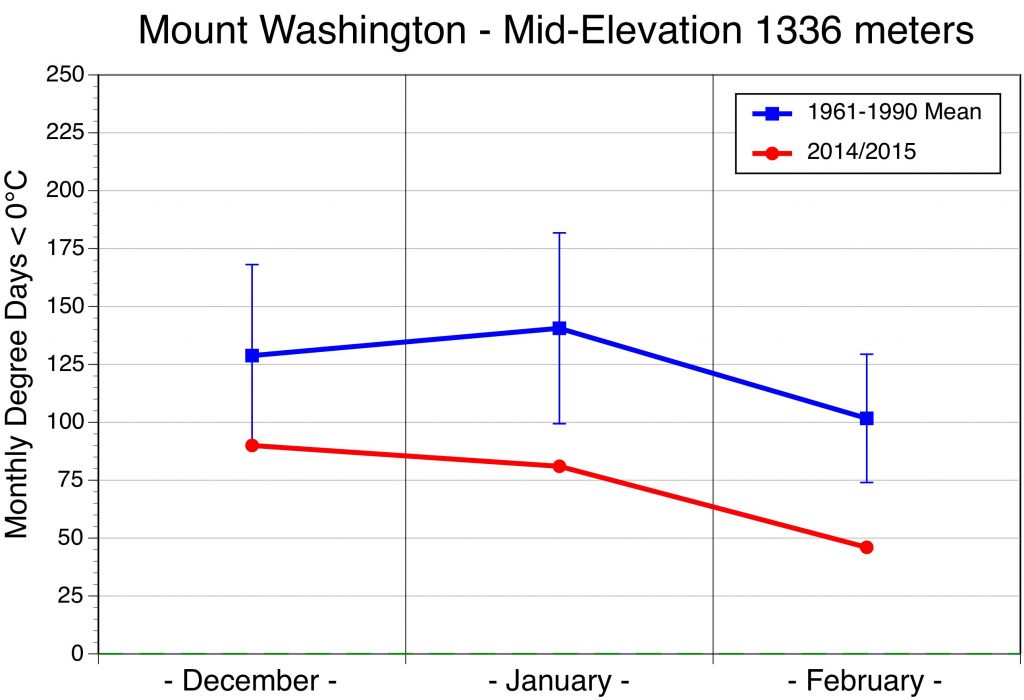
Figure 2. Monthly values of degree days <0°C for Mount Washington during the winter of 2015. Also shown is 1961-1990 average values with the error bars equal to 1 standard deviation.
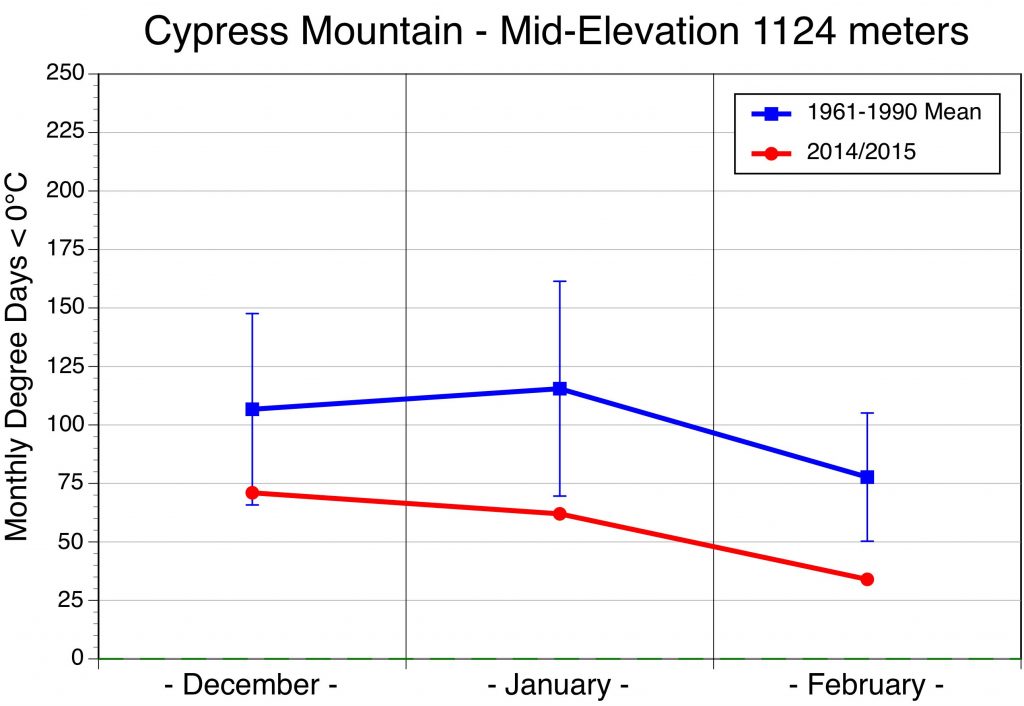
Figure 3. Monthly values of degree days <0°C for Cypress Mountain during the winter of 2015. Also shown is 1961-1990 average values with the error bars equal to 1 standard deviation.
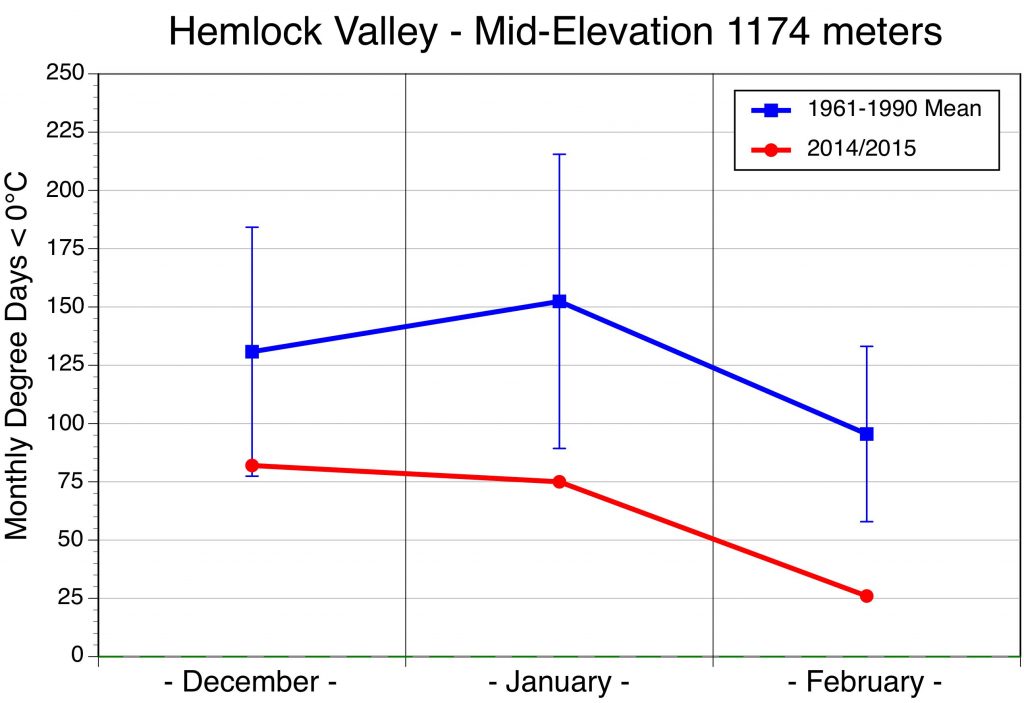
Figure 4. Monthly values of degree days <0°C for Hemlock Valley during the winter of 2015. Also shown is 1961-1990 average values with the error bars equal to 1 standard deviation.
Figures 5, 6 and 7 plot an estimate of winter degree days < 0°C for 2015 relative to the historical data (1901-2013) and IPCC AR5 climate model future forecasted values for the RCP8.5 scenario. For all three resorts, the winter of 2015 proved to be warmer than any individual year in the 113-year period from 1901 to 2013. Statistically significant best-fit lines (P < 0.05) suggest a historical trend of warming temperatures for all three resorts for the periods 1901-2013 and 1971-2013. Further, this warming trend has become steeper since 1971. The extrapolation of the 1971-2013 trend line to 2025 suggests rough congruence with the average of the forecasts from the fifteen climate models for that particular year. Interpolations involving the average of multi-model ensemble future forecasts indicate that the climate associated with winter of 2015 could become the average normal for these resorts in only 35 to 45 years under the RCP8.5 emission scenario.
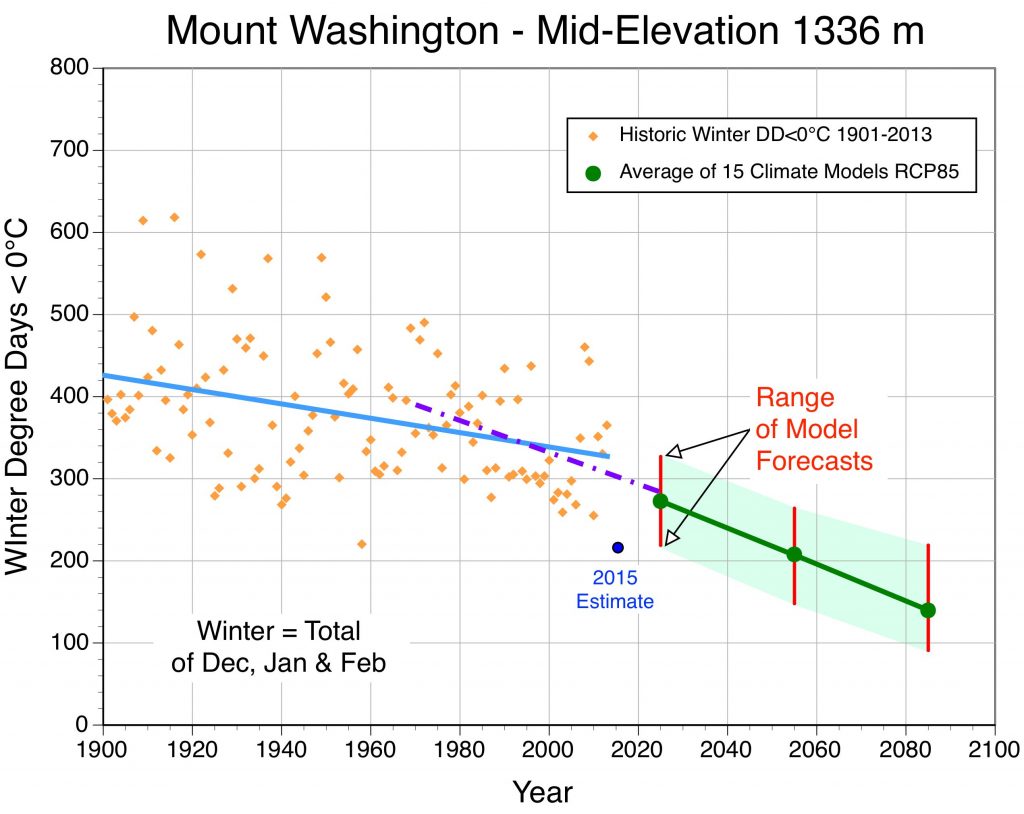
Figure 5. Comparison of the 2015 winter degree days <0°C estimate to historical data (1901-2013) and RCP8.5 climate model predictions for 2025, 2055 and 2085 for Mt. Washington. Best-fit linear regression trend lines are displayed for the historical data for the periods 1901-2013 (blue line) and 1971-2013 (purple dot dash line).
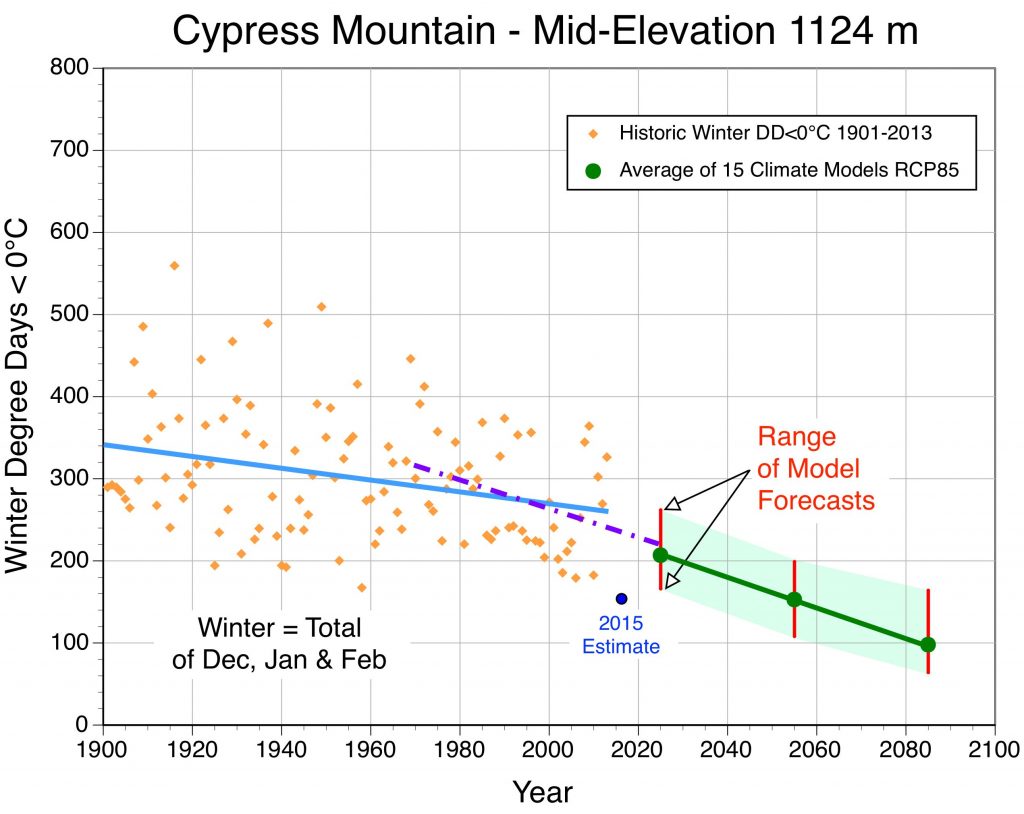
Figure 6. Comparison of the 2015 winter degree days <0°C estimate to historical data (1901-2013) and RCP8.5 climate model predictions for 2025, 2055 and 2085 for Cypress Mt. Best-fit linear regression trend lines are displayed for the historical data for the periods 1901-2013 (blue line) and 1971-2013 (purple dot dash line).
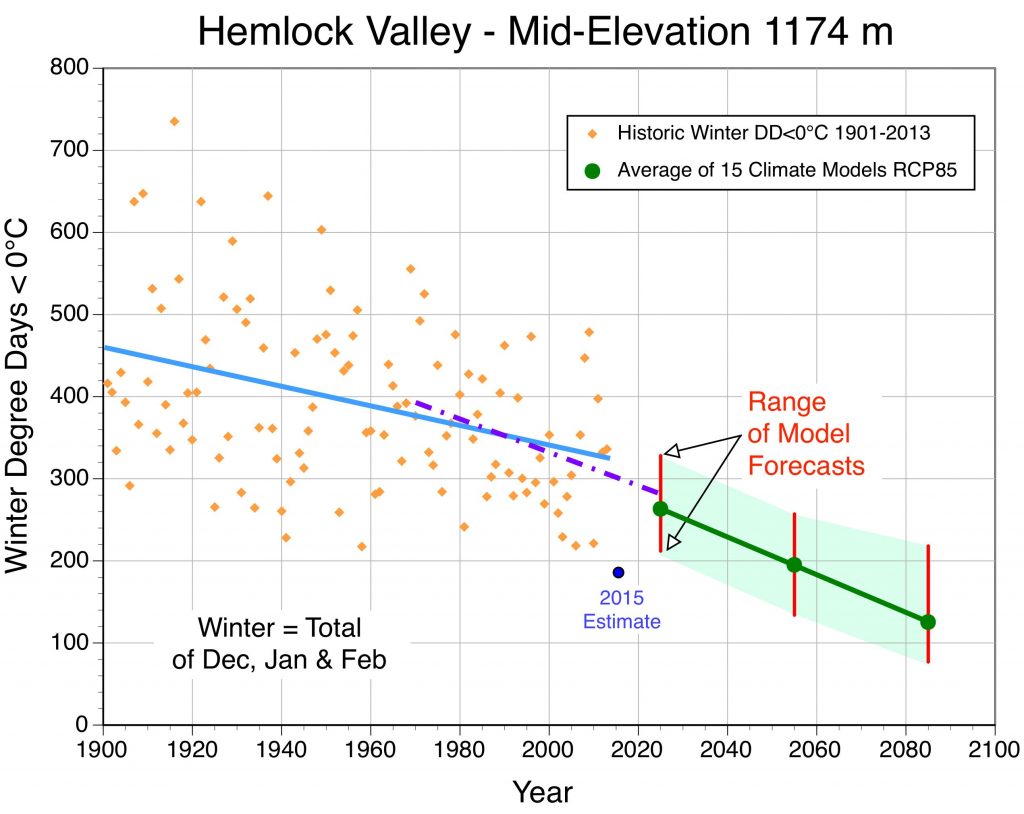
Figure 7. Comparison of the 2015 winter degree days <0°C estimate to historical data (1901-2013) and RCP8.5 climate model predictions for 2025, 2055 and 2085 for Hemlock Valley. Best-fit linear regression trend lines are displayed for the historical data for the periods 1901-2013 (blue line) and 1971-2013 (purple dot dash line).
References
Bond, N.A., M.F. Cronin, H. Freeland, and N. Mantua. 2015. Causes and impacts of the 2014 warm anomaly in the NE Pacific. Geophys. Res. Letters 42: 3414–3420, doi:10.1002/2015GL063306.
Daly, C., W.P. Gibson, G.H. Taylor, G.L. Johnson, and P. Pasteris. 2002. A knowledge-based approach to the statistical mapping of climate. Climate Research 22: 99-113.
Hamann, A. and T. Wang. 2005. Models of climatic normals for genecology and climate change studies in British Columbia. Agricultural and Forest Meteorology 128: 211-221.
Kintisch, Eli. 2015. The Blob invades Pacific, flummoxing climate experts. Science 348: 17-18.
Mitchell, T.D. and P.D. Jones. 2005. An improved method of constructing a database of monthly climate observations and associated high-resolution grids. International Journal of Climatology 25, 693-712.
Wang, T., A. Hamann, D. Spittlehouse, and S.N. Aitken. 2006. Development of scale-free climate data for western Canada for use in resource management. International Journal of Climatology 26(3):383-397.