#######################################################################
#
# ** Convert HYDAT database file into CFA-readable ASCII files **
#
# ** USE AT YOUR OWN RISK, NO WARRANTY **
#
# Developed by Nick(WeiTao) Rong
# Watershed Hydrology Group, UBC Forestry
#
# Last modified: March 24, 2016
#######################################################################
################## **** Read Me!! **** ###################
# This script will output either mean-daily AMS or
# instantaneous peaks. You need to specify the location
# of your HYDAT mdb file and the script will generate a
# sub-directory containing all ascii files with the
# WSC station number as file name with no extension
#
# ** IMPORTANT NOTICE **
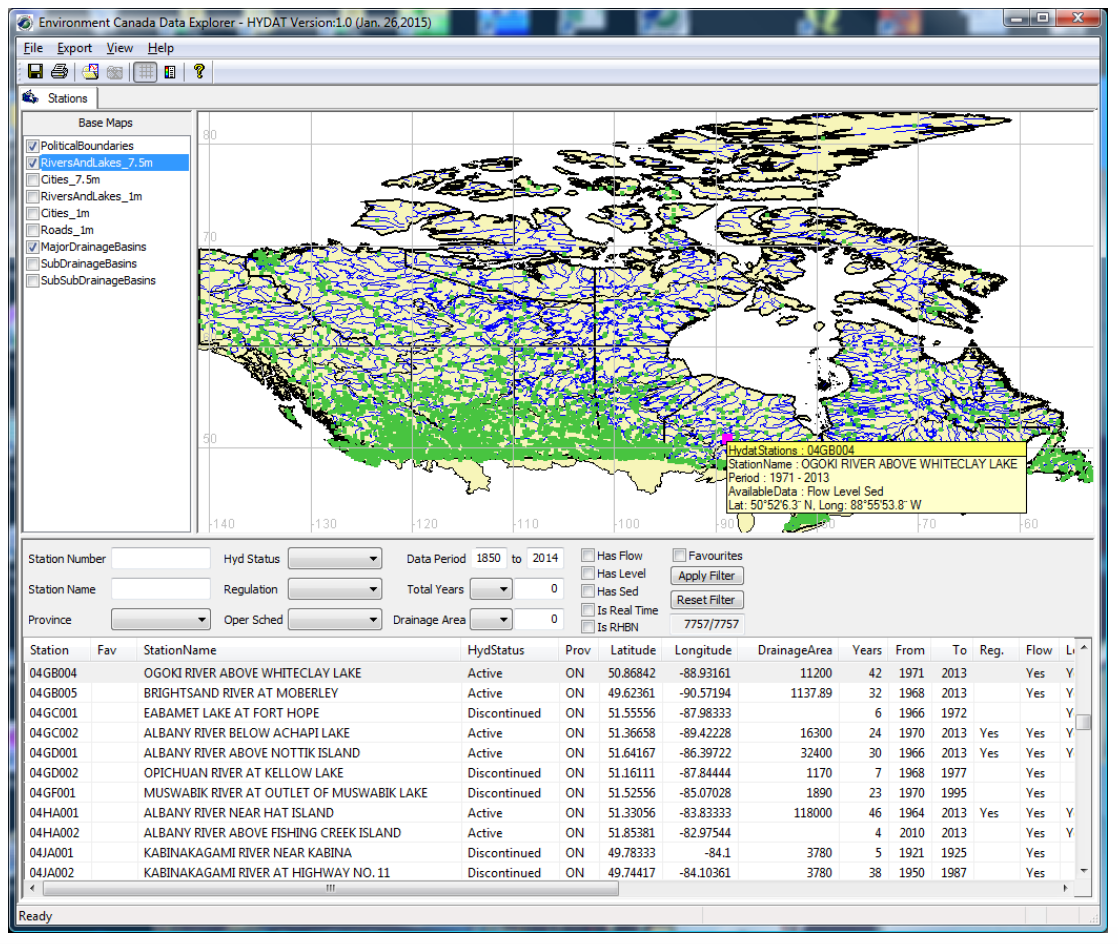
# Because this script does not filter out any stations,
# users are highly recommended to screen the dataset
# first with EC DataExplorer software available on
# the internet (Windows OS only)
#
# To use this script, you need to change:
# 1) hydat.input.location (line 50)
# 2) ascii.output.location (line 56)
# 3) INST (line 59)
##########################################################
rm(list=ls()) # good habit to clean the workspace first
########### **** R Packages Required **** ################
library(Hmisc) # mdb.get() read MS Access database
# Note mdb.get() of {Hmisc} requires mdbtools package on the OS level
# For Mac, install mdbtools use brew or macports
# For Linux, install mdbtools use apt-get
# For Windows with Cygwin, install mdbtools
########### **** Read in HYDAT dataset **** ##############
# Download the .mdb HYDAT dataset: ftp://ftp.tor.ec.gc.ca/HYDAT/
# Unzip the hydat dataset
# Where is the .mdb file located? Including the file name & extension
# The file reading process can take 2~5 mins
hydat.input.location = “/Users/nickrong/Dropbox/FRST590/Hydat_Jan2016.mdb”
########### **** Output ascii files **** ##############
# Where you want the ascii file folder to be located?
# Do not forget the “/” at the end…
ascii.output.location = “/Users/nickrong/Dropbox/FRST590/ascii/”
# WANT INSTANEOUS PEAKS (TRUE) OR MEAN-DAILY ANNUAL PEAKS (FALSE)?
INST = FALSE
# After modifying the items above, run the entire script in R
# Only Modify Things Below If You Know What You Are Doing!!!
# Read the database and store information in list
hydat.all = mdb.get(hydat.input.location)
# The actual hydat database is huge, extract just the table of info.
hydat.table = mdb.get(hydat.input.location, tables = TRUE)
print(“HYDAT mdb file read-in completed”)
if (INST == TRUE) {
hydat.Qmax = subset(hydat.all[[18]], DATA.TYPE == ‘Q’ & PEAK.CODE == ‘H’)
# Annual peak flows are stored in hydat.all[[18]] –>”ANNUAL_INST_PEAKS” (Instantaneous peaks)
hydat.allQ = data.frame(
STATION.NUMBER = hydat.Qmax$STATION.NUMBER,
YEAR = hydat.Qmax$YEAR,
MONTH = formatC(as.numeric(hydat.Qmax$MONTH), width=2, flag=”0″),
FLOW = hydat.Qmax$PEAK,
# DATA.TYPE has to be the last one so I can remove it easily later
DATA.TYPE = hydat.Qmax$DATA.TYPE)
} else{
hydat.Qmax = subset(hydat.all[[19]], DATA.TYPE == ‘Q’)
# Annual peak flows are stored in hydat.all[[19]] –>”ANNUAL_STATISTICS” (Mean Daily Max)
hydat.allQ = data.frame(
STATION.NUMBER = hydat.Qmax$STATION.NUMBER,
YEAR = hydat.Qmax$YEAR,
MONTH = formatC(as.numeric(hydat.Qmax$MAX.MONTH), width=2, flag=”0″),
FLOW = hydat.Qmax$MAX,
# DATA.TYPE has to be the last one so I can remove it easily later
DATA.TYPE = hydat.Qmax$DATA.TYPE)
}
# Station information in hydat.all[[26]] –>”STATIONS”
hydat.allSTATION = data.frame(
STATION.NUMBER = hydat.all[[26]]$STATION.NUMBER,
STATION.NAME = hydat.all[[26]]$STATION.NAME,
PROVINCE = hydat.all[[26]]$PROV.TERR.STATE.LOC,
AREA = hydat.all[[26]]$DRAINAGE.AREA.GROSS
)
# Create the output folder if not exist already
dir.create(file.path(ascii.output.location), showWarnings = FALSE)
setwd(file.path(ascii.output.location))
# loop to generate one ASC file each station…
for (loop1 in 1:length(hydat.allSTATION$STATION.NUMBER)){
# Which station we are working on?
station = as.character(hydat.allSTATION$STATION.NUMBER[loop1])
# Subset out Annual Peaks of just this station and just Flow (DATA.TYPE == Q)
station.Q = subset(hydat.allQ, STATION.NUMBER == station)
input.Q = station.Q[,1:4] # remove DATA.TYPE
input.Q = input.Q[order(input.Q$YEAR),] # sort by years
# filter out stations without records
if (length(input.Q$YEAR) != 0) {
# Initial file with the file name as the station number; no extension
CFAinput <- file(paste0(ascii.output.location, station), “w”)
# Writting header info
cat(paste0(hydat.allSTATION$STATION.NUMBER[loop1],”\n”), file = CFAinput)
cat(paste0(hydat.allSTATION$STATION.NAME[loop1],”\n”), file = CFAinput)
cat(paste0(length(input.Q$YEAR),” “,
hydat.allSTATION$AREA[loop1],”\n”), file = CFAinput)
# Appending the flow data to the file (no col/row names)
write.table(input.Q, file = CFAinput, append = TRUE,
col.names = FALSE, row.names = FALSE, quote = FALSE)
# Finish the file writing
close(CFAinput)
}
completion = (loop1/length(hydat.allSTATION$STATION.NUMBER))*100
if(completion %% 5 < 0.01) {
print(paste0(round(completion, digits = 0), “% of stations output completed”))
}
} # End of loop for exporting each WSC station into a separated ascii file
#################### EOF ####################