Kernel Density (Incidents of Substance Release)
Dependent Variable: Incidents of Substance Release
Combining the two point files of locations of releases, a Kernel Density surface was created and then reassigned a value between 0 and 1 using Fuzzy Membership – Linear. Higher values represent a higher density of releases. Each density value was then multiplied by 100 to allow for a range between 0 to 100. Next, the raster surface was transformed to a point surface and spatially joined to dissemination areas (DA) in greater Edmonton (census division No.11). The points were then averaged within each DA (merge rule = mean).
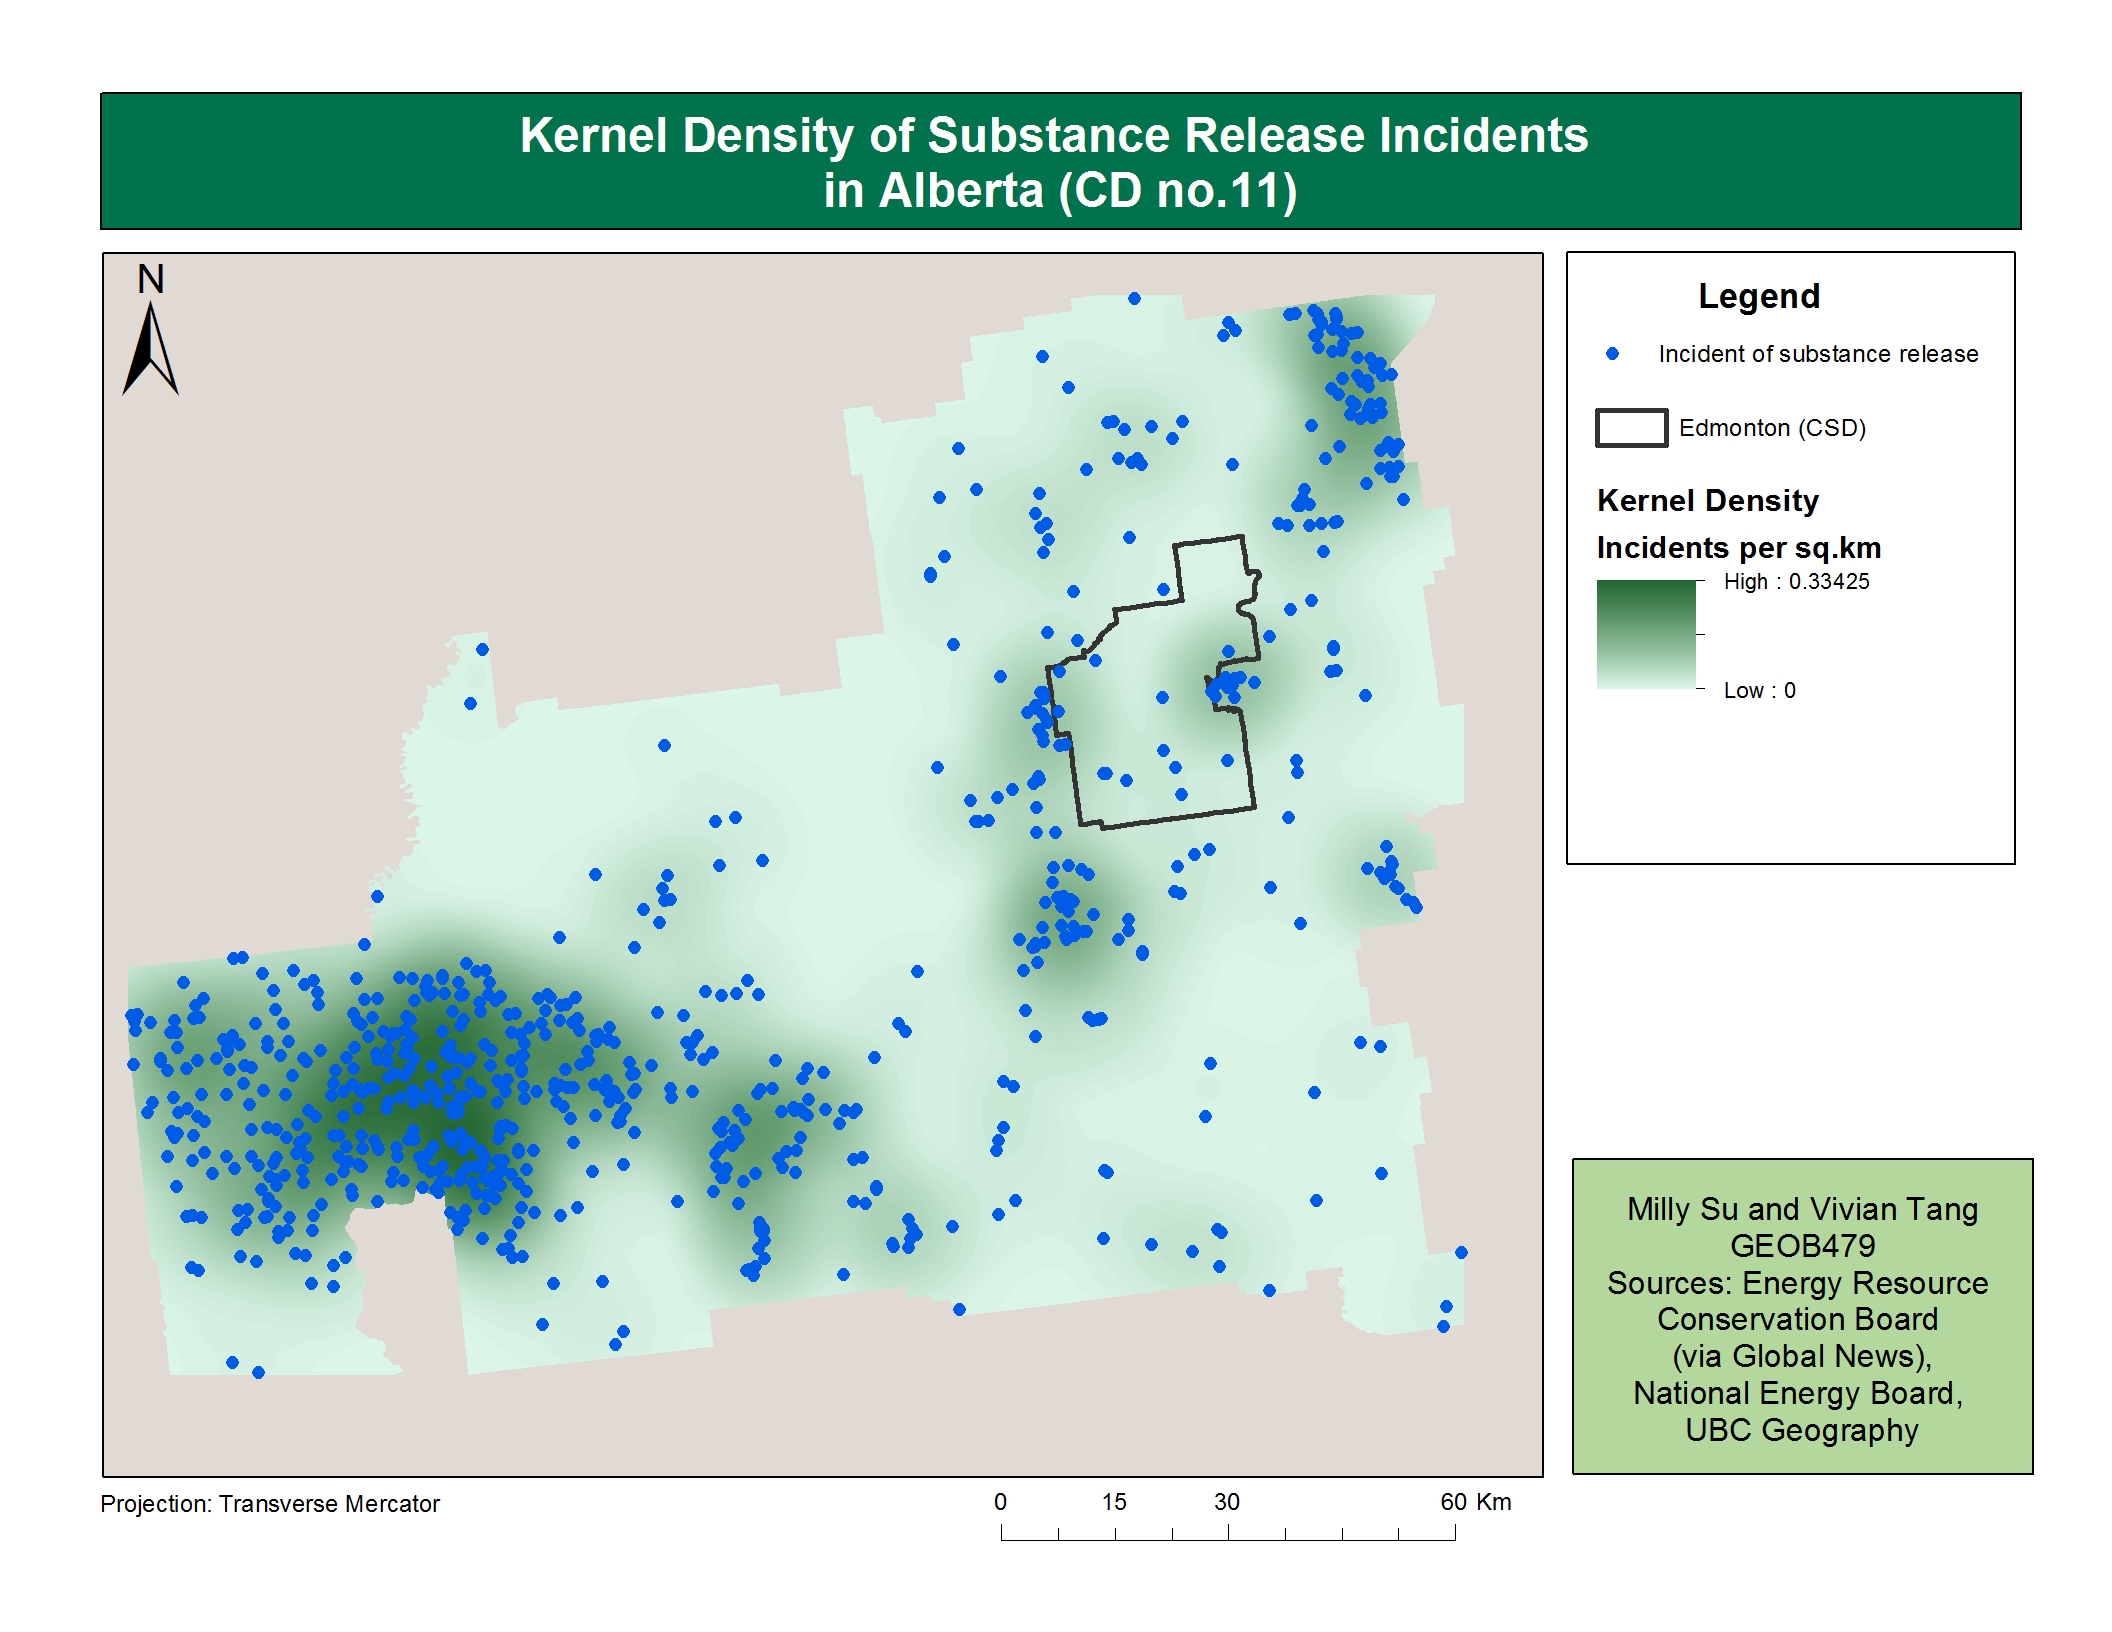
Kernel Density of Substance Release Incidents
Kernel Density (Incidents of Crude Oil Release)
Dependent Variable: Incidents of Crude Oil Release
In the second kernel density, only crude oil releases were included. The kernel density was weighted by the volume released. Similar to the previous kernel density, the raster was reassigned a value from 0-100 and values were averaged for each DA.
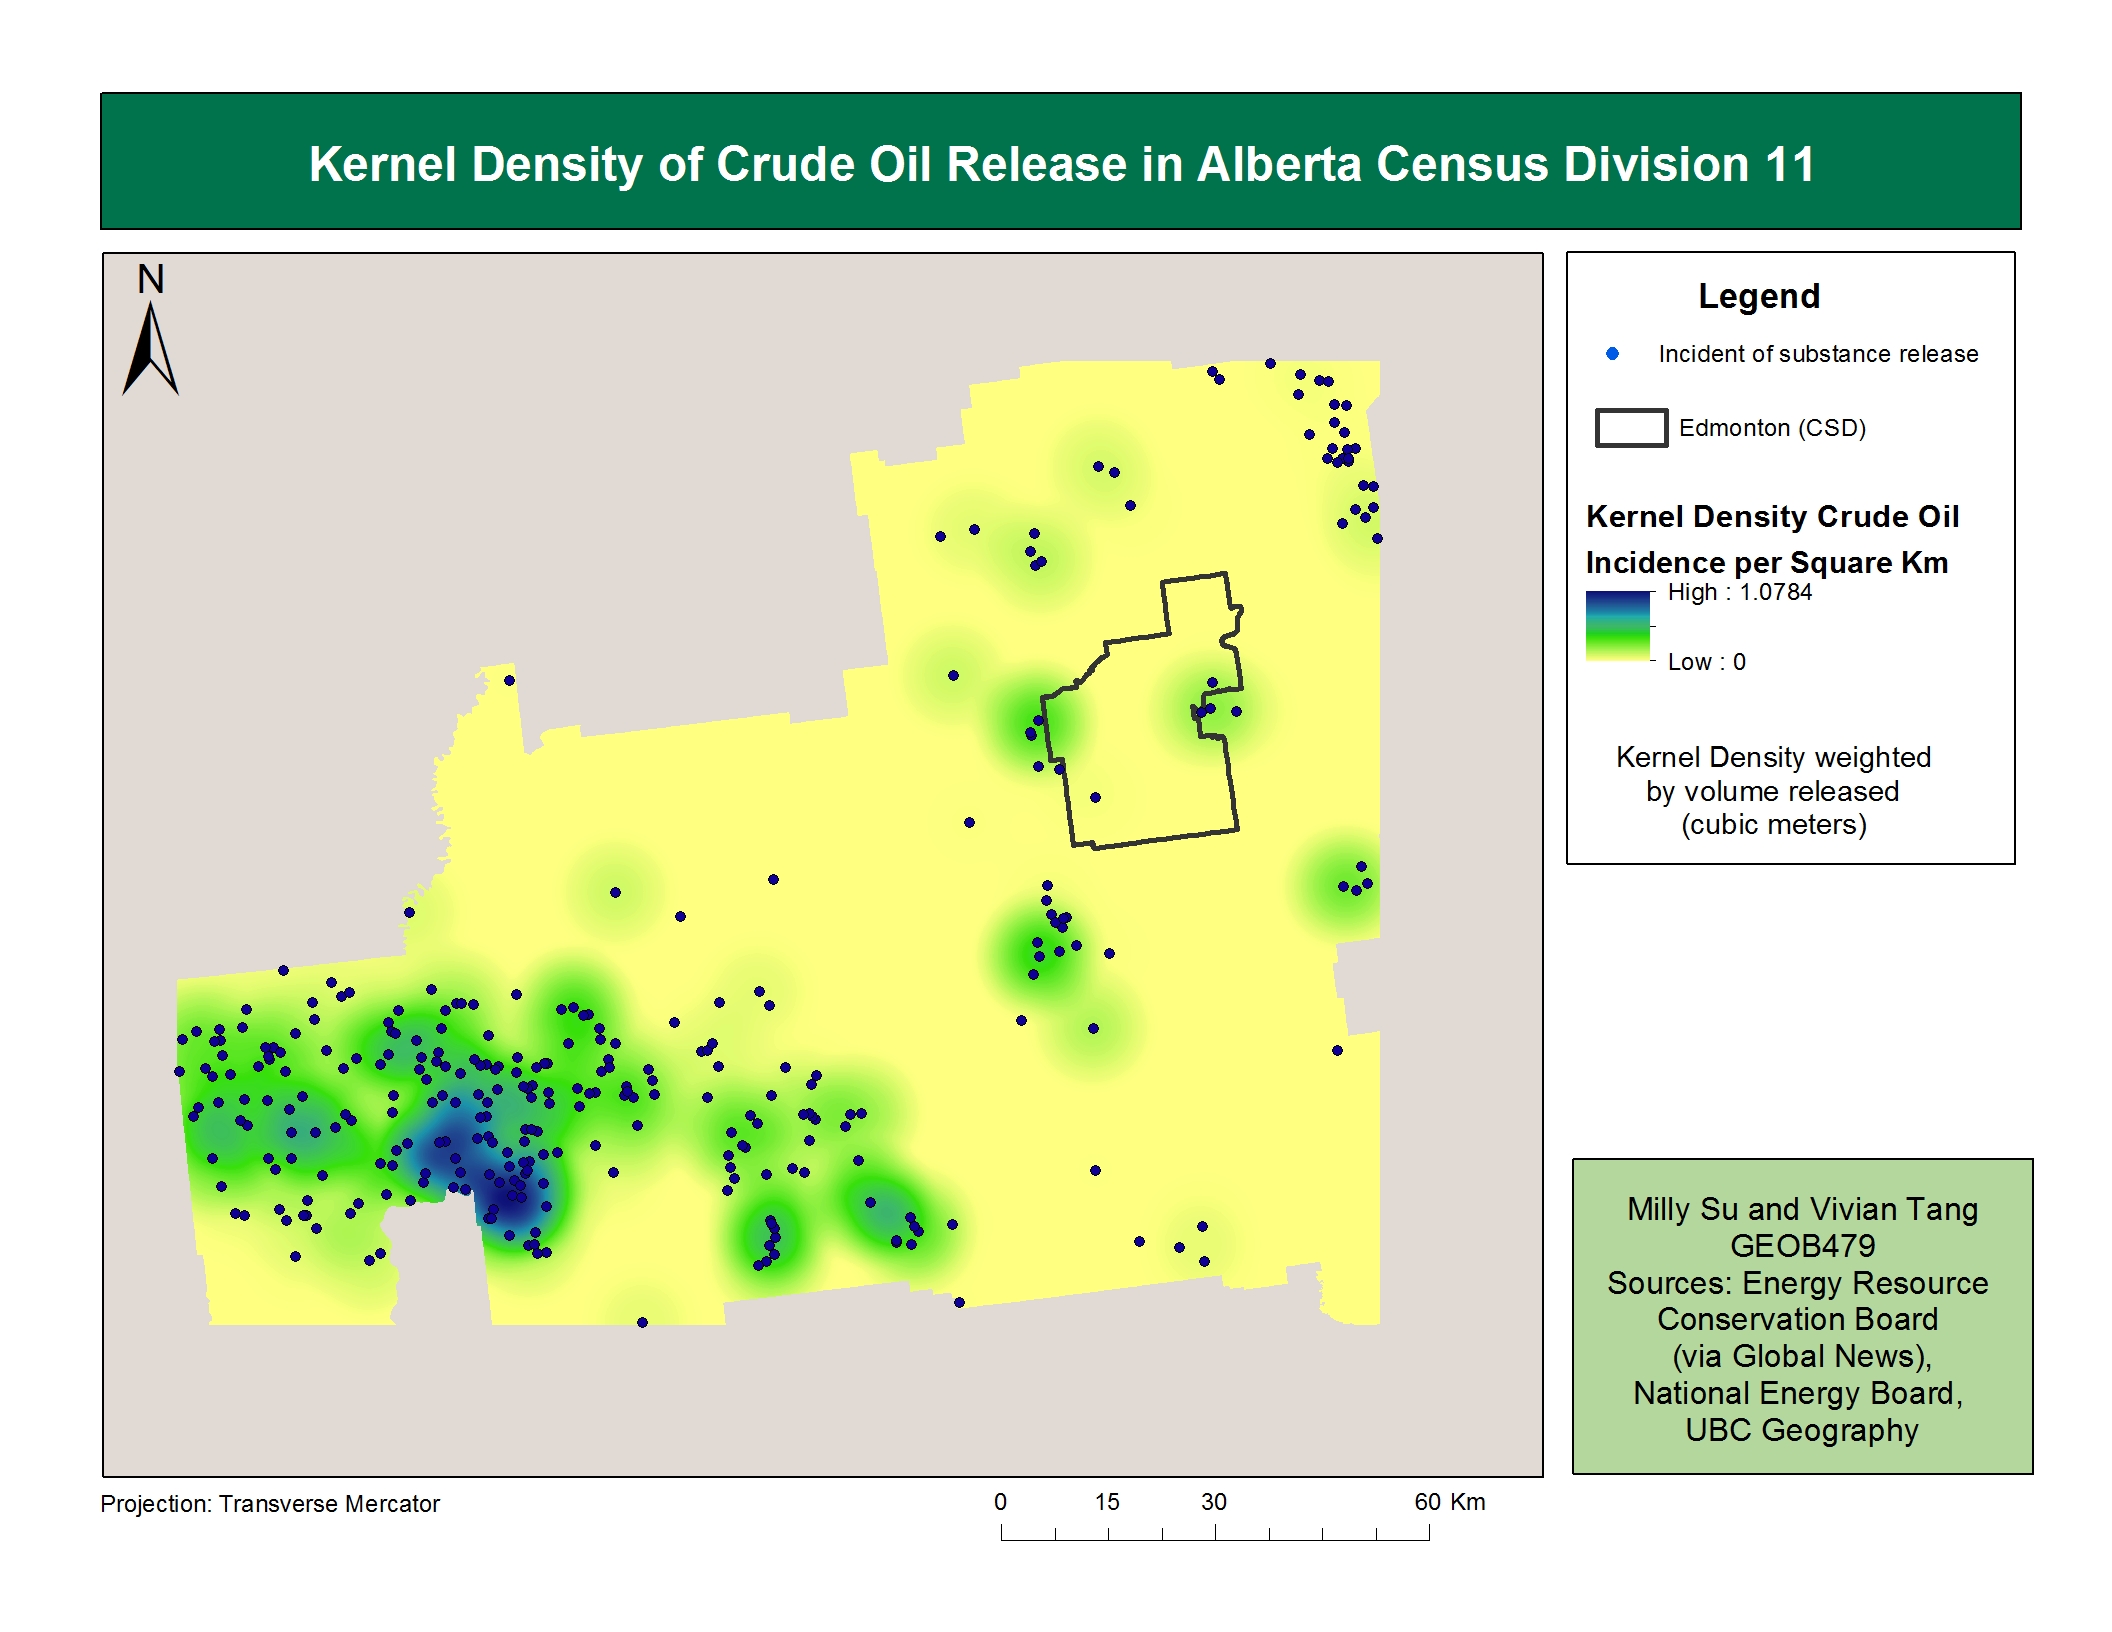
Kernel Density of Crude Oil Releases