OLS
Variables: Education, Immigrants, Visible Minority
AICc: 13079.990412
Adjusted R2: 0.17248
Geographically Weighted Regression
Variables: Education, Immigrants, Visible Minority
AICc: 12177.494522
Adjusted R2: 0.419675
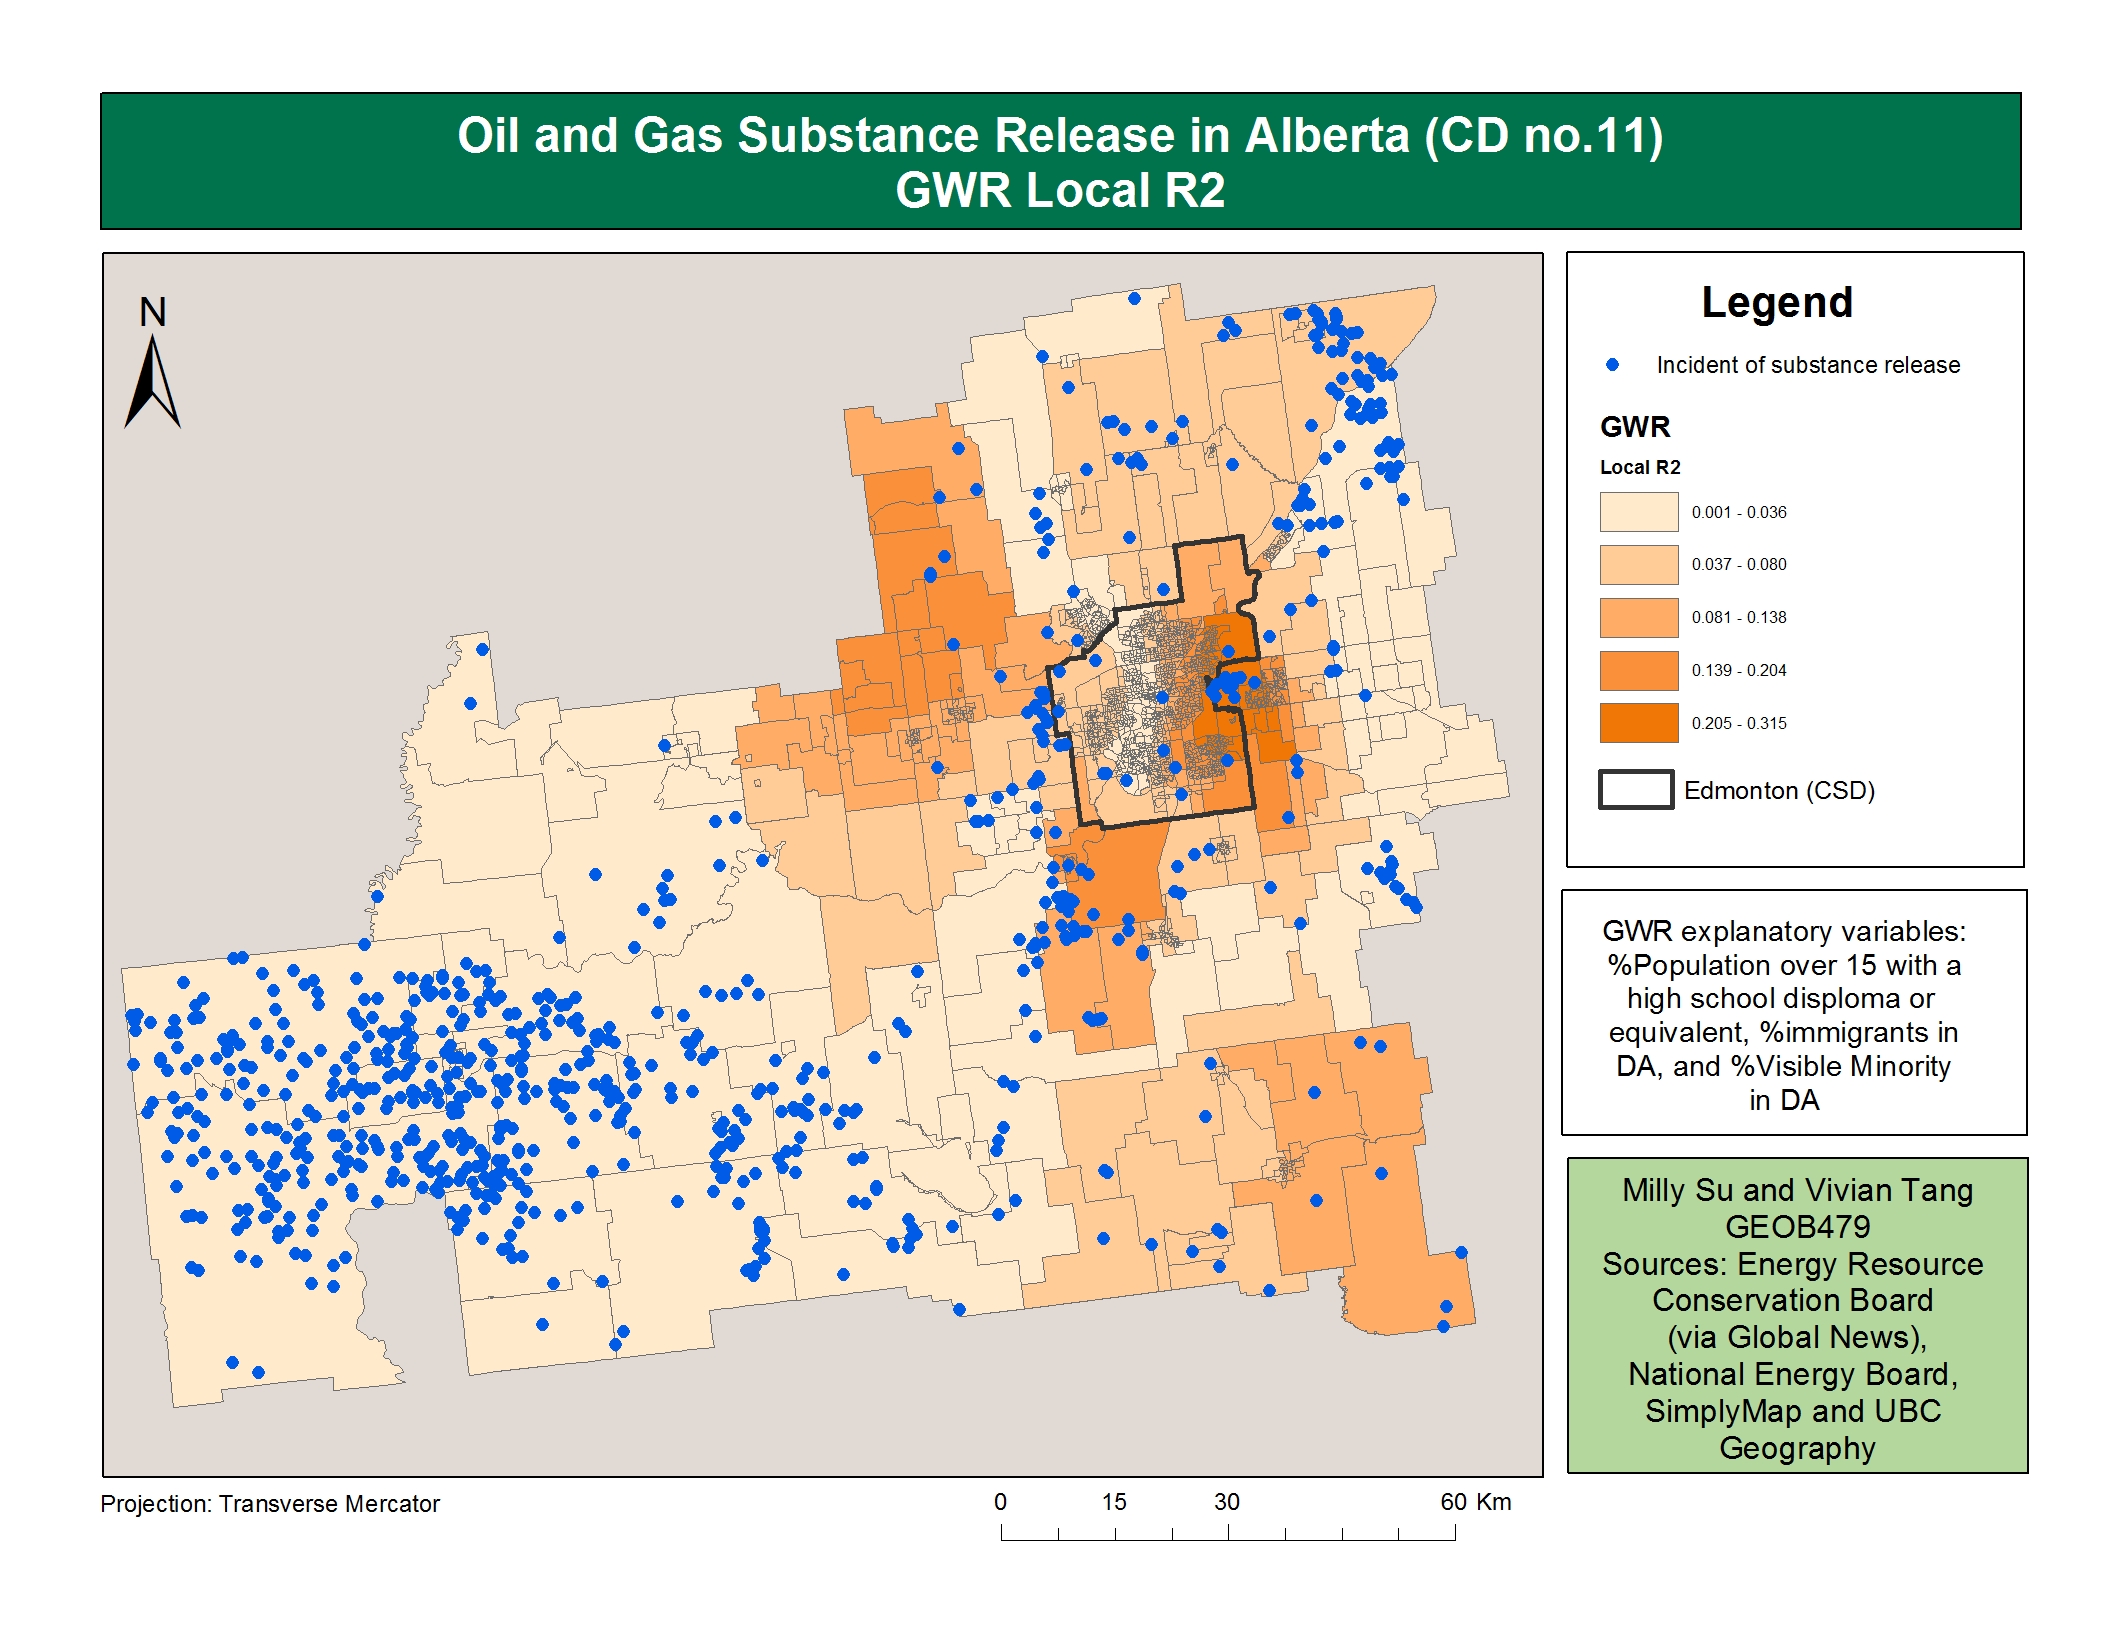
Figure 1. Local R2 in CD no.11, Alberta
Figure 1: There is low variability in the Local R2 values when viewing the census division (CD) as a whole. We can see that the model fits especially poorly in the western portion of the CD. This is logical as most of the population is clustered in Edmonton. We also observed a lack of visible minority and and lower percentage of immigrants outside of Edmonton as well. As such, subsequent results and discussion will be focused on Edmonton (Census subdivision).
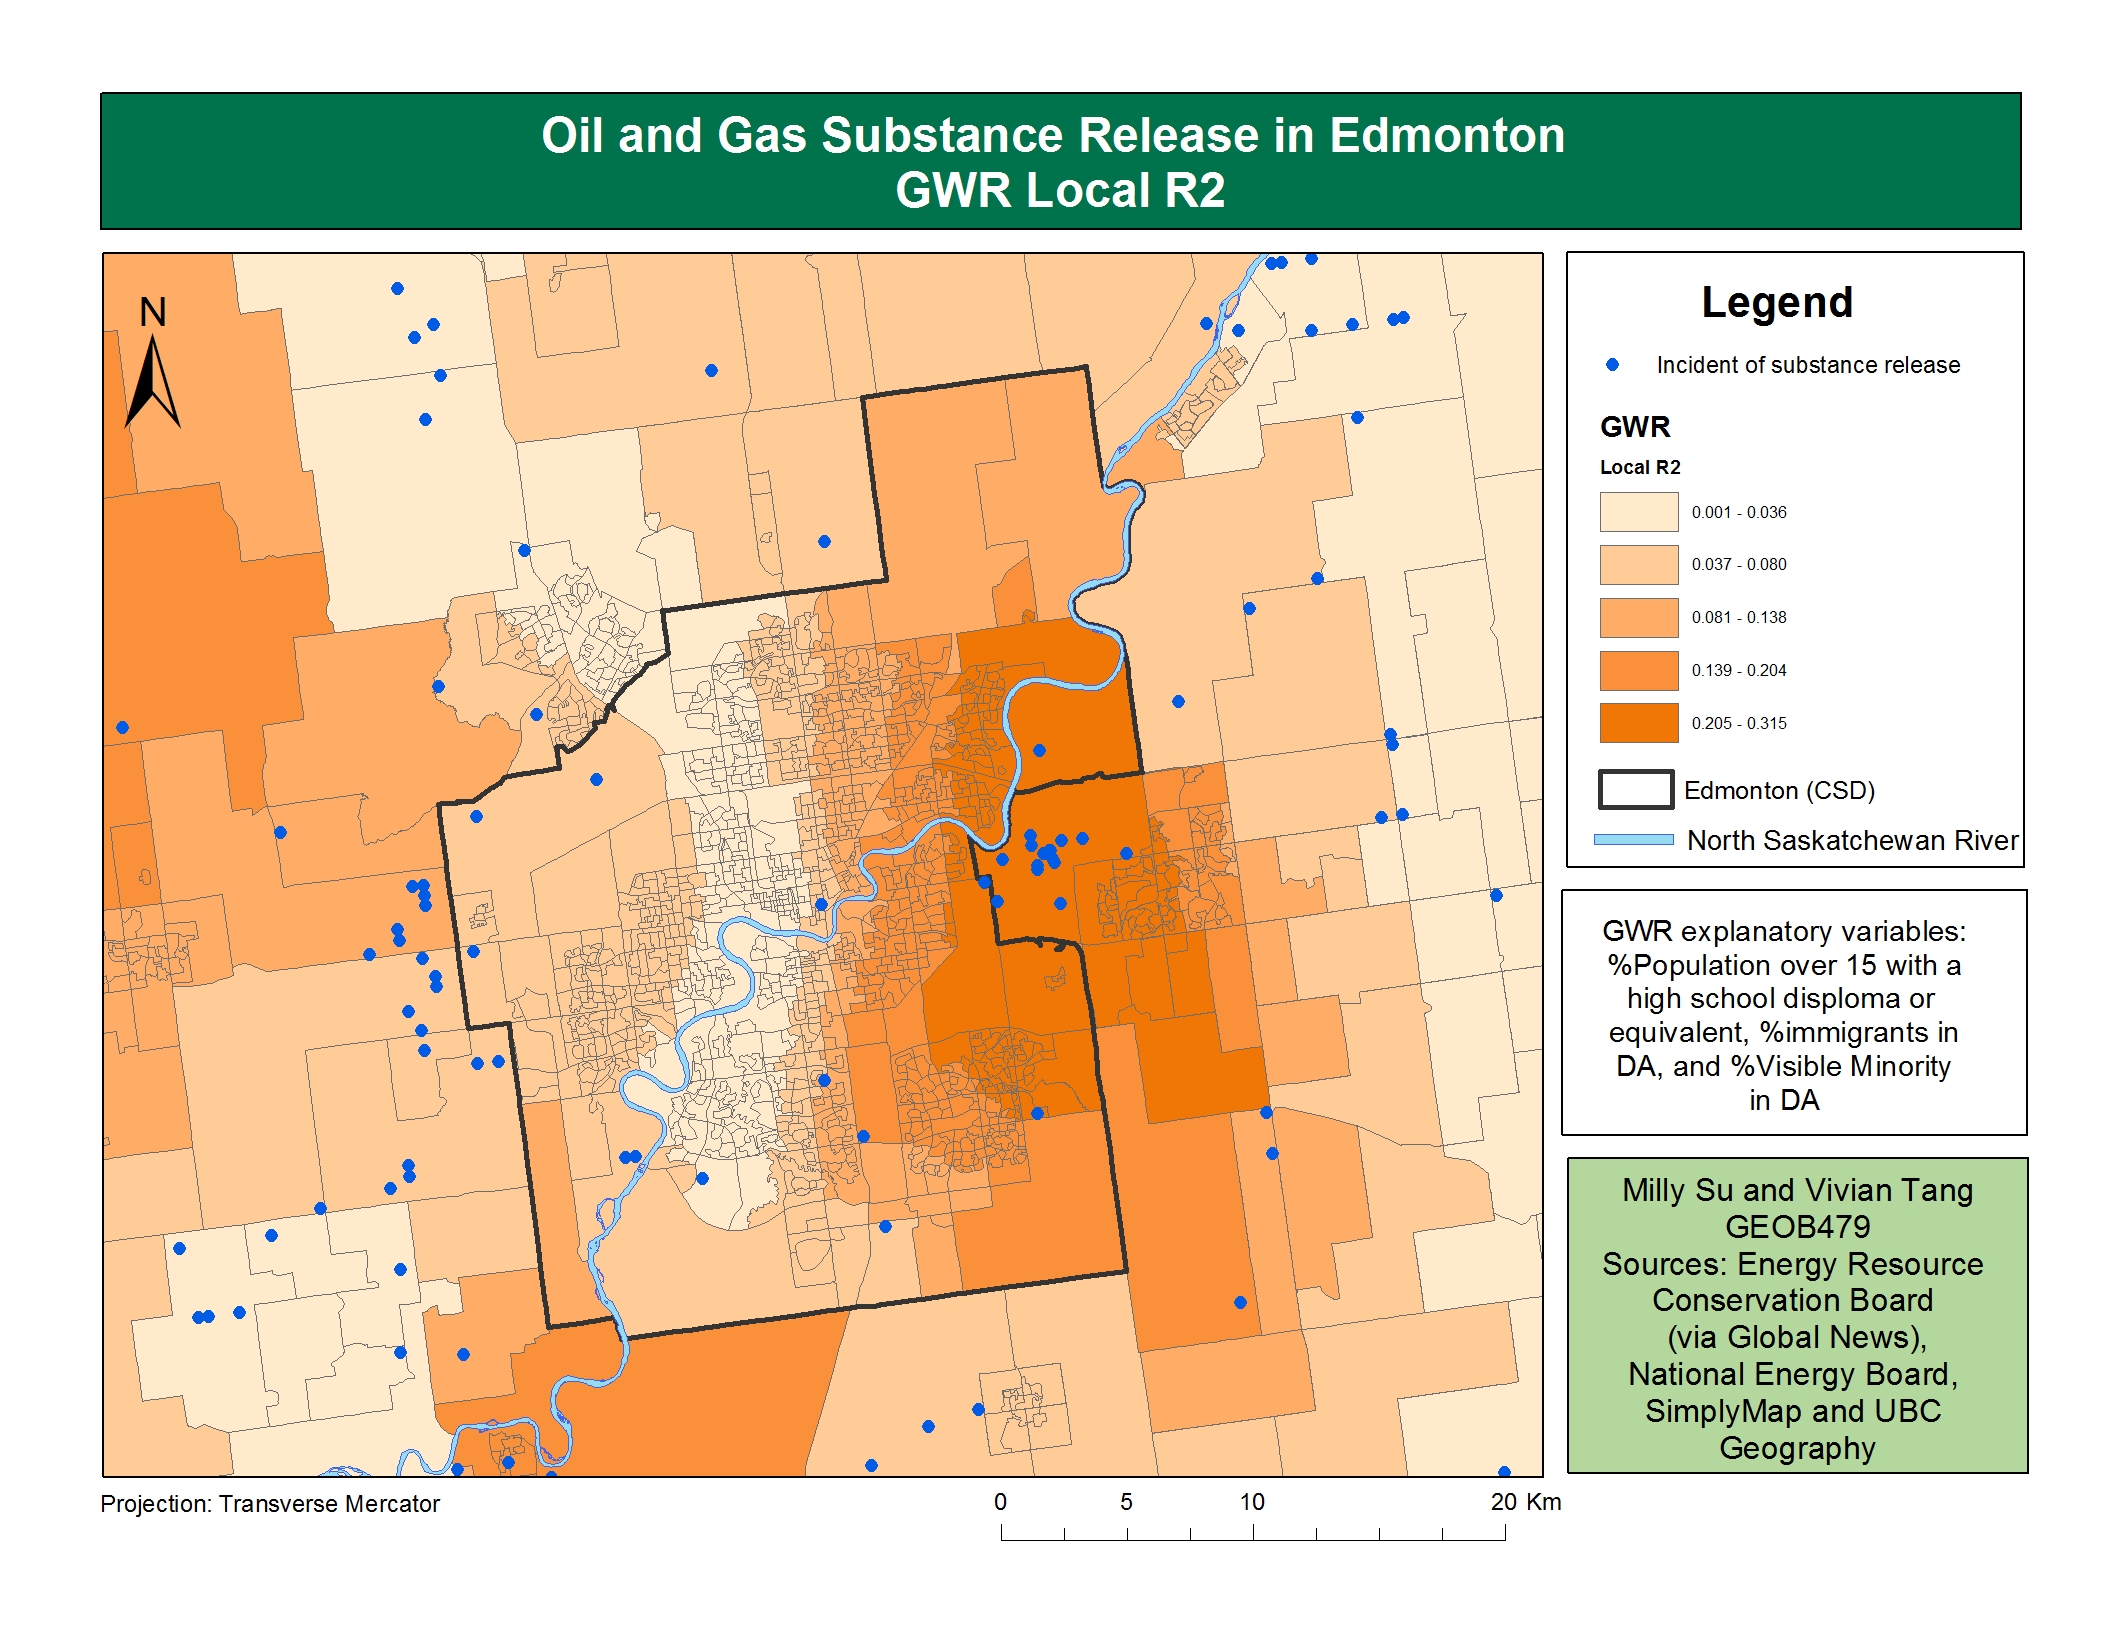
Figure 2. Local R2 of Edmonton
Figure 2: There is a greater variability of the local R2 within Edmonton. The east half of Edmonton has a higher local R2. The GWR model fits the east portion of Edmonton better than the west. However it is important to note that our mode’s local R2 values have a range of 0.0001-0.315 while the local R2 can range from 0.0-1.0. Due to the low local R2 values, max only being 0.315l, our model is a low predictor for our dependent variable. It is likely we our missing key explanatory variables.
In the dark orange areas where the model is performing better, we can see a small clustering of substance releases. In photo 1 we see this clustering is in an industrial area just outside of the Edmonton residential area. This is also near the Kinder Morgan Edmonton terminal where oil is stored. As well, the dark orange area touches the North Saskatchewan River which runs through Edmonton. This can be a potential risk of polluting the river system. Our model performs better in this area, which is an area of interest for this project.

Kinder Morgan Terminal near Edmonton. source: Google Maps
Coefficient Raster Surfaces
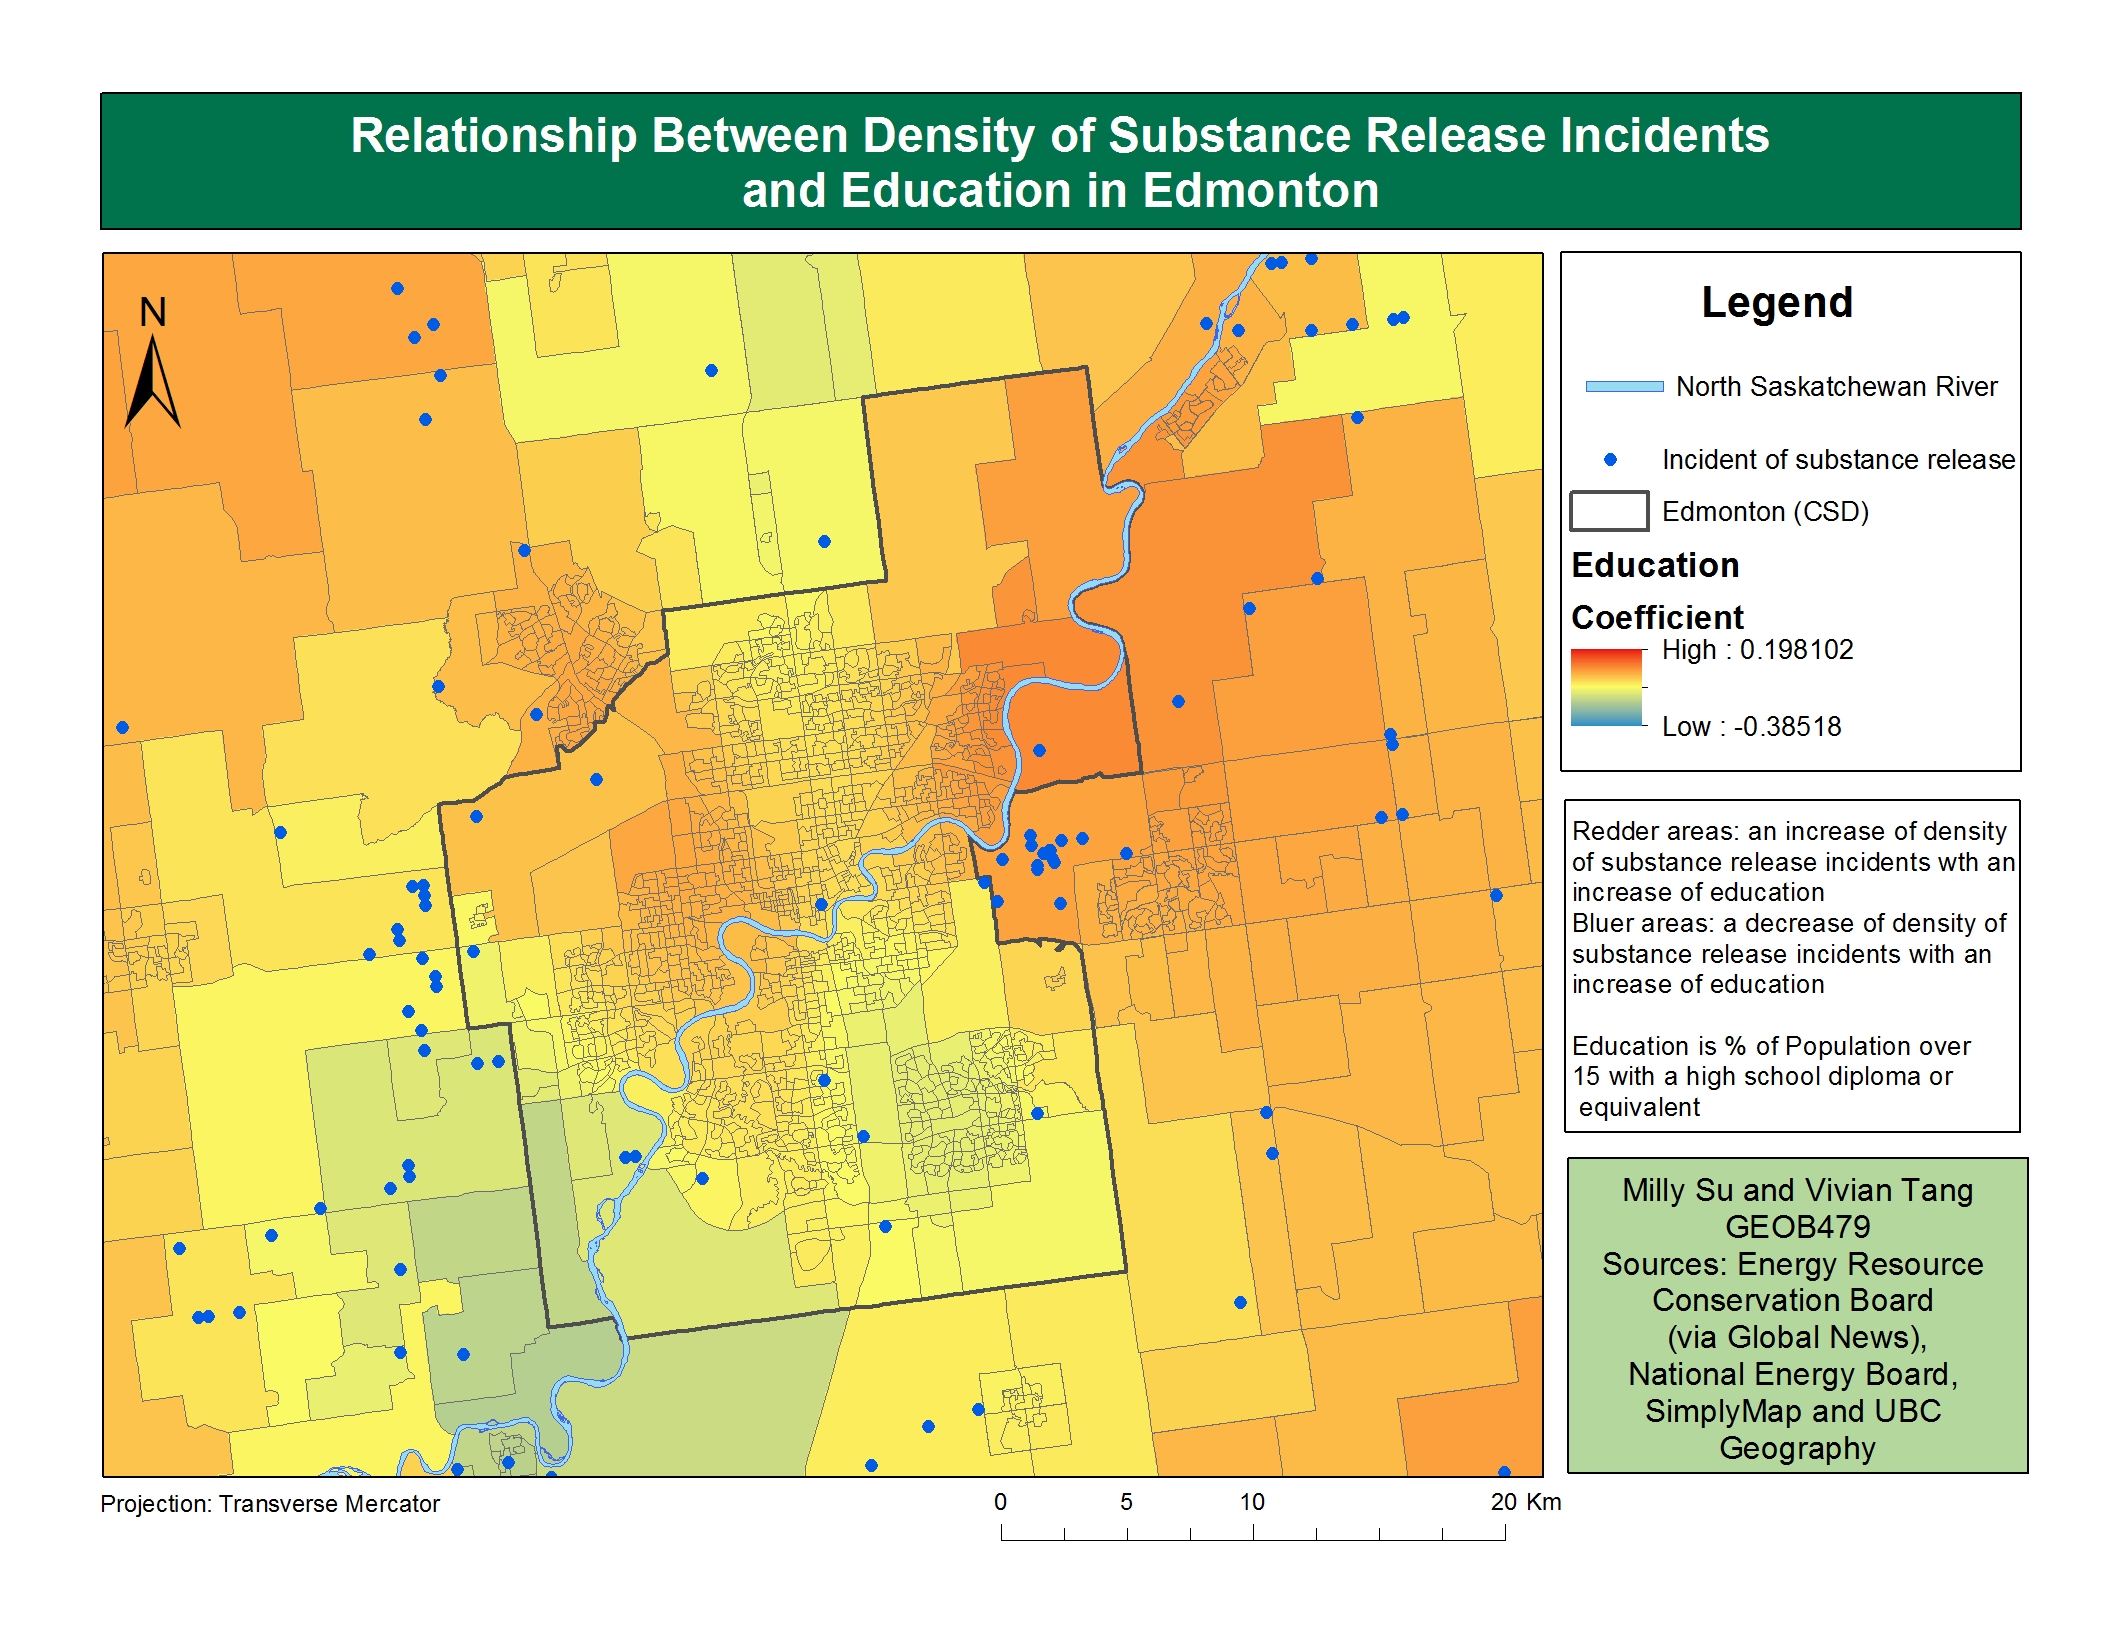
figure 3. Density of Substance Release Incidents and Education in Edmonton
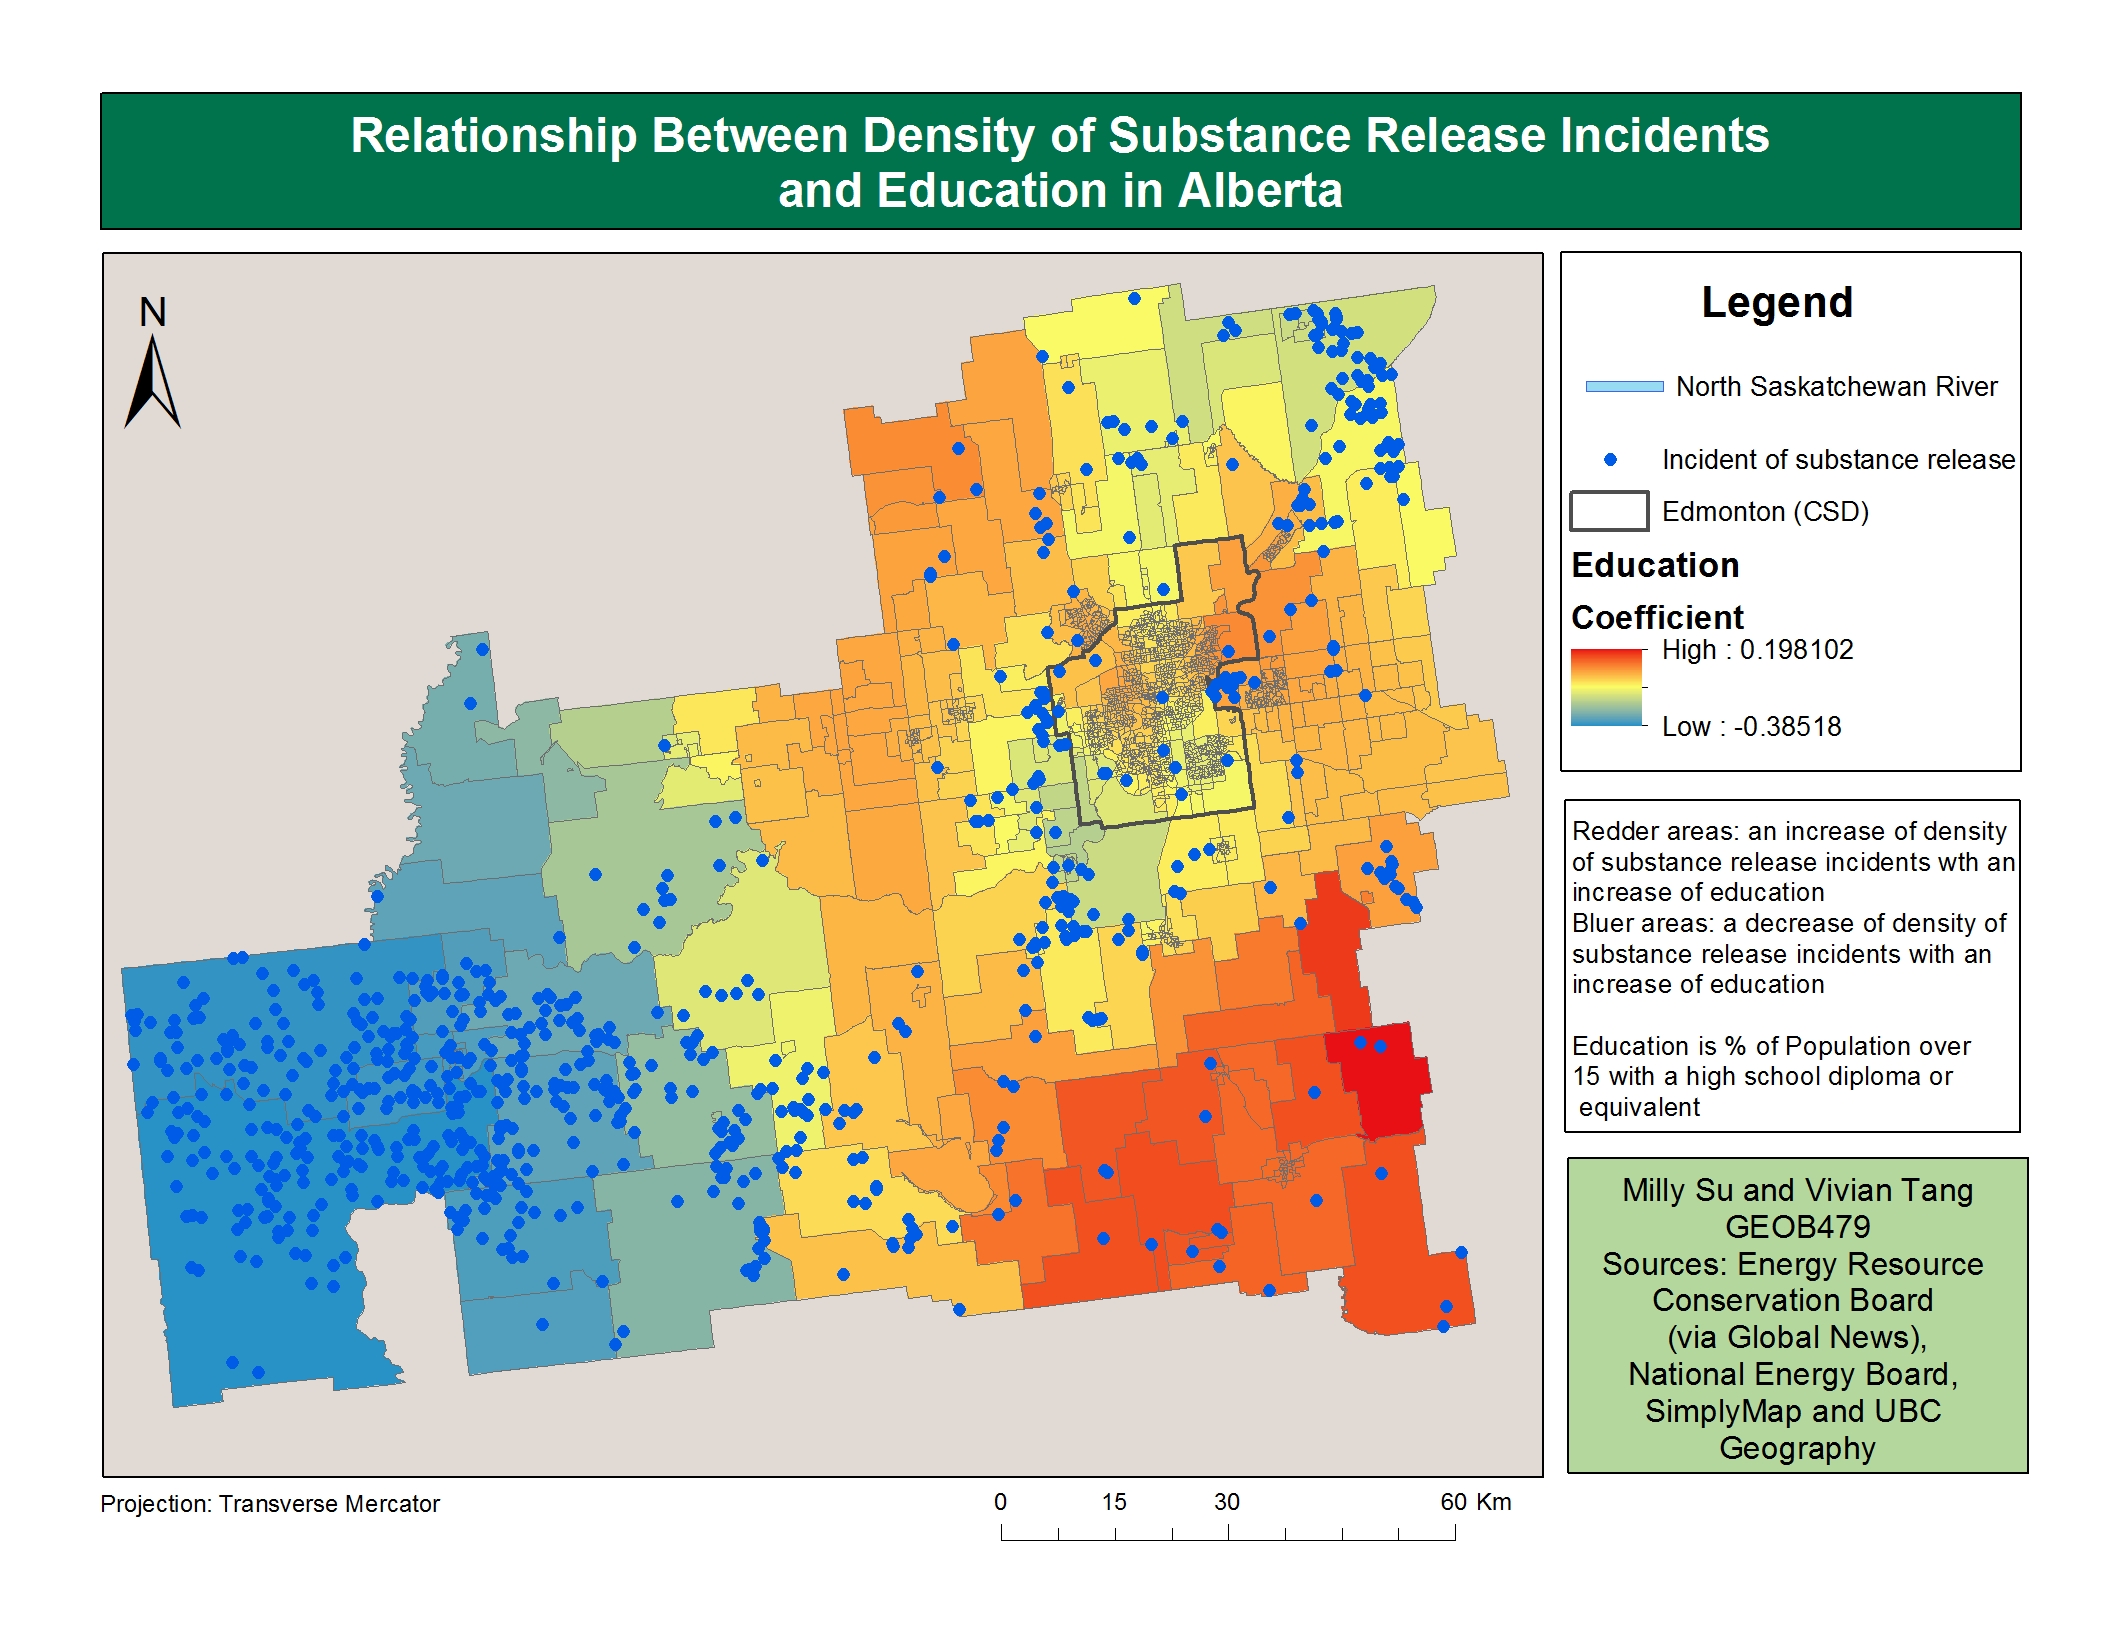
figure 4. Density of Substance Release Incidents and Education in CD no.11
Figure 3: Relationship Between Density of Substance Release Incidents and Education in Edmonton
In figure 3 we see that the majority of the Edmonton area has a weak positive education coefficient. This is not what we expected. We hypothesized that education would have a negative relationship with density of release incidents. This is because a lower education can be related to lower income and therefore determine where you can afford to live. This relationship is evident in the south-west corner of Edmonton and into the suburb area. It is also evident in figure 4 in the west portion of CD no.11. However this area also had the poorest model performance.
The area of interest from figure 2 shows positive relation to education in figure 3. While this is the opposite of what is expected, it is due likely to the fact that education is generally much higher in the city, therefore higher in the area of interest near the oils. Another possibility of this reversed relationship could be due to the increased amount of workers in the mining industry living near processing facilities, and hence oil spills. Typically these workers are expected to possess at least a high school diploma, therefore we might expect higher education to be correlated to higher incidences of substance release.
.
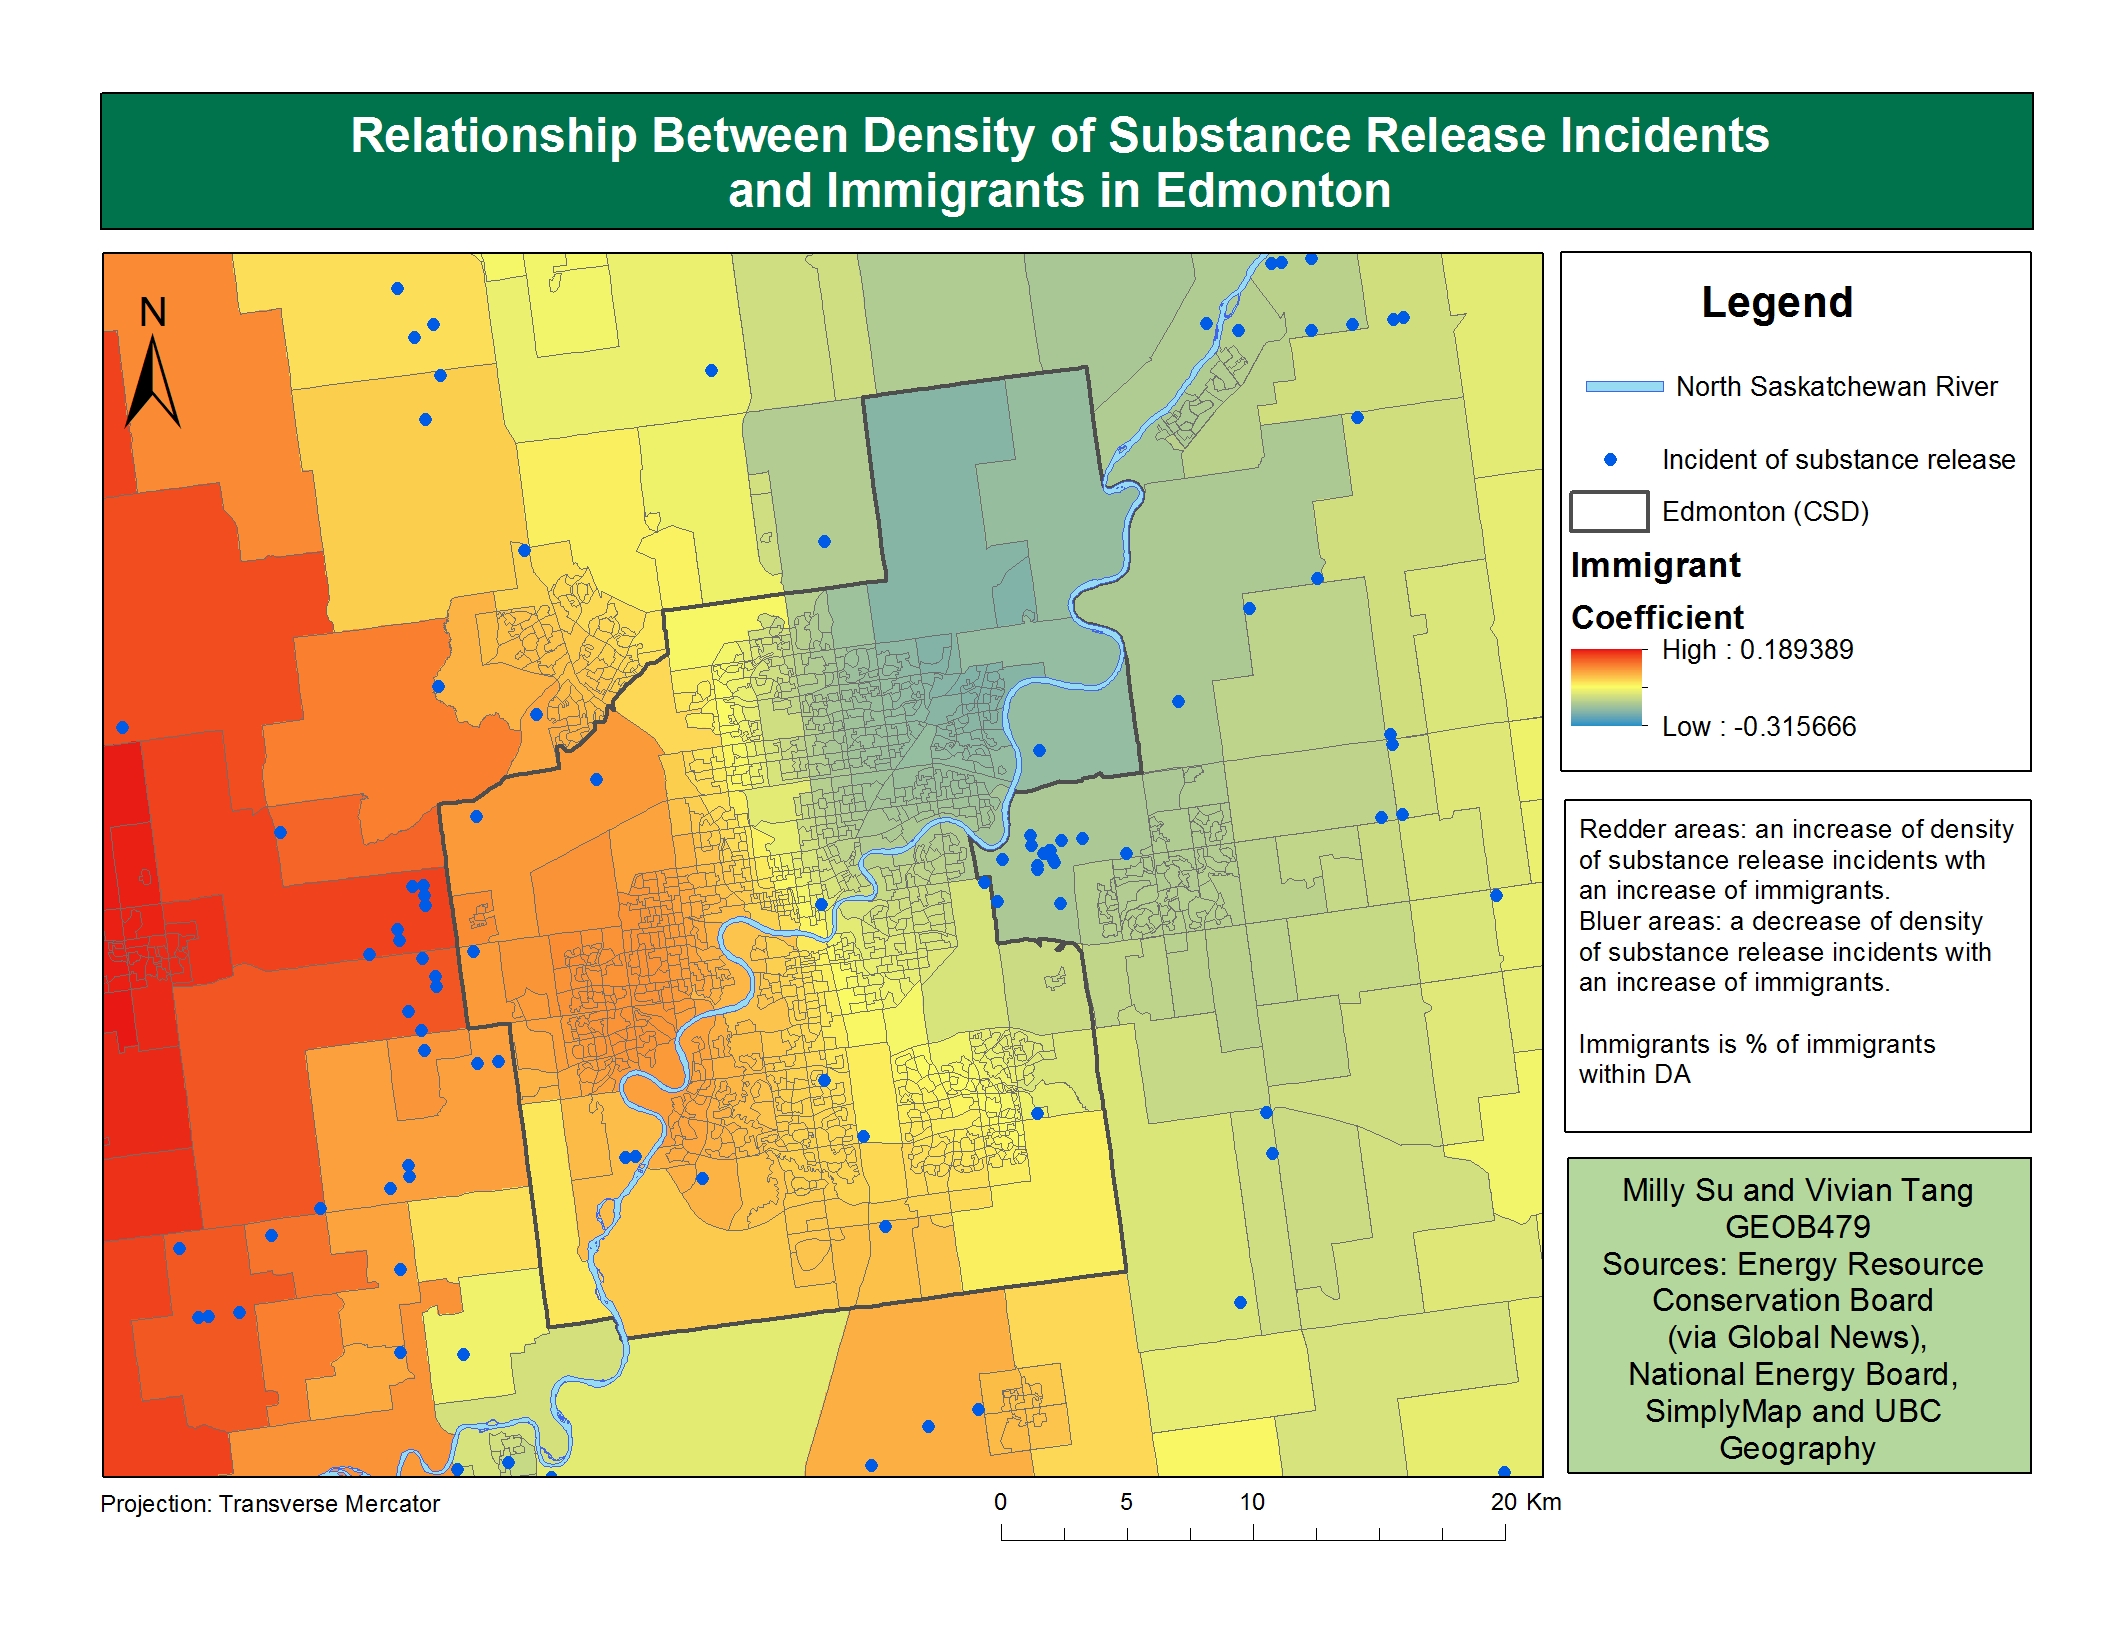
figure 5. Density of Substance Release Incidents and Immigrants
In figure 5 we see a large variation in the immigrant coefficients. In the west portion, there is a positive relationship of immigration to density of release incidents. While on the north-east portion and area of interest from figure 2, the coefficients are negative and show a negative relationship. We expected a positive relationship to immigration because we observed a positive relationship between immigration and visible minorities. Both immigrants and visible minorities are groups who are more likely to live in close proximity to processing facilities. Similar to the education coefficients, areas that support the hypothesized relationship between immigrants and incidences of substance release are areas with a lower local R2 value and poorer model performance.
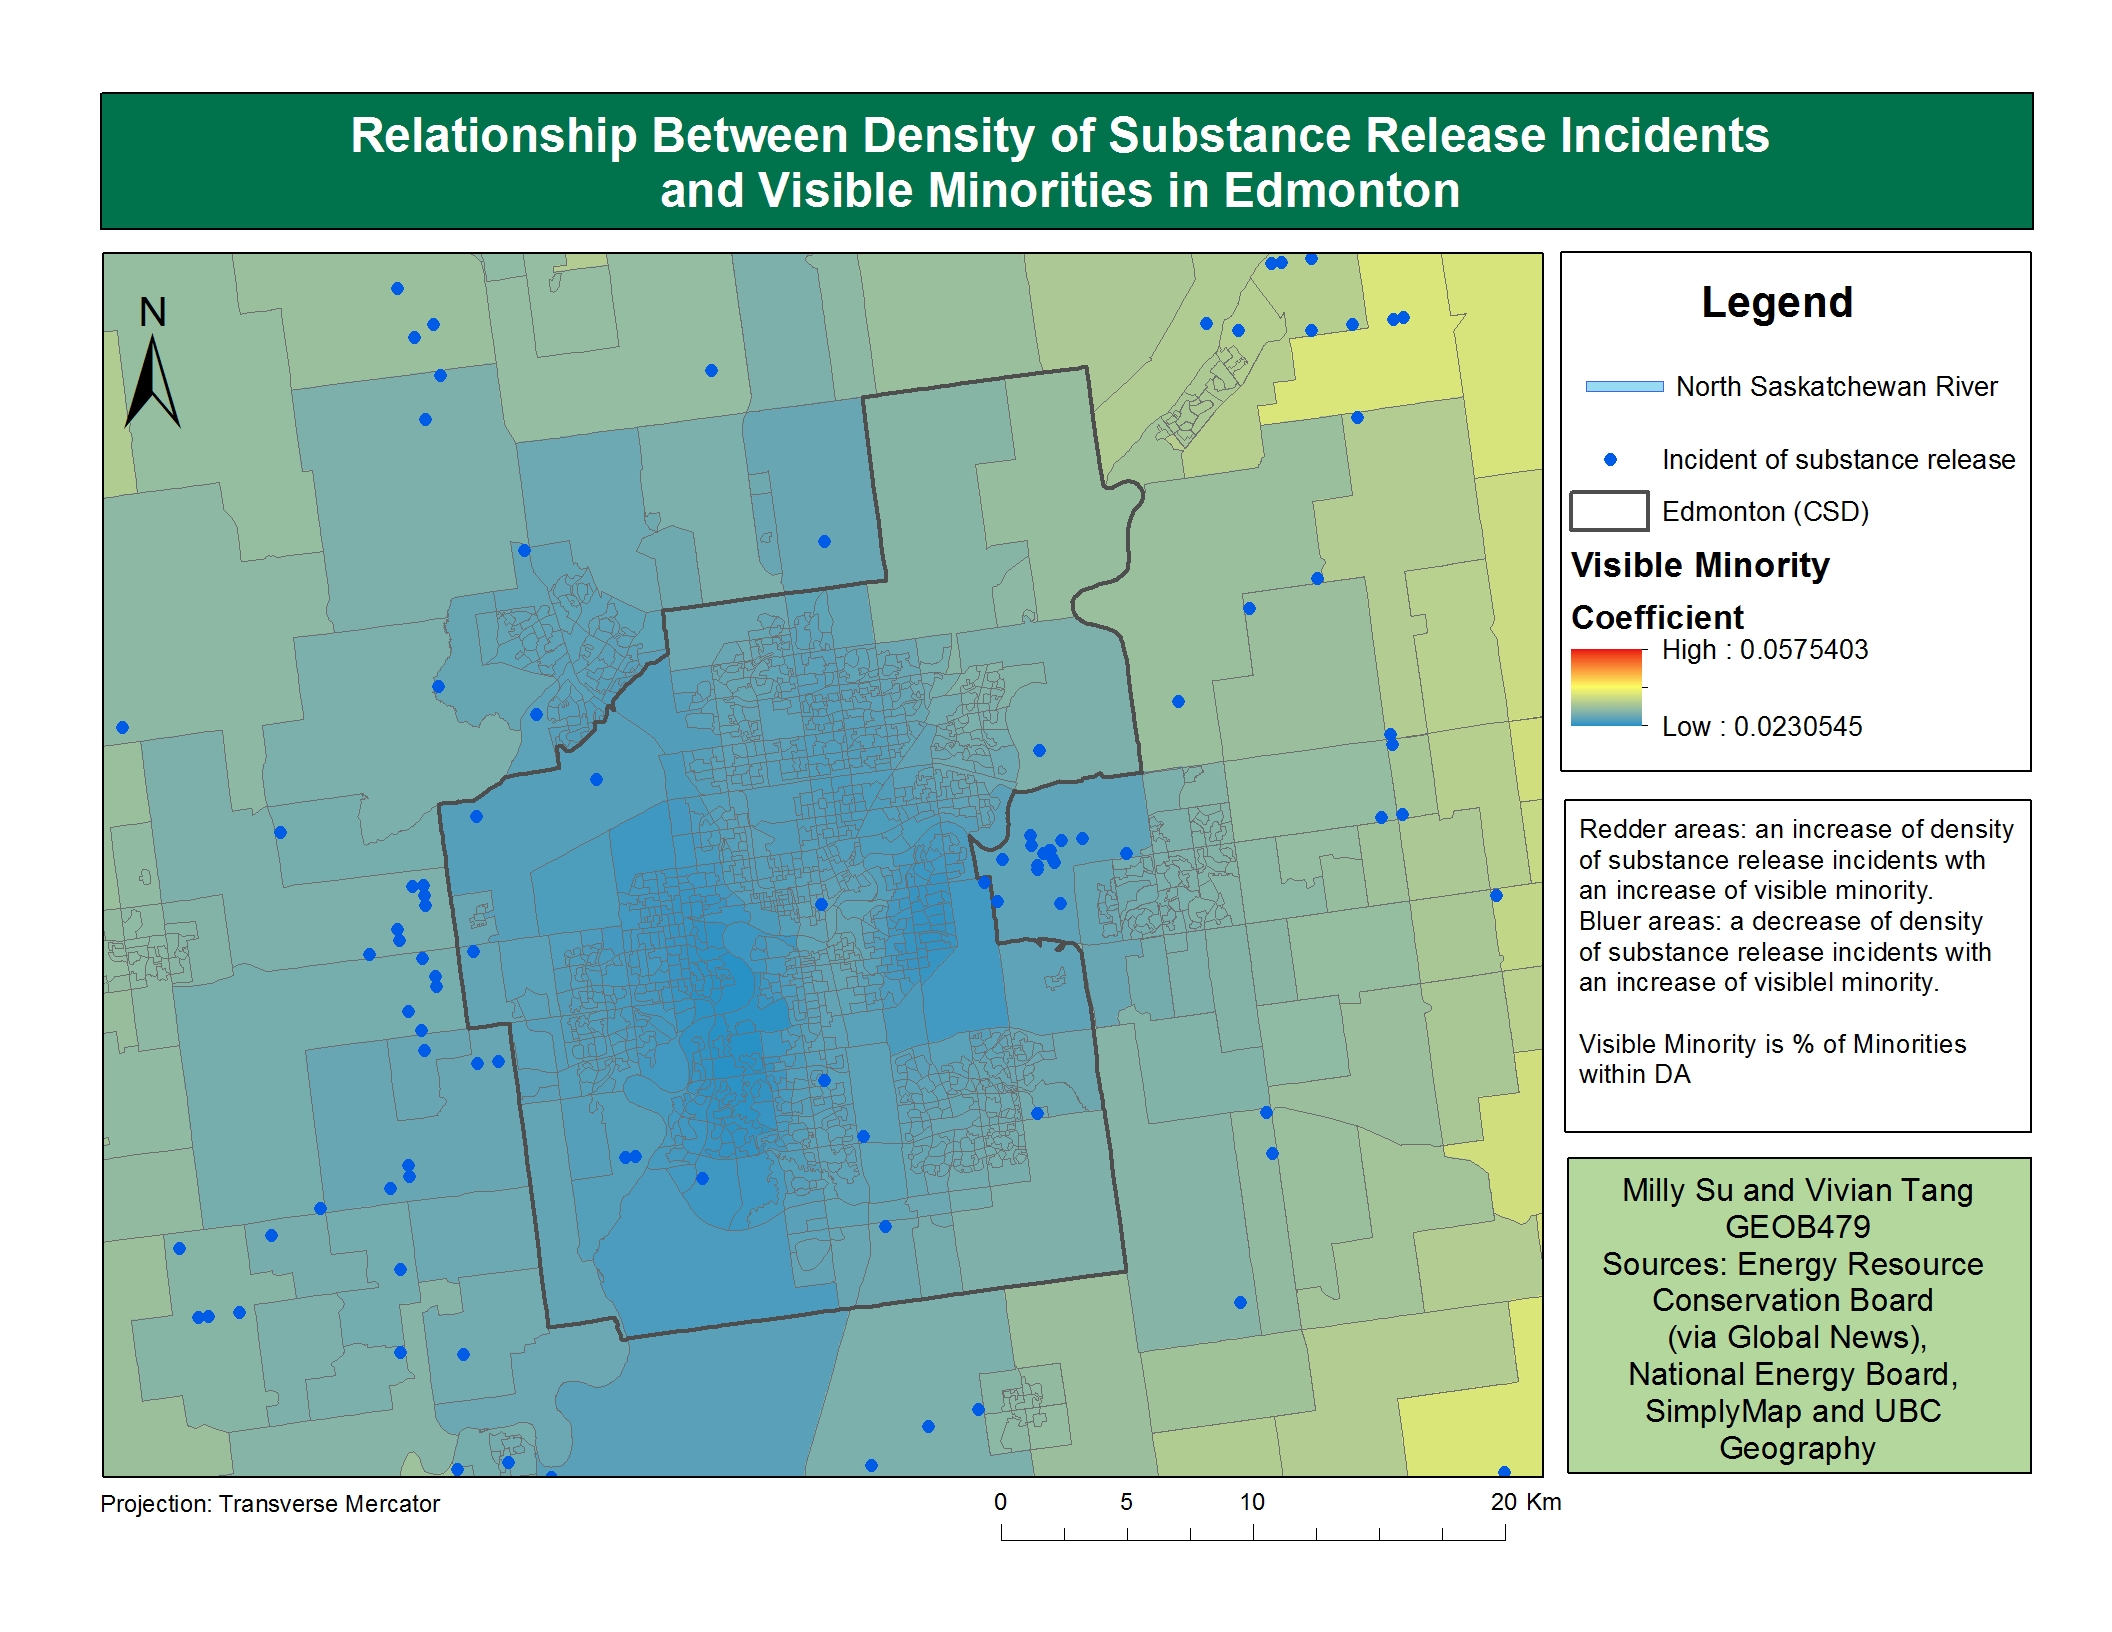
figure 6. Density of Substance Release Incidents and Visible Minorities
In figure 6 we see an overall low coefficient for visible minority. There is a low positive relationship between visible minority and density of release incidents. This is unexpected as we expect areas with higher numbers of visible minorities to be most affected. The coefficient range is also all positive. While this is unexpected, it is likely due to the fact that visible minorities are mostly found in the Edmonton urban area. There was a low percentage of visible minorities outside of the urban region, making this census variable unreliable in our GWR model.
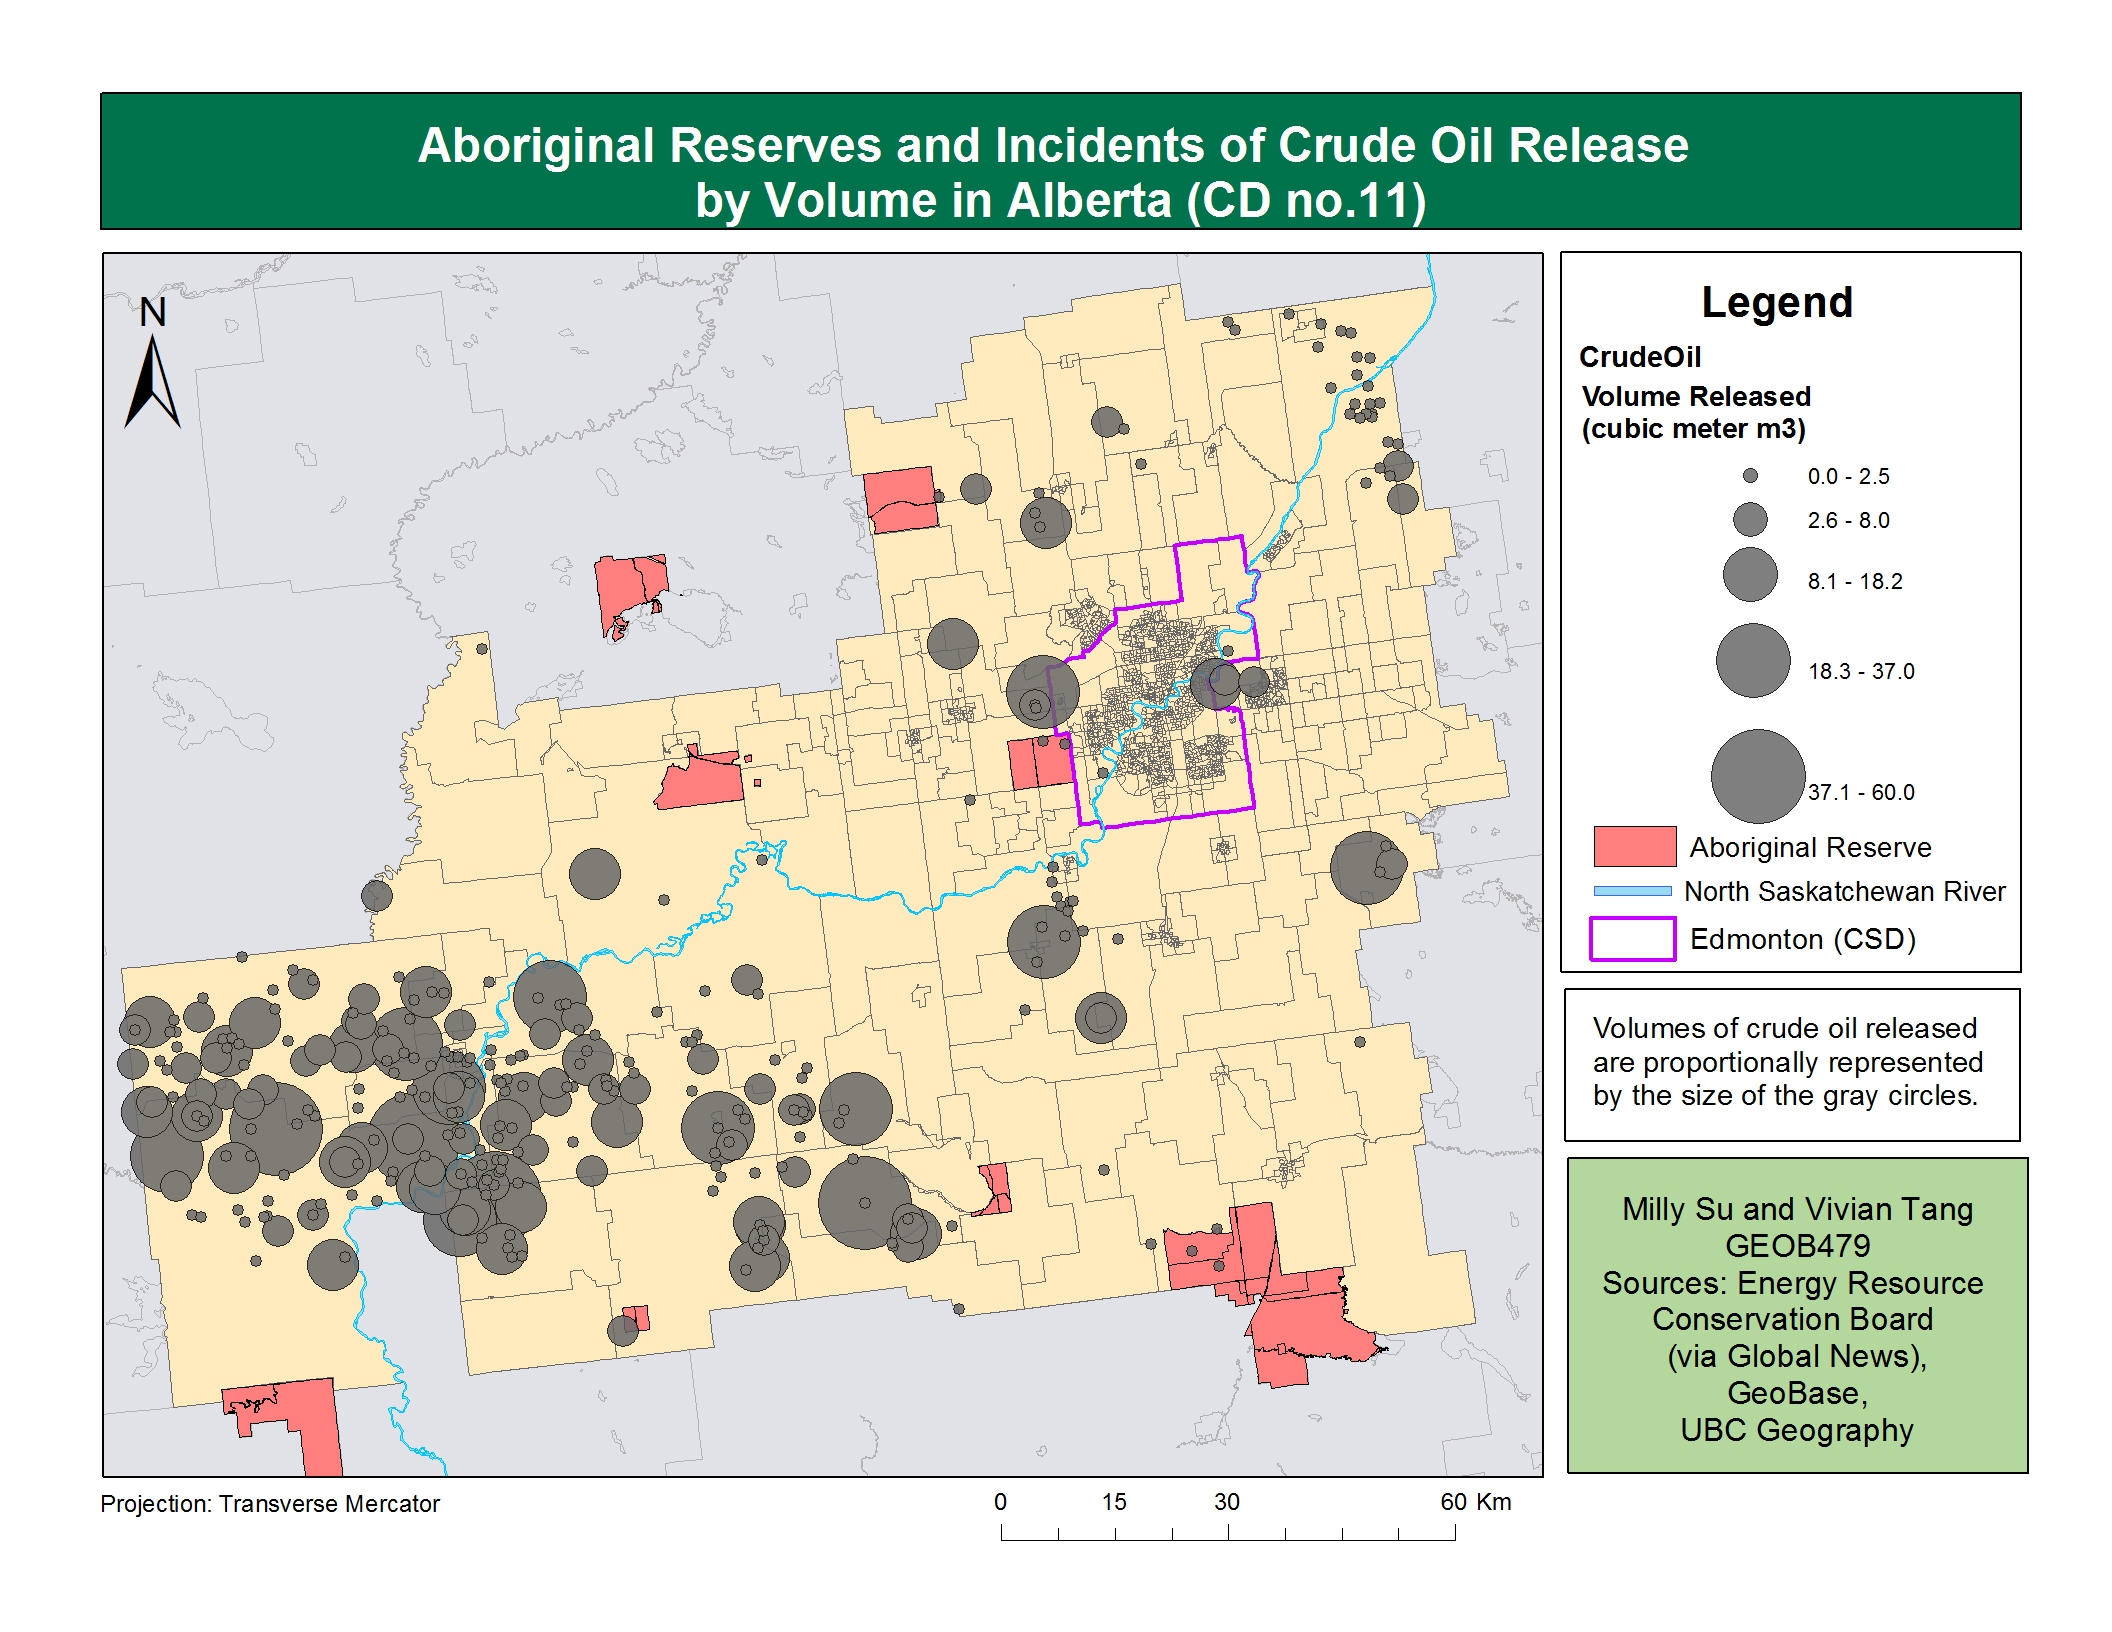
figure 7. Aboriginal Reserves and Incidents by Volume in CD no.11
Figure 7: Despite our research and findings on the effects of oil sands on Aboriginals in Alberta, as an explanatory variable, the % of population who identified as Aboriginal was found to be insignificant in our exploratory regression analysis. When we map the location of Aboriginal reserves with our incidents, we realize that quantifying the environmental impacts of oils sands through spill incidents was not the best method in investigating environmental justice for Aboriginal people. Aboriginals are exposed to environmental discrimination with regards to oil sands, but more specifically, through water contamination due to pollution in the river. As well, the use of census data is not always reliable because not everyone chooses to participate.
Further Analysis
Our analyses did not produce the results we were hoping to find. Our explanatory variables did not include the Aboriginal populations, which was an important factor we found through literature. While census variables that we found to be more significant had mixed results. We realized the complexities of analyzing environmental justice and decided to shift our focus to see if we could find stronger relationships in our data.
Our initial variables looked at environmental justice from an urban perspective, while Alberta may experience environmental justice differently. For further analysis, we shifted our focus to the agricultural areas (western area of CD), outside of the urban center where there are higher volumes of substance releases. We also decided to include more site-specific variables by taking into account the different labour forces and the dependent variable was narrowed down to only include crude oil releases with an emphasis on volumes released. Read our further analysis here.