A simple moving average (SMA) calculates the average of a selected range of prices, usually closing prices, by the number of periods in that range.
The SMA is a technical indicator that can aid in determining if an asset price will continue or reverse a bull or bear trend.
Strategy
The agent buys the AMZN stock when the SMA for 5 days, is greater than the SMA for 9 days. The agent sells vice versa.
Example
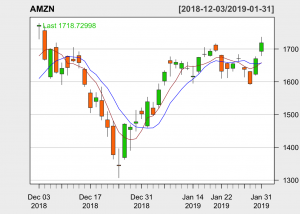
Bob wants to make money of the stock market, he descides to invest his $100,000 using a simple SMA strategy.
He plots the stock chart with the SMAs and decides to buy when the red line crosses the blue line and sell the stocks when the blue line crosses the red line.
He is happy because he is riding the trends and making money by buying and selling AMZN stocks. So he decides to always reinvest his returns in AMZN.
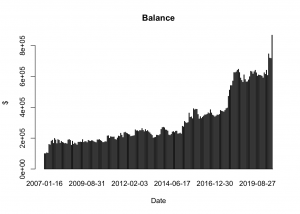
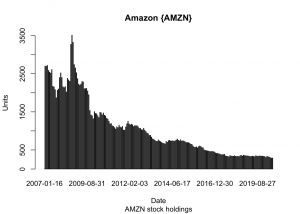
Visualizations.
Shown below are the plots of Bob’s portfolio balance starting with a mere $100,000 and his AMZN stock holdings.