The 2015 Undergraduate Experience Survey (UES) suggested that teaching practices do influence student mental wellbeing. For example, students have indicated that teaching practices such as engaging students in the learning process and having clear instructions on how to succeed in class were helpful to their learning and wellbeing. Based on these preliminary findings, we adjusted the questions in the 2016 UES to further explore students’ perceptions of teaching practices.
For the 2016 question set, students were asked to allocate 100 points between 14 teaching practices based on the degree to which each teaching practice positively impact their wellbeing:
- How would you rate the following teaching practices in terms of the degree to which they have positively impacted your wellbeing? Rate the following teaching practices by distributing 100 points amongst them. You can distribute your points any way you like, but they must total to 100. Note that by giving a teaching practice more points you are indicating that it has had a greater impact on your wellbeing.
5548 students completed the question. In addition to analyzing the data for the whole sample, the data was also analyzed by demographic information. Specifically, by year level, faculty, gender and international student status. While there were statistically significant differences in the means, the ranking of the teaching practices was roughly the same. For all year levels, both genders, international and domestic students and all but one faculties, the top three teaching practices for promoting wellbeing (among the 14 asked) were:
- When the instructor is clear about the expectations for assessment
- When the instructor takes complicated assignments and breaks them into smaller components
- When the instructor is clear about the course objectives
The table below shows the mean number of points allocated to each of the 14 teaching practices. The expected average (i.e. if students allocated an equal number of points to each teaching practice) is 7.14.
| Teaching Practice | Mean |
| When the instructor is clear about the expectations for assessment | 11.374 |
| When the instructor takes complicated assignments and breaks them into smaller components | 10.592 |
| When the instructor is clear about the course objectives | 10.253 |
| When the instructor makes explicit connections to concepts I know of – including common knowledge and prior learning | 8.211 |
| When the instructor provides feedback at multiple points in the course | 8.162 |
| When the instructor communicated her/his passion and enthusiasm for the discipline | 8.098 |
| When the instructor assigns problems and tasks that made clear the relevance and application of the learning to the world outside the classroom | 6.513 |
| When the instructor is accessible outside of class (i.e. office hours, email) | 6.492 |
| When the instructor suggests effective study strategies for the course | 6.120 |
| When the instructor is flexible with assignment deadlines | 5.422 |
| When the instructor is clear about how students can catch up on required, prerequisite knowledge they are missing | 5.402 |
| When the instructor creates/fosters a supportive classroom environment | 5.093 |
| When the instructor creates/fosters a safe classroom environment | 4.318 |
| When the instructor offers choice in assignments | 4.310 |
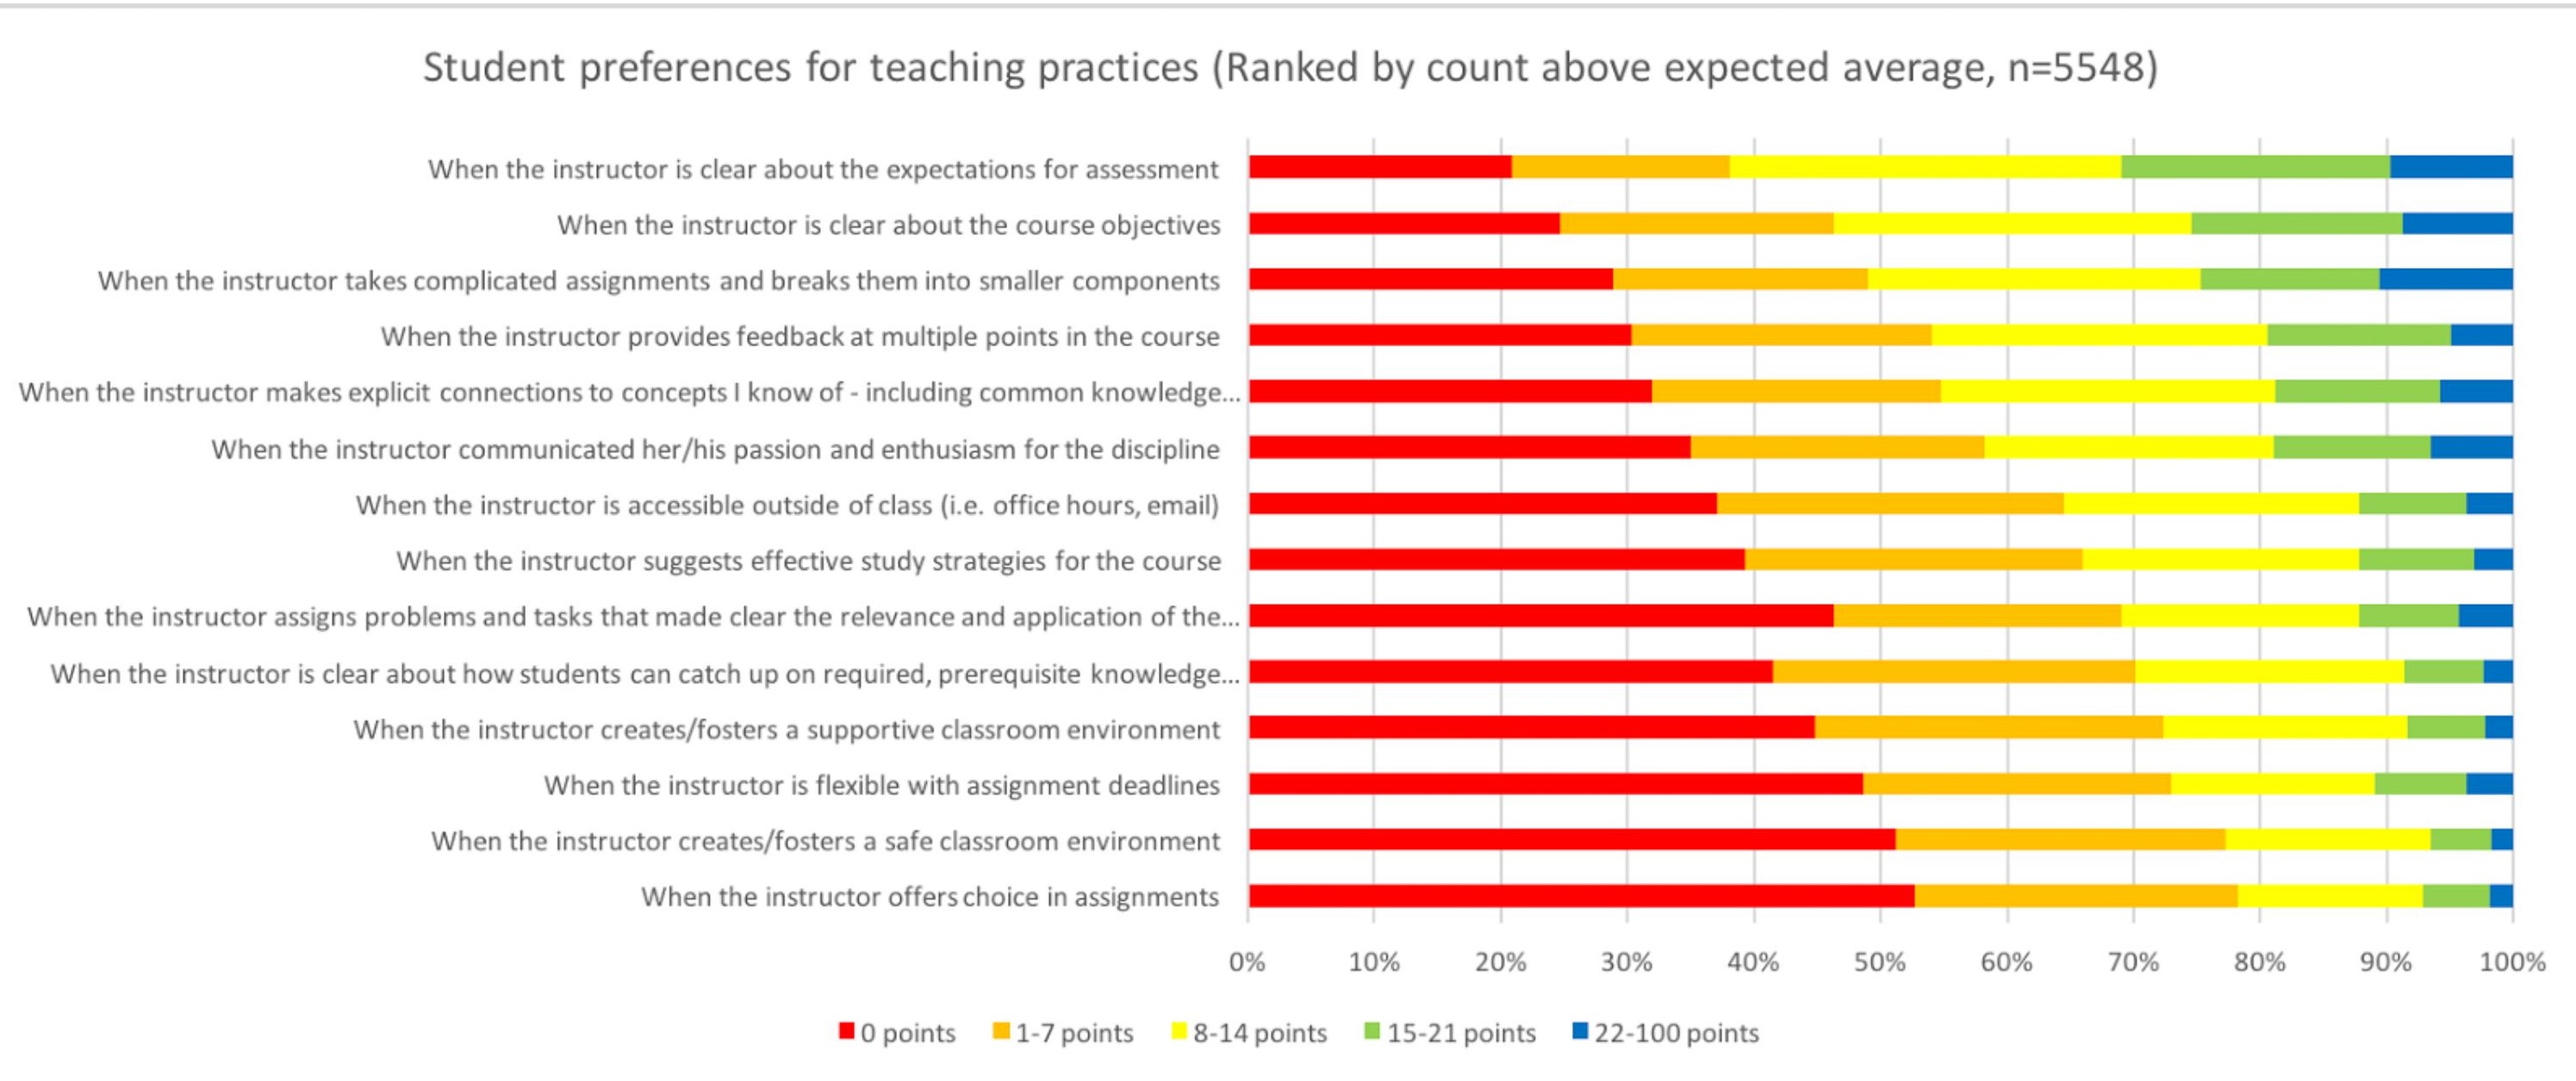
The chart below shows the breakdown by bucket. Red bars indicate the percentage of students who allocated zero points to a teaching practice. Orange bars are between 0 and 7 points – some positive impact, but below the expected average. The “bucket” size of 7 was reused for two additional intervals before becoming too small to be meaningful.
This finding gives us a glimpse into the kinds of instructional practices that have the greatest positive impact on student wellbeing. Are the results surprising to you? Why or why not?