Skip navigation


Introduction

Norman Borlaug argued that “water covers about 70 percent of Earth’s surface; about 2.5 of it is fresh water, and most of this is frozen in ice caps, soil moisture or in deep aquifers, not readily accessible for human use” (Borlaug, 2018). In the United States alone, water infrastructure in the twentieth-century costed 400 billion dollars, nonetheless, the cost is not purely economic. Poor water management has involved environmental degradation, biodiversity loss, contamination of water sources, human dislocation and other hidden water development costs (Gleick, p. 128, 2000). Moreover, water management is an area that covers a vast network of different topics, that can not be entirely discussed on this paper. Nevertheless, some of the most important challenges regarding this thematic have been explored here. First, water is analysed through the idea of ‘social construction of nature’ to entirely comprehend the social construction of water in certain scenarios. An introduction about Edward Said’s imaginative geographies is also provided here. Additionally, an example that involves these concepts is depicted by the Canadian misconception of fresh water abundance.

This misconception has led to poor consumer behavior in Canada. By using this example, the importance of having a clear view towards renewable fresh water abundance can help to introduce better policies, decisions and management regarding water. Therefore, if consciousness is raised in relation to fresh water abundance, governmental and individual water management will lead to a more sustainable usage of water. Second, should water be a resource of the commons, or it should be commodified? In regard to this question, the ‘commodification of nature’ is presented as a way to engage with the privatization of water. Both sides of this question will be analysed here, by considering the pros and cons of public versus private water. The efficiency of both systems in terms of supply, will be discussed in this paper as well. Moreover, the complexity of this issue also relies in the decision of converting collective users into individual consumers, leading to a lack of public interest. The relevance of this topic rests upon the global supply of water, and what system could serve as the best way to deliver this resource to its users. Third, the value that ‘political ecology’ represents for water management is also developed here. There are many challenges involving water management, and a wide perspective that integrates socio-environmental issues with politics is essential to reach higher sustainable goals. Hence, to highlight the role that political ecology has towards water issues, the practice of hydraulic fracturing has been explored in this section. Water use, contamination and waste produced by fracking are analysed from a political perspective, where a lack of policies and regulations are one of the main drivers of ecological concerns. Thus, it is essential to track where the issues surrounding water come from, in order to implement better systems and policies to achieve a sustainable interaction with this resource.

Social Construction of Nature

In relation to the idea of the social construction of nature, it is helpful to develop first the concept of ‘imaginative geographies.’ To begin with, Edward Said portrays the idea of imaginative geographies in his book Orientalism. Said depicts ‘objective space’ as the physical characteristics of a house, like its walls, pillars, windows, and other material elements that can be precisely measured (Said, 1979). However, this house can adopt an imaginative value, evoking different feelings and sensations, leading to the main idea of imaginative geographies: ‘the perception of space’ (Said, 1979). In addition to this concept, ‘social construction’ refers to how something is understood and perceived depending on people’s social depictions toward it (Robbins, 2014). This construction can be built up through several elements including ideas, images, assumptions and other types of representations (Robbins, 2014). The purpose of emphasising these concepts, is due to the weight that they represent in our societal behaviour, because people tend to act based on their perception towards something, instead of its essence. Relating imaginative geographies to water management, the way water is perceived by a group of people, can influence the way its managed. All in all, perception shapes behaviour, behaviour leads to action, action creates reaction.

Canada’s Water Myth

Canada’s perception towards fresh water abundance is one example. Indeed, this country contains one-fifth of the fresh water reserves in the world, but most of it, is non-renewable fossil water (Government of Canada, 2018). Renewable water on the other side, consists in the constant annual process of rainfall, and the following water flow in terrestrial and underground systems (Sprague, 2007). In other words, the water that is accumulated in lakes and similar bodies, is equal to having several glasses of water that—without further replenishment—will go empty sooner or later. Renewable water on the other hand, is a constant cyclic flow, that is available at any time and replenishes aquifers, wells, lakes and similar water pockets (Sprague, 2007).

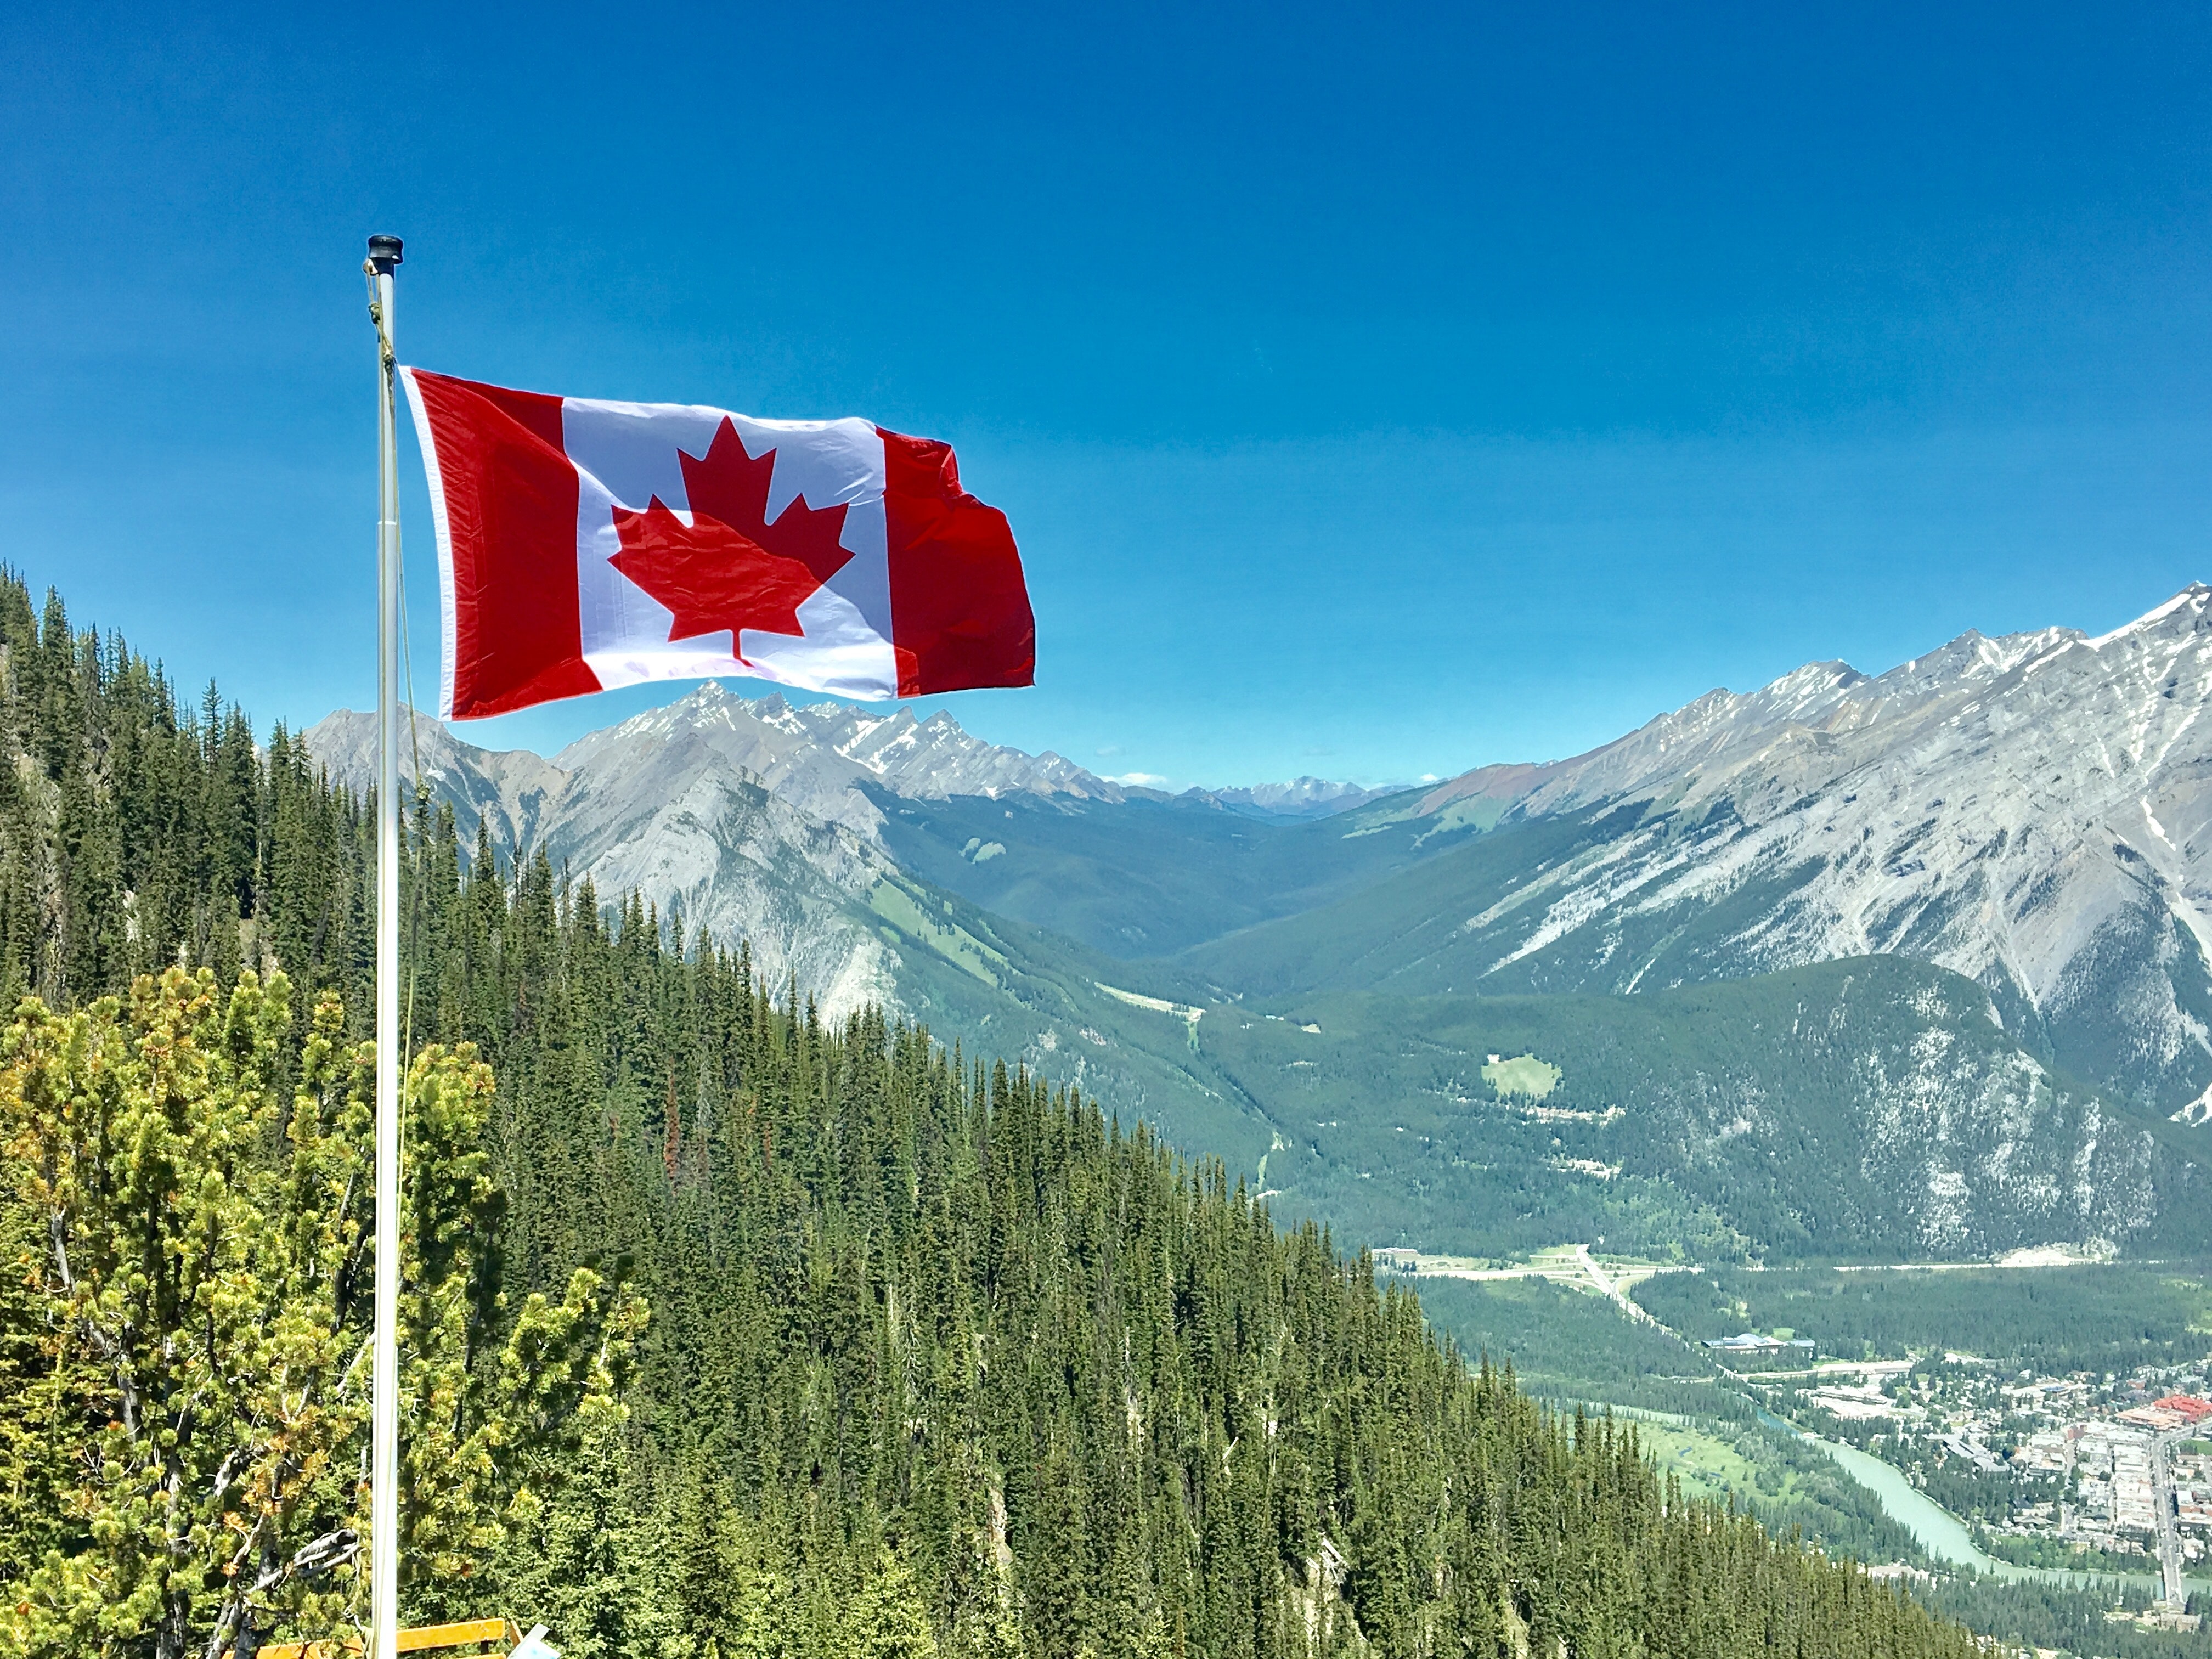
In respect to this, no matter how big a lake is, the misuse of water will drain it entirely without further replenishment. Furthermore, Canada accounts for only 6.5 percent of the world’s renewable water (World Resources, 2004). Additionally, only 2.6 percent is available in the southern region of the country, which is remarkable, because the use of renewable water from the northern region would be more expensive due to infrastructure and logistic additional costs (Sprague, 2007). In overall, the initial depiction that has been constructed by images and even statistical data, has resulted in a fake perception of abundance. By analysing more deeply this issue, a new imagery arises, where the immediately available quantity of this natural resource is significantly reduced.

Moreover, the importance of this example relies upon the idea of careless water consumption, based on the perception of abundance. Indeed, if a resource is vastly abundant, why worry about usage limitations and restrictions? This model of thinking could be dangerous, especially if it originates from an illusory knowledge foundation. In the Canadian freshwater supply case, it would be useful for the authorities and citizens to acknowledge the real percentage of renewable water available to them, therefore to make a more sustainable use of this resource. By having a clear idea of how much renewable water Canadians actually have, a more conscious behaviour towards water management could be promoted.

Commodification of Nature

Since water is a vital natural resource for humans to fulfill their most basic necessities, it is highly desirable to provide a worldwide access to this human right. Nonetheless, our society is still lagging behind this concept, and opposed to this idea—water has been treated in several occasions as another commodity by restricting its access to the ones who can afford it. Moreover, 50 litres of water per person per day has been estimated as the minimum amount that people need to cover their basic necessities, but in 1990 around 20 percent of the world population were below that cipher (UNEP, 2000). Therefore, this dilemma is analysed below, by presenting the pros and cons of public versus private water, and how efficient these entities are when it comes to supply individuals with this resource.

Public or Private Water?

Should water be a public good (where users are a collective group of citizens), or should water be a commodity (where users are individual customers)? Initially, in the 19th century water demand and infrastructure increased significantly, where private corporations took the lead in America and Europe, by supplying water to the rich and leaving the poor in a vulnerable position (Bakker, 2003). In response to this inequitable system followed by negative consequences like water borne diseases, several governments transformed water into a public good during the 20th century, therefore to enhance public health and provide public access to water, usually at a municipal scale (Bakker, 2003). Arguments in favor of privatization, however, state that public participation does not have enough resources to provide access to fresh water for the 1.2 billion people around the world lacking this service (Davis, 2005). Also, the large amount of funding that water supply requires to build proper infrastructure is so immense for both developing and developed countries, that governments have allowed in many occasions private firms to partake in this field (Davis, 2005). Additionally, a review of 100 studies comparing the efficiency of state owned and private companies, demonstrated that in highly regulated industries the public sector does better in overall, and the private sector performance is more efficient in competitive scenarios (Davis, 2005). By analysing these results, it seems that the differences between public and private management of water, can be understood better, depending on the structure of the market.

Furthermore, privatization of water is sometimes seen as a good strategy to promote conservation due to pricing, and efficiency of production as any other business tries to achieve (Bakker, 2003). This, however, has to be tested in a larger scale, because it is estimated that only 5 percent of the planet is being supplied by the private sector (Budds & McGranahan, 2003). Also, because there is a higher purchasing power in urban areas, the private sector might give more importance to them, when they are already well served (Budds & McGranahan, 2003). Lastly, by transforming water into an economic good, citizens will become individual consumers instead of collective users, meaning that the public interest will be left behind (Bakker, 2003).

Political Ecology

There are several issues surrounding water nowadays, but who or what is accountable for these problems? To understand better this question, several thinkers have tried to formulate answers by analyzing the relationship between elements like economic, political, and social outcomes with ecological concerns. One example is Thomas Malthus, who blamed humans and their rapid population growth, for the environmental issues that the world was facing (Robbins, p. 15, 2010). The problem with theories like this—usually occurs when there are other variables not included in the equation, leading to poor conclusions. Hence, this section will introduce the concept of ‘political ecology’ and how this idea serves to understand better the challenges surrounding water in our society.

In the water sphere there are several questions that can help us to understand where are the origins of certain issues, and who are the actors involved. For instance, why there is water scarcity in some regions? What is contaminating watershed ecosystems? Who is benefiting from these ecosystem and water usage? What organizations, if any, are introducing water related policies to solve these problems? These questions are just some examples that can help to deconstruct the large spectrum surrounding water management. Therefore, ‘political ecology’ tries to analyse environmental and societal issues by relating these elements with political processes (Robbins, p.20, 2010). Additionally, political ecology does not only argue that ecological systems are also political, but it tries to find what elements are responsible for environmental change, thus providing less disrupting and sustainable solutions toward ecological mismanagement and degradation (Robbins, p. 20, 2010). Below, a discussion about hydraulic fracturing will help to represent the effect that politics can have in terms of fresh- water quality and quantity.

Fracking and Water Policies

            To briefly introduce this topic, hydraulic fracturing is a process that takes advantage of the enormous amounts of ‘shale gas’ that is expected to be found between layers of rock deep underneath the surface (Sovacool, p. 250, 2014). As it is considered to be abundant, shale gas is supposed to be a great source to provide energy for cities and similar recipients, however, a problem arises when analysing the extraction process to retrieve this underground gas. For the purpose of this paper, only the fracking environmental issues directly related to water will be considered, leaving aside a long list of other concerns. Continuing, fracking involves a process of drilling vertically and horizontally several kilometres below earth’s surface, then, large amounts of water are used per well to create fractures and release the gas (Sovacool, p. 251, 2014). The amount of water pumped per well varies, but millions of gallons are usually required, and they are mixed with thousands of gallons of chemicals (Sovacool, p.251, 2014). Indeed, 70 substances found in fracking fluid are considered toxic and 29 cancerous (Grecu et al., 2018). This information is relevant, because leaks of fracking fluid are very common and these chemicals tend to reach surface water recipients, contaminating not only drinkable water, but watershed ecosystems (Jackson et al., 2014). Also, the fluid pumped into the ground fluctuates and migrates upward, plus contaminating underground water systems (Jackson et al., 2014). Therefore, it is not only about water quantity, but also quality that is lost because of fracking techniques. Nonetheless, the problem does not conclude here, because the management of wastewater is even worse. According to the United States Environmental Protection Agency (US EPA), between the years 2006 and 2012, 452 spills of waste water fracking fluid or ‘brine’ have been detected (US EPA, 2016). Wastewater is another issue regarding fracking and there are many areas lacking regulations and investigation processes—West Virginia for example, where 62% of its fracking wastewater destination is unknown due to the lack of reporting requirements (Pothukuchi et al., 2018). Additionally, in certain U.S. states wastewater is still sent to water-treatment facilities that are unprepared to process all the chemicals included in the brine, and other states spray the wastewater in roads for dust control purposes (Neville, 2017). Also, many of the chemicals used in fracking are not even released by fracking companies because of trade secret laws (Neville, 2017). As depicted in this section, poor municipal and provincial regulations have led to a careless fracking practice, where tons of water are wasted, contaminated or accidentally spilled, polluting other fresh water ecosystems. In Europe however, environmental priorities have led to ban fracking practices, as well as in Canada; where Quebec and Nova Scotia have banned fracking due to ecological threats (Neville, 2017).

While analysing the fracking industry in relation to water, it is clear that policies and regulations play a vital role to preserve the quality and amount of water worldwide. This is why political ecology tries to deconstruct non-friendly environmental activities like hydraulic fracturing, and serves as well as a path to regulate, ameliorate or stop these practices that are threatening fresh water. Lastly, the political ecology community is not something limited to a group of political ecologists, but it is closer to a social-web where all types of individuals are contributing to unveil environmental issues (Robbins, p. 21, 2011). Finally, these individuals can contribute in several ways like academic papers, experiments, blogs, films, or books that treat ecological concerns from a socio-political point of view (Robbins, p.21, 2011).

Conclusion

Water as a topic has been deconstructed and analysed in relation to three main concepts; the social construction of nature, the commodification of nature, and political ecology. By doing so, a deeper perspective about water challenges and management has been achieved. First, the socially constructed collective idea about Canadian fresh water abundance, has served as a way to analyse the problem of utilizing water without acknowledging its actual amount. Thus, a higher level of understanding towards renewable water, can help authorities and citizens to develop more sustainable methods to administrate this resource. Second, the commodification of water is another issue treated here. There are several arguments supporting and denying the commodification of water, specially when it comes to the supply efficiency. One of the great issues of privatizing water, is that the collective users are transformed into individual customers, leaving aside public interests. However, it is argued that private companies could be more efficient in developing water infrastructure, due to a higher interest in the business and the lack of financial capacity from the public sector. Nonetheless, the public and private sectors seem to work better accordingly to the market structure. Third, other socio-environmental issues have been discussed in relation to political ecology concepts. In addition, hydraulic fracturing was used as an example to portray how the lack of policies and the mismanagement of water, can affect the quality and quantity of this substance. Hence, political ecology focuses in the detection of political deficiencies, and tries to serve as a path to incorporate policies to ameliorate socio-ecological problems. Water in overall, include other numerous issues that could not be included in this work, thus, this paper has been designed to cover some essential elements regarding water management issues.

References

Bakker, K. (2003). Liquid assets. Alternatives Journal, 29(2), 17-21. Retrieved from http://ezproxy.library.ubc.ca/login?url=https://search-proquest-com.ezproxy.library.ubc.ca/docview/218733892?accountid=14656

Budds, J., & McGranahan, G. (2003). Are the debates on water privatization missing the point? Experiences from Africa, Asia and Latin America. Environment and Urbanization15(2), 87–114. https://doi.org/10.1177/095624780301500222

Climate Change Canada. “Water Availability in Canada.” Canada.ca, Innovation, Science and Economic Development Canada, 10 Apr. 2017, www.canada.ca/en/environment-climate-change/services/environmental-indicators/water-availability.html.

Davis, J. (2005). PRIVATE-SECTOR PARTICIPATION IN THE WATER AND SANITATION SECTOR. Annual Review of Environment and Resources, 30, 145-183. Retrieved from http://ezproxy.library.ubc.ca/login?url=https://search-proquest-com.ezproxy.library.ubc.ca/docview/219848716?accountid=14656

Gleick, Peter H. “A Look at Twenty-First Century Water Resources Development.” Water International, vol. 25, no. 1, 2000, pp. 127-138.

Grecu, Eugenia, Mirela I. Aceleanu, and Claudiu T. Albulescu. “The Economic, Social and Environmental Impact of Shale Gas Exploitation in Romania: A Cost-Benefit Analysis.”Renewable and Sustainable Energy Reviews, vol. 93, 2018, pp. 691-700.Sprague, J. (2007) Great Wet North? Canada’s Myth of Water Abundance. In Bakker, K. (ed.) Eau Canada, Vancouver, UBC Press, 23-36.

Jackson, R. B., Vengosh, A., Carey, J. W., Davies, R. J., Darrah, T. H., O’Sullivan, F., & Pétron, G. (2014). The environmental costs and benefits of fracking. Annual Review of Environment and Resources, 39(1), 327-362.

Neville, Kate J., et al. “Debating Unconventional Energy: Social, Political, and Economic Implications.” Annual Review of Environment and Resources, vol. 42, no. 1, 2017, pp. 241-266.

“Norman Borlaug Quotes.” BrainyQuote.com. BrainyMedia Inc, 2018. 2 December 2018. https://www.brainyquote.com/quotes/norman_borlaug_793405

Pothukuchi, Kameshwari, Melissa Arrowsmith, and Natalie Lyon. “Hydraulic Fracturing: A Review of Implications for Food Systems Planning.” Journal of Planning Literature, vol. 33, no. 2, 2018, pp. 155-170.

Robbins, P., Hintz, J., & Moore, S. A. (2013). Environment and society: a critical introduction. Retrieved from https://ebookcentral.proquest.com

Robbins, Paul. Political Ecology : A Critical Introduction, John Wiley & Sons, Incorporated, 2011. ProQuest Ebook Central, https://ebookcentral.proquest.com/lib/ubc/detail.action?docID=822568.

Said, Edward. Orientalism. Vintage Books, 1979

Sovacool, B. K. (2014). Cornucopia or curse? Reviewing the costs and benefits of shale gas hydraulic fracturing (fracking). Renewable and Sustainable Energy Reviews, 37, 249-264.

UNEP. (2000). Dams and Development: A New Framework for Decision-Making. The Report of the World Commission on Dams. London and Sterling, VA: Earthscan.

World Resources 2002-2004: Decisions for the Earth: Balance, Voice, and Power. World Resources Institute, 1 June 2003, wriorg.s3.amazonaws.com/s3fs-public/pdf/wr2002_fullreport.pdf.

Roma en la Península

La historia del territorio conocido hoy en día como España es muy rica en acontecimientos, y uno de los hechos más recalcables es la huella que dejó el imperio romano. De hecho, Roma entra en la Península debido a un llamado por parte de los griegos, que en ese entonces tienen problemas con los cartaginenses.

Durante los siglos (264-146 a.C.), Cartago y Roma se enfrentan librando las famosas “guerras púnicas”, en las cuales Roma consigue imponerse y conquistar la Península. Posteriormente el emperador Octavio Augusto incorpora la Península al imperio.

Prosiguiendo estos acontecimientos históricos, Roma instaura en lo que ahora adquiere el nombre de Hispania, una serie de colonias, ciudades y municipios. Además, dominó este territorio por siete siglos, unificando cultural y políticamente a Hispania. Habiendo dicho esto, no es raro que en España se puedan encontrar restos de la civilización romana, pero si es destacable que aún después de tantos siglos existan restos arquitectónicos en buen estado.

Arquitectura Romana

Para comenzar, la arquitectura romana ha sido siempre comparada con la griega, y aunque estos dos estilos comparten varias características, su mayor diferencia se da en lo artístico y funcional.

Si bien es cierto, Roma hereda varios elementos de Grecia, pero en el ámbito artístico es donde Grecia se distingue enormemente. Sin embargo, la arquitectura romana se basa en la utilidad, o en otras palabras; el arte sigue a la función. Esto puede derivarse del carácter realista que tenían los romanos a comparación del carácter idealista de los griegos.

En general los principales elementos constructivos romanos son:

  • El arco, el cual se heredo de previas civilizaciones como los etruscos y griegos, y posteriormente fue mejorado
  • El dintel o arquitrabe, que da la facilidad de crear vanos en los muros, para formar puertas y ventanas
  • El arco adintelado, que se convierte en una creación propia y limita lo máximo posible a la curvatura del arco, hasta quedar completamente plano en varias ocasiones y sostenido por la compresión de ambos lados hacia el centro
  • Entre otros logros arquitectónicos de los romanos, ellos emplearon la bóveda cañón y de arista, además de la cúpula, para lograr cubrir grandes espacios internos con estos

Características y Materiales

  1. Se utiliza el hormigón como material constructivo
  2. Son posibles los edificios de varias plantas
  3. El estuco, mármol y mosaicos sirven como revestimientos
  4. Los diseños se basan en el eje y la simetría
  5. Es tomado en cuenta el espacio exterior al mismo tiempo que el interior
  6. Se emplean conceptos urbanistas para posicionar al edificio en torno al ámbito urbano
  7. La decoración y ornamentación son de carácter expansionista y autoritario
  8. El uso del ladrillo se perfecciona al ser usado de diferentes maneras
  9. Luego de adoptar ciertos estilos griegos como el dórico, jónico y corintio, los combinan y dan origen al toscano y compuesto
  10. Gracias a una desarrollada ingeniería, crean sorprendentes puentes, acueductos, y carreteras que incluso hoy en día se mantienen

Restos Arquitectónicos en España

Como ya se ha mencionado antes, hoy en día en España se pueden encontrar varias construcciones romanas por razones históricas. Incluso se pueden realizar expediciones a lo largo de rutas turísticas, para apreciar las construcciones romanas que han quedado en pie en varias ciudades españolas.

Vía de la Plata

Los romanos son recordados por haber construido calzadas alucinantes, que aún se mantienen en buen estado. En España se puede apreciar una ruta, la cual fue construida en la época romana para el transporte de mercancías, y para agilitar la comunicación, llamada “Vía de la Plata”.  Este camino conduce desde Sevilla hasta Gijón, y en su tiempo servía para desplazarse desde Mérida hasta Astorga. A lo largo de esta vía puesta al uso a partir del siglo I, se pueden observar varios legados arquitectónicos dejados por los romanos. Un ejemplo recalcable es el Teatro de Mérida.

Teatro Romano de Mérida

Esta gran obra arquitectónica fue elaborada en el año 16 y 15 a.C., y su uso específico era para la exposición de juegos y arte escénica. Su material base fue el hormigón y el aforo abarca hasta seis mil personas. Un uso contemporáneo que se le ha dado a este espacio, es para celebrar cada año el Festival de Teatro Clásico de Mérida.

El Anfiteatro de Tarraco

Esta asombrosa edificación declarada Patrimonio de la Humanidad por la UNESCO, esta ubicada en la ciudad de Tarraco. El anfiteatro fue construido en el siglo II d.C., y sus usos fueron muy variados. En general este lugar era famoso por las luchas entre gladiadores, incluyendo luchas contra animales salvajes. Aunque también servía como escenario para las ejecuciones de los enemigos de Roma. El anfiteatro contaba con una arena, la cual contenía fosas en el centro cubierto por tablones de madera, donde habitaban las fieras. El aforo podía contener hasta catorce mil espectadores, he incluso contaba con un techo plegable de tela para proteger del sol al público.

Para concluir, España contiene varias obras arquitectónicas que han quedado del imperio romano. Muchas de ellas todavía son utilizables ya que fueron hechas con una gran visión, y su calidad en términos constructivos es de larga duración. Estas obras son parte del legado que Roma dejo luego de haber conquistado la Península Ibérica, y hoy siguen dando lugar al asombro. Incluso, existen varios tours turísticos donde se pueden apreciar varios edificios romanos, y otras obras como puentes y acueductos. En sí, los romanos no fueron grandes artistas en comparación con los griegos, pero para el arte funcional como lo es la arquitectura, fueron inmensamente destacados. Si bien es cierto, ellos heredaron técnicas por parte de los griegos y etruscos, pero luego las fueron desarrollando más y creando nuevas técnicas que perduran hasta el día de hoy. Muchos restos de su arquitectura han sido conservado en España he incluso han sido catalogados como Patrimonio de la Humanidad por la UNESCO.

Referencias

Cantarino, Vicente. Civilización y Cultura De España. Pearson/Prentice Hall, Upper Saddle River, N.J, 2006.

Castro et al. “Historia De La Arquitectura.” Facultad De Arquitectura. Universidad De San Pedro Sula. San Pedro Sula, Honduras, 3 Mar. 2012, historiaarqusps.files.wordpress.com/2012/03/roma-arquitectura-y-urbanismo.pdf. Acceso 4 Nov. 2017.

Gobierno de España. “Hispania Romana: Arquitectura, Arte Y Monumentos Romanos En España.” España Es Cultura | Spain is Culture: Portal Oficial De La Cultura De España, 19 Nov. 2017, www.xn--espaaescultura-tnb.es/es/estilos/hispania_romana/. Acceso 3 Nov. 2017.

Nueva León Universidad. “Arquitectura y Cultura Roma.” Facultad De Arquitectura / UANL, 15 Feb. 2013, arquitectura.uanl.mx/PDF/Temporal/arqycultura/clase05romaarquitecturaycultura.pdf. Acceso 3 Nov. 2017.

RTVE. “El Anfiteatro De Tarragona – Ingeniería Romana.” Ingeniería Romana – Laboratorio RTVE.es, 18 Dec. 2015, lab.rtve.es/ingenieria-romana/tarragona/anfiteatro/. Acceso 2 Dec. 2017.

Turismo Mérida. “Teatro Romano.” Turismo De Mérida, 17 July 2017, turismomerida.org/que-ver/teatro-romano. Acceso 3 Nov. 2017.


Environmental Impacts

The effects of the dramatic event have been widespread. The accident directly affected the lives both of the workers at the power plant and of over 150,000 evacuees. Moreover it has had a massive impact on the atmospheric and natural environment, as well as human health. After the meltdown, the radioactive emissions from the plant caused a broad radioactive contamination of the region. It mostly affected the North Pacific, but high levels of radioactivity were also recorded in the Eastern Honshu Island as well as the Tokyo Metropolitan area. Increasing levels of radiations have also been recorded in the Northern Hemisphere and the North American Western’s coasts have been feeling its effects for years.

Radioactive emissions in the atmosphere

There were multiple sources of emissions, from the four explosions to the smoke and the evaporation of seawater used for cooling. Radioactive isotope spread into the atmosphere, doses reached up to 6000 times the normal around the plant. The main fission products released were Iodine-131, Caesium-137 50, Strontium-89/90, Plutonium-238/239/240/241 and Xenon-133 and the emissions appeared to be much higher than after the Chernobyl incident (figure 1). The radioactive particles were then carried away by prevailing wind currents in the form of radioactive clouds, similarly to the phenomenon after Chernobyl’s disaster (figure 2)

Fig. 5. Distribution of soil activity concentration due to 134Cs and 137Cs within 80 km of the Fukushima Daiichi nuclear power plant. Considering radioactive decay, the activity concentrations in the graph were corrected to July 2, 2011 (The National Diet, 2012).

Fig. 6. Soil activity concentration of 137Cs until 20 April 2011 in the northern hemisphere (Stohl et al., 2012a).


In a desperate attempt to cool down the reactors, massive amount of water were used and contaminated. The water was then discharged in the ocean or seeped into soil and ground water deposits. Another source of pollution came from atmospheric fallout onto the ocean. This contamination of the marine environment represents the most important radioactive release into the sea ever recorded, on par with fallout from atomic bomb testing. In five years, Fukushima contaminated the entire Pacific Ocean, and is still leaking 300 tons of radioactive waste into it every day. However, the waters northeast of the plants are amongst the busiest fishing zones, 50% of Japan’s seafood comes from this area.

Soil contamination and effect on terrestrial ecosystems

Initially discharged in the air, the particles were brought to the surface by wet and dry depositions. From there, they are absorbed in the topsoil layer, where they can stay for many years and contaminate crops as well as ground-water sources. Several animal species have been studied in order to assess the effect of the meltdown on the local fauna. Morphological abnormalities in butterflies’ specimen, low blood cell counts in wild monkeys and reduction in population size of several birds species have been reported as result of exposure to radiations.

Effect on food and drinking water

The main concern of soil contamination is the effect on stock farming and agriculture. Indeed, there is no safe level of radioactivity in food and water; even the slightest amount can cause genetic mutation and cancer. According to the German Society for Radiation Protection, it is estimated that a person is normally exposed to about 0.3 mSv per year through ingestion of food and drink. In order not to surpass this level, the amount of radioactive caesium-137 should not exceed 8 Bq/kg in milk and baby formula and 16 Bq/kg in all other food. In Japan however, the permissible level of radioactive caesium was set at 200 Bq/kg in milk and 500 Bq/kg for all other food. During the months following the meltdown, the contamination was found to be very high in certain products such as vegetables and fruits, milk, beef, seafood, rice and drinking water.

Effects on health

 Effects varied depending on the risk taken by the different groups of population. Rescue and clean-up workers were the most affected by high radiation. Inhabitants of the contaminated areas were the second group the most affected, 200 000 of them had to evacuate immediately, and 70 000 were still living in a contaminated area several month after the disaster. Finally, thousands of people were affected through the ingestion of contaminated food or water. Children are the ones suffering the most from radiations, as their immune system is not fully developed. There is no consensus on the long-term health effects of exposition to low level radiation; however, it is known that a certain dose of radiation can cause acute radiation sickness or lead to the development of malignant diseases in the long-term. Some studies have been made to quantify the worldwide health effects of the accident. Using a linear no-threshold (LNT) model of human exposure, Hoeve and Jacobson (2012) estimated that, mostly in Japan, radiation from the Fukushima accident may eventually cause a best estimate death tolls of about 130 (ranging from 15 to 1100) by cancer-related diseases.

Fig. 3. Excess lifetime morbidity (incidence) and mortality (death) risk of all solid cancers from the uptake of 134Cs, 136Cs, 137Cs 133Xe, 129mTe, 132Te, 95Nb, 90Sr, 110mAg, 99Mo, 241Am, 238Pu, 239–240Pu, 241Pu, 242Cm and 243–244Cm in Japan from all internal and external exposure pathways using the Linear Non Threshold models for a lifetime of 89 years. The calculations were performed using the LMDZORINCA model for a spatial resolution of 0.45°–0.51°.

Source: Evangeliou et al. (2014b).

Introduction

The forest industry in Japan has been working since a long time to manage in an appropriate way this type of ecosystem. By implementing forestry practices and efficient methods for export of woods, forest owners and companies are trying to work in a sustainable way regarding this issue. Another measure to ensure a safe management of forests is the implementation of certain policies that help regulate the whole industry to avoid excess.

Japan Historical Forestry Preservation Measures

In the history of Japan forests have played a very important role for the development of this country. However, the excessive use of wood during the period of the industrial revolution without a certain degree of regulation devastated its forests. To deal with this challenge Japan established a first “Forest Act” in 1897, which goal was promote the conservation of national land and prevent the ruin of this ecosystem. Also, at the beginning of the twentieth century the demand for timber augmented considerably due to the war against Japan’s surrounding countries and so they had to create another Act. The 1907 Forest Act focused on the “use and control of the land and the establishment of forest owners’ cooperatives”. A third act was promulgated after World War II, therefore to restore all the land that was depleted after it. This Forest Act aimed to grow forests in a sustainable way and to increase their productivity.

Forestry Basic Act

At last and following the reconstruction of Japan after World War II and a new period of economic growth, there was an increase in the demand of wood. As a response, the Forestry Basic Act was promulgated in 1964 so the government can establish a plan “concerning the supply and demand of important forest products and publicize these”. This has evolved today and the name of the Act changed to the Basic Plan on Forests and Forestry, which include the following points:

  • Basic forest policy measures
  • Targets concerning the demonstration of the multifunctional roles of the forests and the supply and use of forest products
  • Measures to be addressed by the government comprehensively and systematically

Sumitomo Forestry and Sustainability

To have an idea of the measures that a company have to follow in the Forestry industry nowadays in Japan, the Sumitomo Forestry’s Company owns a very large amount of land dedicated to forests in the four largest islands in Japan, and serves as an example of this. This company separates into two categories the whole scenario:


Environmental Forests: here the main goal is preservation, not just of the forest but also of the surrounding ecosystems

Economic Forests: this category refers to the forests that focus in the production of timber or manufactured wood.

Techniques and Certification

Clearcutting:

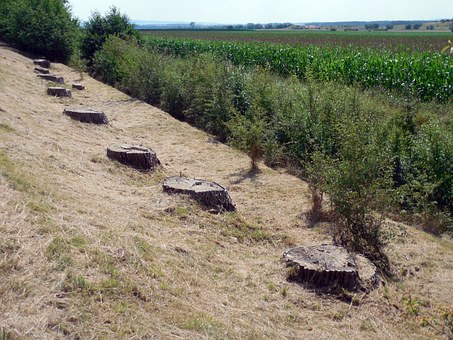
This technique consists basically on the harvest of all the trees in a respective area at the same time. All trees no matter the size are cut at the same time, because regardless of their size, they all have the same age. By doing this, the trees that doesn’t tolerate the shade generated by the canopy can be utilized, ensuring the rejuvenation and regeneration of the area in the future. In addition, this technique is not the only and best one, however it works very well with certain type of trees like jack pines, aspens and oaks.

Sustainable Green Ecosystem Council (SGEC) Certification

At last, this type of certification is private and it ensures that Sumitomo Forestry’s Company uses the adequate techniques and procedures in a regulated way to maintain sustainable forests. In addition, a third party certifies that the forests are well-managed, and implements the use of a seal in the wood products harvested in a proper way.


Introduction

Throught history Japan connection with aquatic ecosystems has been deeply established by its relationship with the ocean. First of all, Japan is an island surrounded by the Sea of Japan, the Northern Pacific Ocean, the Sea of Okhotsk, the East China Sea, and the Philippine Sea. Due to its geographical location, Japan has been interacting with all these bodies of waters for a long time, and its culture has also been shaped by them. For example, in the contemporary Japanese society fish products provide 40% of the animal protein supply. This fact is not surprising taking into account that there are two oceanic currents that promote an enormous diversity of marine resources around this island: “The 

cold nutrient-rich current Oyashio flowing south collides with the warm current Kuroshio flowing north off the eastern coast of Japan, which creates a high productivity ecosystem” (figure 1). In addition, 23% of the global fish production takes place in the Northern Pacific Ocean, which is included in the exclusive economic zone (EEZ) of Japan.

Top Consumed Species

-Bluefin Tuna

This type of tuna is largely consumed by Japan and it constitutes a mayor industry with a consumption of 40,700 tonnes in the year 2011, where 62% came from Japanese territory and the rest from several countries including Mexico.

-Eel

In terms of this species, Japan is the top consumer of it and responsible for 70% of the worldwide production. Also, aquaculture represents a big role by taking care of almost the total domestic production of it, which represents a little bit less than half of its consumption and the rest is imported from countries like China.

Imports and Exports

When it comes to the exportation of fishery products, 90% of the total japanese production is used for domestic consumtion and so they have a limited amount of exports. This phenomena was affected also by the 2008 crisis which affected its exports, plus the 2011 fukushima incident contributed to higher imports and less exports of fishery products. This earthquake provoked the destruction of a considerable fishing facilities and elements, costing around 1,263 trillion yen in damages. On the other hand, Japan is dependent on imports due to the high demand of its consumers, turning to be the third biggest importer in the world where 18% of the total amount comes from China.

Regulations and Aministrative Strategies

There are several strategies whether domestic or international, therefore to help maintaing aquatic ecosystems in the sustainable way as posible. For this purpose in 2001, the Basic Law on Fisheries Policy was stablished so Japan can keep an environvental and sustainable perspective on this issue. Also, there are more than 19k employees working in both institutions; The Ministry of Agriculture, Forestry and Fisheries of Japan (MAFF), and The Fisheries Agency.

Management Measures

This system is used to boost the input control by limiting the total fishing capacity. To do this, the strategy is to regulate the number of fishing vessels entering the EEZ and limit the fishing days.

The total allowable catch, is designed to help regulating the catches of the top 30 species, the species that are in the range of overexploitation, and the species caught by vessels that don’t correspond to Japan.

IUU is another global problem, as it damages the marine ecosystem and affects the species stock, plus it represents 19% of the total global catches valued in 10 billion Euros per year.

Therefore to counter the effects caused by IUU, Japan has creating a monitoring system that consists in 39 patrol boats and several aircrafts, to surveil the perimeter. Also, a Vessel Monitoring System (VMS) was implemented to control and monitor the vessels which operate in offshore and distant waters.


The Aichi Biodiversity Targets

Japan is one of the most populated countries in the world, in fact its population is about 126 million people, as well as one of the leading economies in the world, and it has a great influence on it. In addition, in the year 2010 the UN established a new protocol in Nagoya-Japan, regarding biodiversity called “Aichi Biodiversity Targets”. These targets are a series of goals and measures that have to be taken therefore to stop biodiversity loss in our planet. Also, it is expected to actually enhance the benefits that biodiversity can produce, or in other word “ecosystem services”, which are a series of elements produced by the ecosystem that we take advantage from and that are free like drinkable water, or breathable air.

Japan’s 2020 Olympics

Japan is going to hold once more one of the largest sport events, by hosting the Olympic and Paralympic games in the city of Tokyo in the year 2020. At the same time, these massive series of events have several environmental repercussions due to the amount of people that get involved in the process as a whole, plus the infrastructure designated for every single event. In fact, Japan has divided Tokyo into two zones in terms of urban areas; the heritage zone which includes several of the old venues from the Olympics of 1964, and the Tokyo bay zone which symbolizes the “metropolitan area´s future”. Everything that happens inside these boundaries during the 2020 games will define if Japan was able to achieve the level of sustainability that they are looking for.

Tokyo Sustainability Plan-Biodiversity

As the Olympic Games come closer, Tokyo has developed a sustainability plan to deal with several aspects that this event represent, including biodiversity. For 2020, they plan to deal with biodiversity, water and greenery issues. As a response, they Organizing Committee has come with three main points regarding environment and sustainability. The first point is to “set water, greenery and biodiversity-related targets”. The second element refers to “measures for mitigation and monitoring of impacts on the water environment (water quality and water resources), atmospheric environment, soil environment and the ecosystem, related to Games planning and operations”. At last, there are other “measures to mitigate the effect of the urban heat island phenomenon using water and greenery”.

Olympic Stadium

The National Olympic Stadium which was designed first by Zaha Hadid priced at $2.1 billion dollars and then replaced by Kengo Kuma’s model estimated to cost $1.5 billion dollars, is the perfect example of a venue that works to achieve all the previously sustainable goals mentioned. In fact, it is one of the biggest facilities built for this Games, capable of hosting 80,000 spectators.

The architect Kuma has established a clear statement about the use of its main material which is going to be timber instead of concrete, and wood will compose the structure and several other elements of the building.

Sustainable Materials Incorporated

Kengo Kuma has opted to use a series of different sustainable materials listed below, as well as strategies to incorporate to this project, and design an environmental friendly stadium.

Timber

  • This material is obtained after treating wood for several construction processes. Indeed, timber is a reusable material and produces low greenhouse gas emissions, and when it doesn’t have any use it can be composted or burnt as a fuel.
  • The wood that is going to be used for this project, will come from Japanese larch and cedar trees, which is going to decrease the CO2 emitted by transportation as well as lowering the energy to produce timber from these trees.
  • At last, “timber stores up to 15 times the amount of CO2 released during its manufacture”.

Green Spaces

At last, according to Tokyo’s Metropolitan Government, by the inclusion of trees and plants on the three main walkways that compose the exterior of the building, CO2 emissions in the inner city will be reduced to help mitigate the “heat island effect” and reduce climate warming.


Japan Tectonic Plates

A series of islands that together conform Japan, are the result of four tectonic plates that share this area. The North American, Pacific, Eurasian, and Philippine Sea plates intersect with each other all along Japan’s territory (Figure 1). The main island called Honshu, which is affected by the coalition of the North American and Eurasian plates. Meanwhile, in the Pacific Ocean the Nankai trough which starts in Miyasaki and ends in Shizouka, is the location where a future earthquake threatens to perform damage on Shikoku and Kyushu islands.

Nankai Trough

The Nankai trough located in the south east ocean of Japan is divided into three main sections, as Tokai, Tonankai, and Nankai (Figure 2). This trough has been hit by several earthquakes in the past and they have occurred after every 120 years approximately, plus it is a subduction zone capable of producing mega-thrust earthquakes.

In general, the records that we have about historical telluric movements in this trough, show that the three sections tend to coincide almost at the same time when one of them shake. However, the last record shows that the Tonankai section was hit by a (7.9 mag) earthquake on 1944, and two years later, the Nankai section followed with a (8.0 mag) earthquake, but the Tokai section was not ruptured by the last movements and it has been quite for 163 years (Figure 3)

Tokai Earthquake

As mentioned before, the Tokai section didn’t react concordantly with the other sections more than seventy years ago, and is has not been active in the last 162 years. According to the Geographical Survey Institute of Japan (GSI) that has been monitoring this area for the last 100 years, they conclude that “a steady strain accumulation has been happening in this region”, therefore the Tokai section is consider to have a potential Mw8 earthquake. In addition, due to the time gap or silence that this regular type of earthquake has, it could happen at any moment and is expected to occur when the subsidence stops, followed by an opposite upward movement.

Estimated Damage

The Shizuoka Prefecture in Japan which is an area that is going to be directly hit by the Tokai earthquake, has elaborated a document to register all possible damages and promote preparedness against this natural event.Also, is important to consider that Shizouka population according to the 1995 census was 3,737,360, and in 1998 this prefecture had 1,528,349 buildings.

  • Physical Damage (Buildings)

In terms of architectural structures, the document portrays four categories of possible damage including; serious, moderate, slight, and flooding above floor level damage. As a conclusion, it’s estimated that around 800,000 buildings will receive one of the different types of damage listed before.

  • Human damage

In this section, damage is distributed in three categories; death, severe injury, and moderate injury. According to the predictions, an average of 1,000 people will die, 2,700 will be severe injured, and 15,000 will suffer a moderate injury.

Earthquake Countermeasures

Therefore to protect lives and property, Japan has been investing in several projects like; communication facilities, tsunami prevention facilities, firefighting facilities, reconstruction of earthquake-resistant hospitals, schools and social welfare facilities, evacuation routes, and landslide countermeasures. The cost from 1979 to 2009 of these elements so far has been of 1,908 billion yen.

In addition to these measures, Japan Meteorological Agency has a guide to help predict the Tokai earthquake and contribute to lower the effects that this natural event will produce. This guide consists in three main different stages.

  • Red alert

When the prime ministers issues a warning declaration due to a high risk regarding the Tokai earthquake. Later on, a response is given towards this declaration by the Establishment of Headquarters for Earthquake Disaster Prevention.

  • Yellow alert

This second level alert happens when an observed phenomenon that could affect or promote the Tokai earthquake takes place. Then, there’s a response to the government and local-governments disaster management plans, followed by prevention measures.

  • Blue alert

The blue alert takes place when any anomalous phenomena are observed. The distinction here is that there is no action required, except for information gathering.

The Garibaldi at Squamish project is a proposed year-round destination mountain resort on Brohm Ridge, which includes 124 ski trails and 21 lifts, plus resort accommodation and commercial developments. In addition, the Resort Municipality of Whistler has opposed to this project due to environmental inconsistencies. My role in this project is to provide an environmental assessment to clarify the conditions of the resort with the use of maps and results. To do this, I extracted the land use data contained in the project boundary, and classify it for this analysis. Then I extracted specific required data to solve certain parameters of the project, including snow range, red-listed species, and other ecosystems, to determine which areas are interfering with the resort planning. At last, I was able to produce helpful percentages and visual representations regarding the environmental assessment for this project. After analyzing the results, the project area contains 52.62% occupied by old growth forest, ungulate habitat, red-listed ecosystems and fish habitats. Also, 29.91% of the total area is in a low snow location due to the elevation of the terrain.

In my opinion, the project is viable as long as it has a creative approximation to the area, so it doesn’t interfere with the surrounding ecosystems. The two major challenges are the fish habitat and the old growth forest, because any disturbance in the water can affect the rest of the ecosystem and the forest is a static entity. However, the forest can be incorporated into the project in architectonic terms, and the fish habitat should be preserved by having no human interaction, but still allowing the surrounding animal life to keep having habitual contact with it.

Finally, I believe that the project should be allowed if it respects all the criteria involved in the environmental assesment, by implementing all norms and regulations to protect the area. However, if the protected areas are going to be violated by any aspects regarding the construction and later activities of this resort, then the authorization should be denied by all means.

Housing affordability here is going to take into account the housing cost by household income, because every single city has a higher or lower income. This usually happens because larger cities have a higher income like Vancouver in this case compared to a smaller one like London. Moreover, to make data accurate and correspondent to this concept, we have to normalize the cost of housing by income for any city.

The housing affordability ratings are determined by the “Demographia International Housing Affordability Survey”. These ratings are divided into four categories and basically they define how affordable or unaffordable housing is in a specific area: affordable 3.0 & under, moderately unaffordable 3.1 to 4.0, seriously unaffordable 4.1 to 5.0 severely unaffordable 5.1 & over. However, the source where a map comes from has to be trustworthy, otherwise the data could be manipulated for personal interests.

At last, affordability is a good indicator of city’s livability because it takes into account the house cost by income, leading to an accurate indicator of how affordable a city could be or not independently of its geographical location, size, or economic situation.

There are many ways to classify and represent data in maps, and every single method will influence the interpretation of the data. These classification methods are useful when it comes to specific purposes; where a user needs to communicate certain information to a certain type of public.  Moreover, talking about ethical implications regarding these methods, there are many ways of representing a map for different circumstances, and as long as the data remains true to the source, then it should not be a problem the method used to classify it. Finally, in the image below there are four examples of different classification methods: Natural Breaks, Equal Interval, Manual Break and Standard Deviation.

These four maps about housing cost in Vancouver include data that is classified by four different methods, so the user can decide where is the best scenario to utilize them. For example, If I would be a journalist, I would choose the Standard Deviation map because that one shows the difference between the attribute value of an entity with the medium, and this would help to emphasize the values that are above or below the medium. If I would be a real estate agent, I would opt for the Manual Breaks map because it allows me to manipulate and emphasize data in the way that I want my clients to understand the information.


Spam prevention powered by Akismet