
There are many ways to classify and represent data in maps, and every single method will influence the interpretation of the data. These classification methods are useful when it comes to specific purposes; where a user needs to communicate certain information to a certain type of public. Moreover, talking about ethical implications regarding these methods, there are many ways of representing a map for different circumstances, and as long as the data remains true to the source, then it should not be a problem the method used to classify it. Finally, in the image below there are four examples of different classification methods: Natural Breaks, Equal Interval, Manual Break and Standard Deviation.
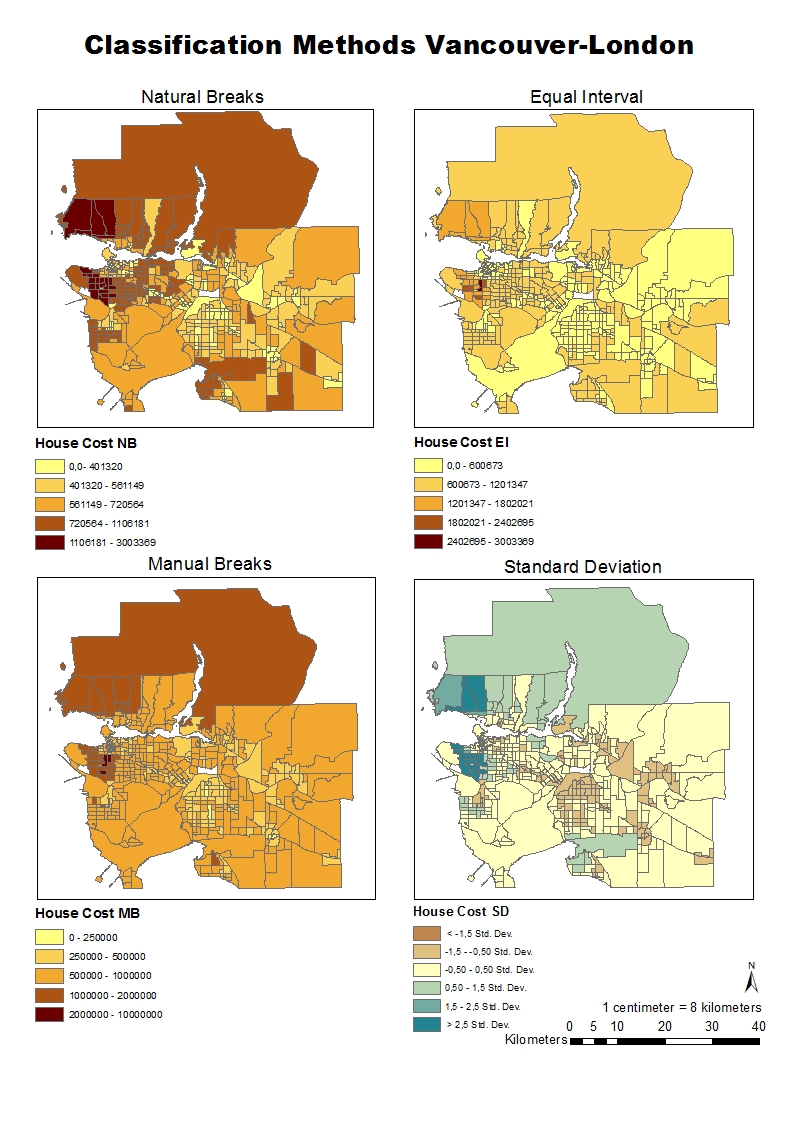
These four maps about housing cost in Vancouver include data that is classified by four different methods, so the user can decide where is the best scenario to utilize them. For example, If I would be a journalist, I would choose the Standard Deviation map because that one shows the difference between the attribute value of an entity with the medium, and this would help to emphasize the values that are above or below the medium. If I would be a real estate agent, I would opt for the Manual Breaks map because it allows me to manipulate and emphasize data in the way that I want my clients to understand the information.