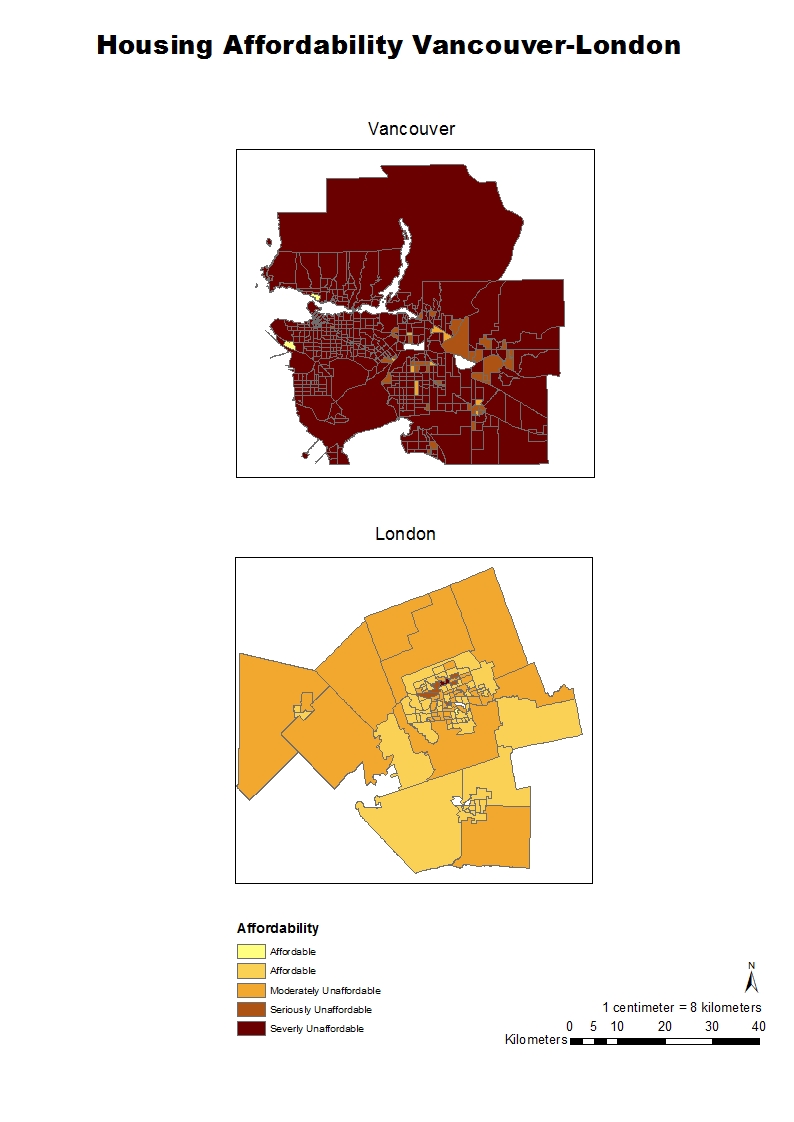
Housing affordability here is going to take into account the housing cost by household income, because every single city has a higher or lower income. This usually happens because larger cities have a higher income like Vancouver in this case compared to a smaller one like London. Moreover, to make data accurate and correspondent to this concept, we have to normalize the cost of housing by income for any city.
The housing affordability ratings are determined by the “Demographia International Housing Affordability Survey”. These ratings are divided into four categories and basically they define how affordable or unaffordable housing is in a specific area: affordable 3.0 & under, moderately unaffordable 3.1 to 4.0, seriously unaffordable 4.1 to 5.0 severely unaffordable 5.1 & over. However, the source where a map comes from has to be trustworthy, otherwise the data could be manipulated for personal interests.
At last, affordability is a good indicator of city’s livability because it takes into account the house cost by income, leading to an accurate indicator of how affordable a city could be or not independently of its geographical location, size, or economic situation.

