Multi-criteria decision analysis is a useful conceptual framework for making decisions by evaluating multiple and often conflicting criteria. Using a multi-criteria evaluation (MCE) method in a GIS environment can accommodate large amounts of information and provide a structured, traceable, and flexible analysis. This makes a MCE an effective spatial decision support tool in a multi-stakeholder environment. Planners, politicians, the public, and other stakeholders can use models to determine ideal solutions to regional, city, neighbourhood, and community problems. Five steps are involved:
- Determine criteria (factors and constraints) to be included
- Normalize criteria standardized scores
- Determine weights for each criteria
- Evaluate using MCE algorithms
- Conduct a sensitivity analysis to assess confidence of results
ESRI ArcGIS 10 was used to conduct the analysis using six criteria. Four criteria were selected from the 2006 census at the dissemination area-level: population aged 15 to 24, household income less than $40,000, recent immigrants from 1996 to 2006, and low density housing. The fifth criterion was derived from Frank et al.’s walkability index, while the final criterion was derived from Winters et al.’s bikeability index. These criteria were selected to capture the social and physical dimensions of an ideal TOD.
Certain segments of the population have a higher propensity to adopt sustainable transportation modes. The 15 to 24 age group represents the most likely group to travel using sustainable modes. In Canada, 35.1% of this group across all major census metropolitan areas walk, cycle or use transit to get to work. In Vancouver, they represent 36.7% (Statistics Canada, 2006). Similarly, recent immigrants are more likely to use public transit, even after controlling for demographic characteristics, income, commute distance, and residential distance from the city centre (Heisz and Schellenberg, 2004; Kim, 2009).
In the reality of peak oil, volatile gas prices, rising cost of living, and an unaffordable housing market in Vancouver (Cox & Pavletich, 2011), automobile ownership may become more difficult to maintain in the future as households become financially stressed. While TOD can be expensive to develop and generates a high demand and real estate value, it is necessary to ensure future developments in Vancouver are equitable and within reach of lower income households. As such, households that have an income of less than $40,000, an approximate threshold for Vancouver’s living wage of $18/hour, were chosen (CBC News, 2010).
Pertaining to physical dimensions of TOD, single-detached family dwellings are characteristic of undesirable land use patterns due to the fact that they are typically low density and unable to support a cost-effective transit ridership rate. As classified by Statistics Canada, the presence of high proportions of seven housing types indicate high potential for TOD intensification:
- Single-detached,
- Semi-detached,
- Row house,
- Apartment – duplex,
- Apartment – fewer than five storeys (includes single-detached homes with secondary suites),
- Other single-attached, and
- Movable dwellings.
Statistics Canada’s eight housing type, apartment – five or more storeys, was excluded as it satisfied the requirements of an ideal TOD for this study.
Lastly, because TOD is intended to promote walking, biking, and transit, it is important to ensure that these types of transformation will increase the walkability and bikeability of communities along transit corridors. Frank et al. (2011)’s walkability index was modified for the study. It considers three factors (Frank et al., 2007):
- Net Residential Density (dwelling units/acre);
- Net Commercial Density (retail floor area ratio);
- Land Use Mix (0-1, where a higher value indicates a more even distribution by square footage of land between land use types).
Winters et al. (submitted)’s bikeability index considers five factors:
- Bike Route Density (metres of bike route);
- Bike Route Separation (no separated path; separated path);
- Connectivity (# intersections of local streets and bike paths);
- Topography (% grade: rise/run);
- Destination Density (# parcels of commercial, education, office, entertainment land use).
High proportions of youth, recent immigrants, and lower income households, and low proportions of low density housing are imagined to be found in an ideal TOD. Therefore, areas that presently have a higher proportion of these criteria indicate higher potential for TOD intensification. Each criteria layer was converted to raster in the GIS and normalized by total population (total occupied dwellings in the case of housing) of the DA. The layers were reclassified to a scale from one to 10, where one had the least potential for TOD intensification and 10 had the most potential.
Given the variables captured in the walkability index are highly correlated with one another, a standard score was calculated and summed. Interpolation by kriging was done to generate an appropriate raster. Both walkability and bikeability were reclassified from one to ten, so a high score of 10 indicated presently low walkability/bikeability levels, and thus the most potential for TOD intensification, and vice versa. All raster criteria layers were at 10 m resolution.
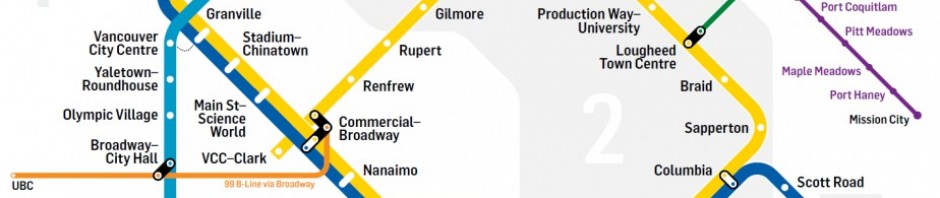
Three buffers were generated at 400, 600, and 800 metres (equivalent to a five to 10 minute walking radius) around the SkyTrain station to represent the catchment area and potential TOD land. Weights were then generated (see Table 2) and assigned for a total of 100% using the analytical hierarchy process (Saaty, 2008), a structured technique using pairwise comparison. A consistency ratio of 0.08 was achieved, indicating the weighting was logically consistent relative to each criteria.
| Criteria | Weight |
|
Walkability Bikeability Population aged 15 to 24 Household income less than $40,000 Recent immigrants from 1996 to 2006 Low density housing |
47.21% 17.7% 11.76% 9.81% 9.81% 3.71% |
In reality, this is the most arbitrary stage of an MCE and the most controversial; this is only one possible weighting scheme. The more criteria included, the more complex the weighting scheme becomes. When MCE is implemented in a public setting for policy and design decisions, input from all stakeholders is crucial.
Lastly, using the Weighted Sum tool in ArcGIS, all the layers were overlaid on top of each other, multiplied by their given weight, and summed together using the following expression:
TODx = [17.7 * (Wx)] + [3.71 * (Bx)] + [11.76 * (A15_24x)] + [9.81 * (LIx)] + [9.81 * (RIx)] + [47.21 * (LDHx)]
Where TODx is the potential for TOD intensification, Wx is Walkability, Bx is Bikeability, A15_24x is Population Aged 15 to 24, LIx is Household Income less than $40,000, RIx is Recent Immigrants from 1996 to 2006, and LDHx is Low Density Housing.
One constraint specified for the MCE was that results had to fall within the maximum 800 m buffer. Therefore, results that were outside of the SkyTrain catchment areas were removed. A sensitivity test was conducted using an equal weighting scheme at about 16.6% to explore how a different set of weights would affect the results.