Last time I spent nearly a whole day on connecting and adjusting band dandrometer sensors. On our way back, Adam suggested me to put aside the problem of band dendrometer, and measure photosynthesis and stomatal conductance instead, because data from band dandrometer are not as important as those of photosynthesis and stomatal conductance, since I can use tree monthly DBH as tree growth indicator. I strongly agreed with it, and guaranteed to him that I would give photosynthesis and stomatal conductance priority in my next field, no matter band dandrometer sensors work normally or not.
Unfortunately, the band dandrometer sensors still performed badly at this time. But I gave up fixing it, and turned to measure photosynthesis and stomatal conductance by LICOR 6400 XT, with the help of Dr. Wu. (Only Dr. Wu and I went to the field.)
We set off from Kelowna around 8:30 am, and arrived at the site at around 10:30 am. It was a sunny day.
Fig. 1 Photo of B1C at June, 26, 2017
Fig. 2 Photo of B1T1 at June, 26, 2017
Fig. 3 Photo of B1T2 at June, 26, 2017
We carried equipment to the plot T1 at the Block 1. Dr. Wu was interested in learning this photosynthesis system, so I introduced the mechanism to him, while we assembled the machine. After waiting for around 10 minutes to stabilize the machine, we started to measure selected conifer clusters. The time was around 11:00 am.
In my experiment design, I randomly select five trees per plot, and four directions (north, south, west and east) per tree at the 1.5-1.7 m height. Choosing five trees in each plot is due to the limitation of battery. I only have four batteries which can sustain field measurement up to 5 hours in total. Each clusters may take about 5 minutes, so finishing one block (3 plots) may require 300 minutes, which is equally to the sustainable time of four batteries. Assuming that there will be different solar radiation intensities and temperatures which affect photosynthesis rate and stomatal conductance in different positions, I measure the north, south, west and east sides of the tree branch clusters at the same height, to test this hypothesis. I will average the photosynthesis rate and stomatal conductance from four sides for the future analysis of scalling relationship at the leaf and individual tree level. There are less healthy branches of lodgepole pine that are lower than 1m, and I cannot measure branches that are too high for me since I have to hold heavy connifer chamber all the time, so I choose the healthy branches at the height of 1.5-1.7m.
My goal was to measure instantaneous photosynthesis rate and stomatal conductance. So I tried to set the leaf chamber environment the same with as the real outside condition. Here are the settings I used in my measurement:
(1) block temperature as 20 ℃ (It is the same with outside temperature which can be read from the machine).

(2) Set light intensity as track the ambient light.

(3) Set the block CO2 as 400 umol/mol.

(4) Set the flow rate as 500 umol/s.

(5) Control the humidity at around 30-60%.
At first I used compressed gas cylinders as CO2 supply, but then we found a severe leaking problem in the first four measurements by observing that the photosynthesis rates were negative, and the CO2 concentration at the chamber was really low (around 20 umol/mol). Then, I checked the equipment, and found that the O-ring which was supposed to stick at the conjunction between CO2 Cylinders and console was disappeared. As I did not bring any other O-ring, I decided to use air as CO2 supply. in fact, the ambient CO2 was not considered a good supply, because it was easily affected by breath. However, I found that it was acceptable in my experiments, as readouts were quite stable. So we re-measured the clusters with the wrong photosynthesis readings.
Dr. Wu and I took turns to hold the connifer chamber, because it was heavy. We measured clusters while chatted. Time flied fast. At around 1:30, we finished two plot (T1 and T2). We then had a lunch break, and continued to measure the Control plot. At around 3:00 pm, we finished the whole block (Block 1).
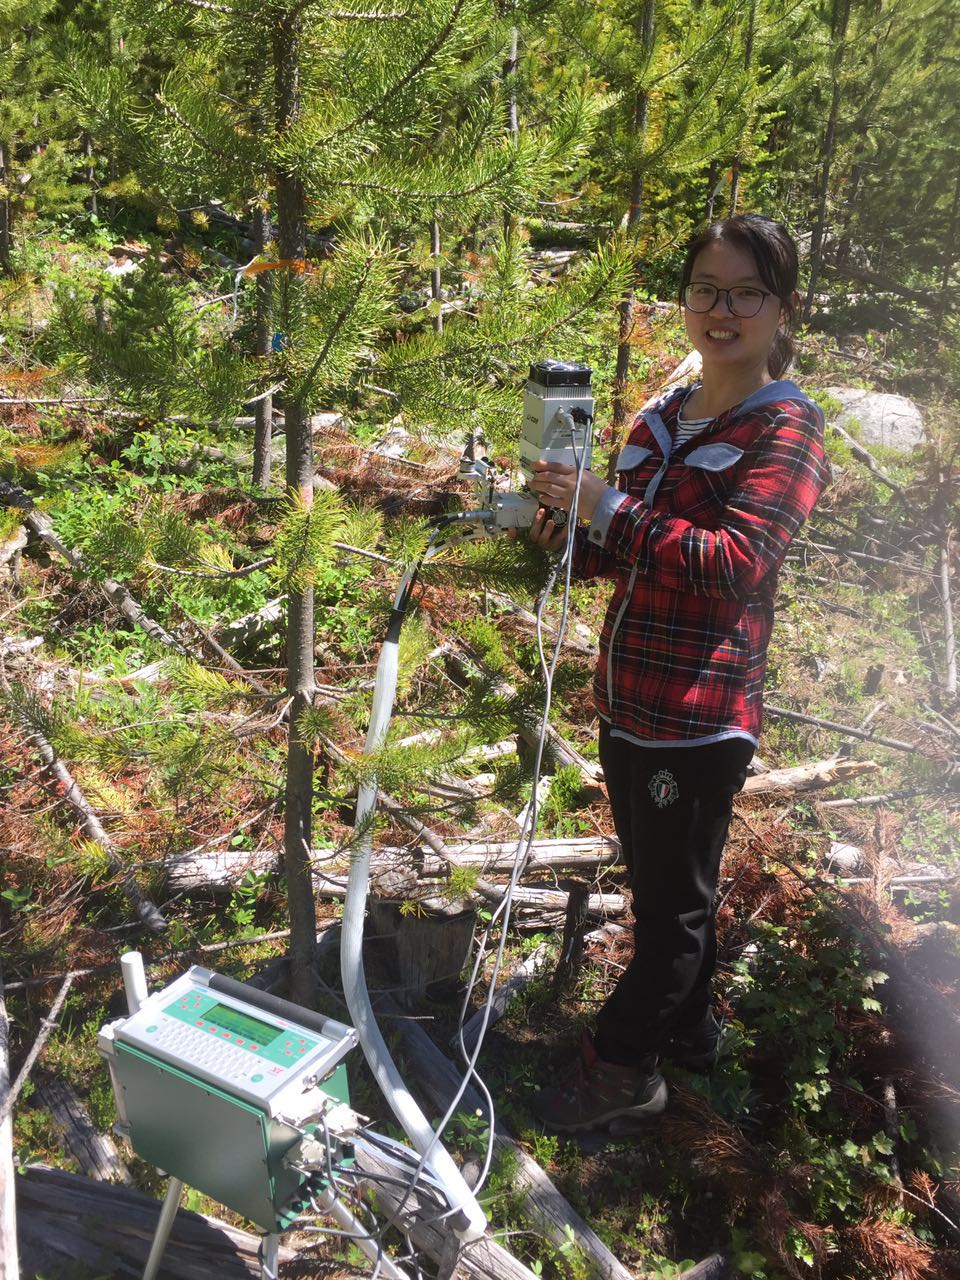
Fig. 4 Dr. Wu and I took turns to hold the conifer chamber.
Then, I checked the condition of band dandrometers. Sadly, I found that band dandrometers of tree No. 5, 7, 9, 13, 14, 15 were all out of position. So I adjusted them.
I download the data of sap flow, soil moisture, band dandrometer, evnironmental variables from XM 1000 datalogger and Hobo climate stations. I did not checked them at the field. At around 3:40 pm, we returned home.
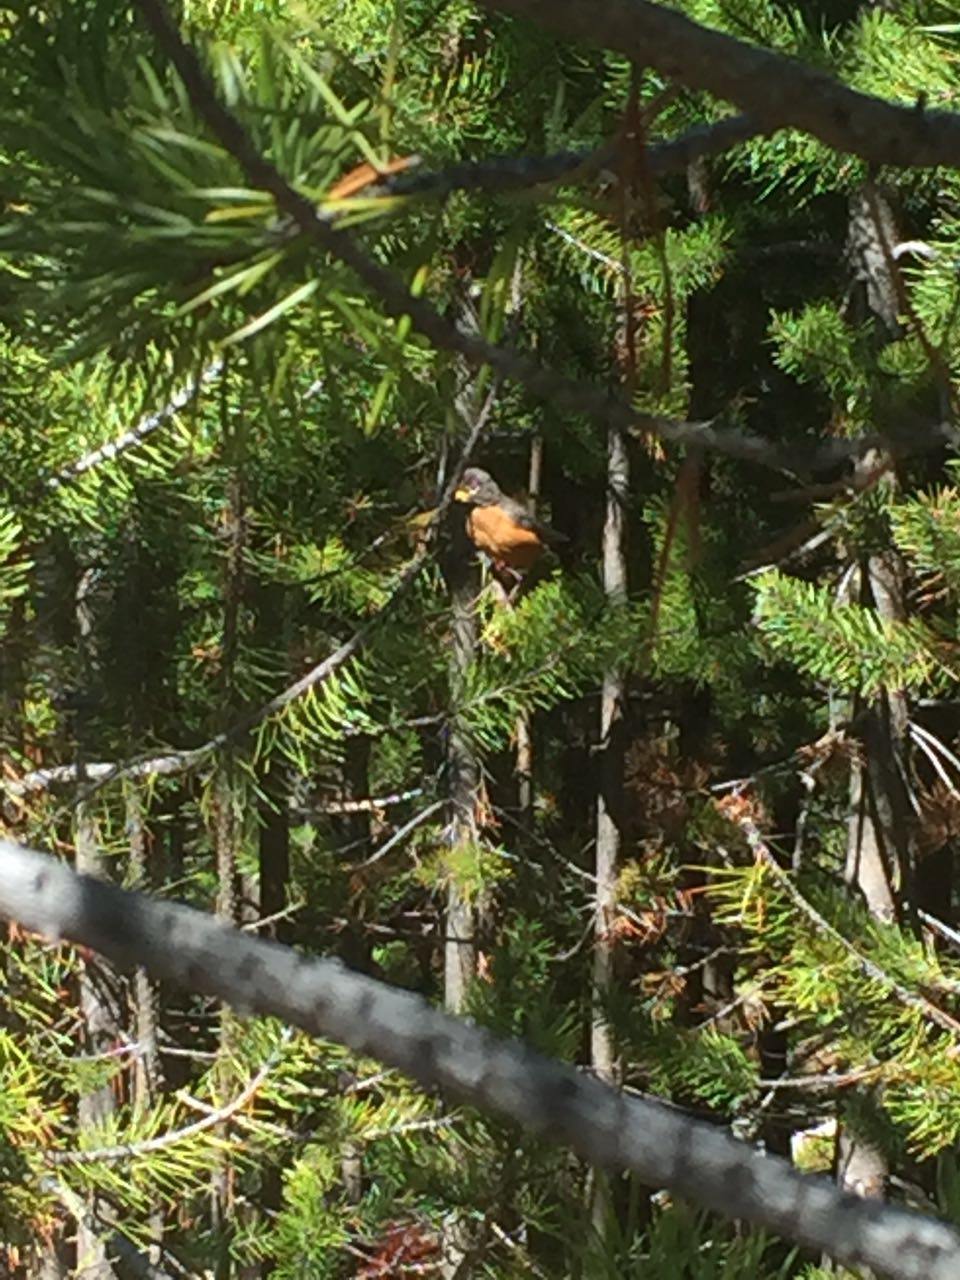
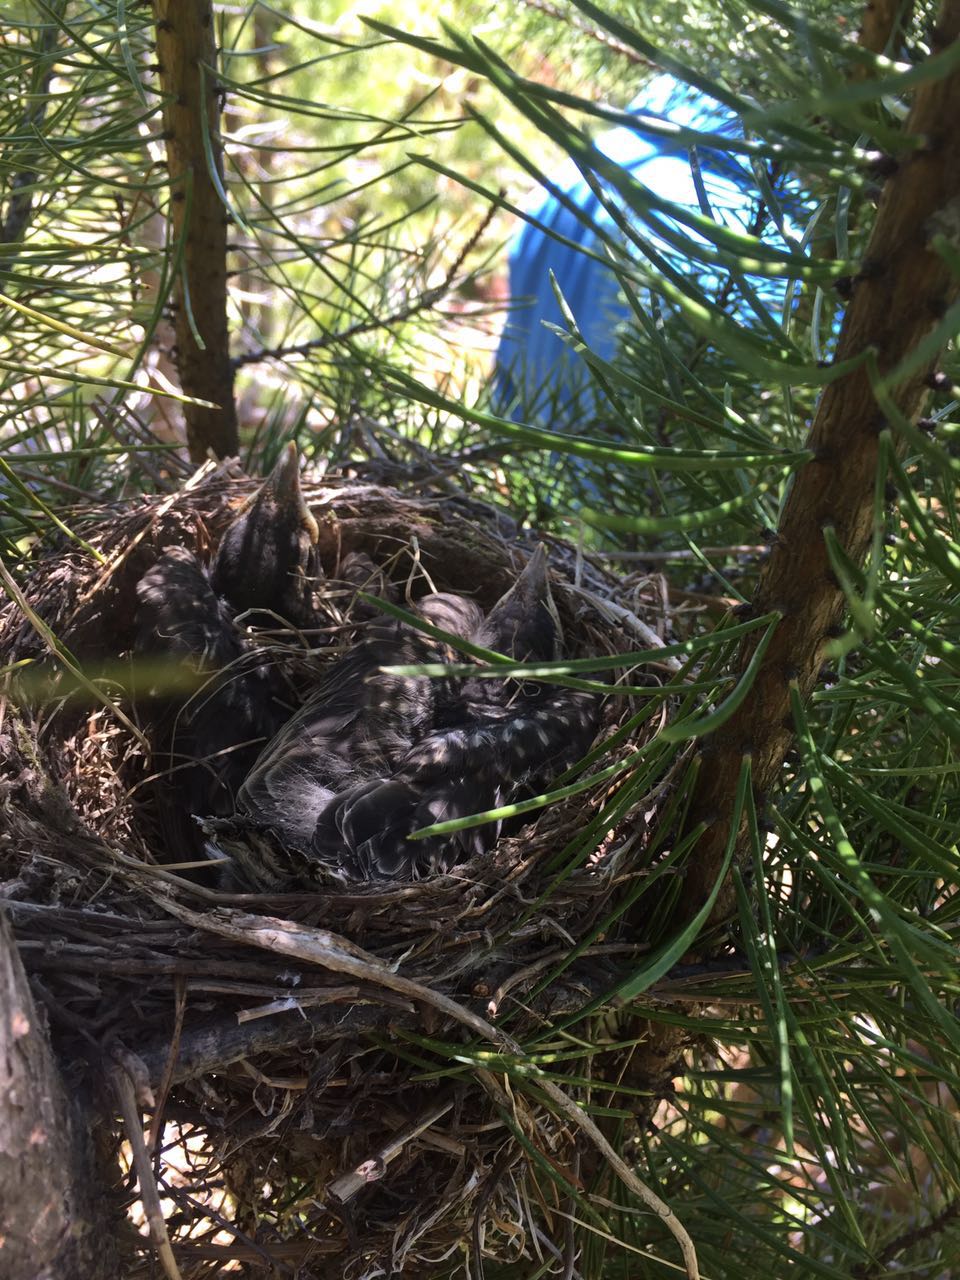
Extra bonus: The nesting feathered out! Did you know who they are? the answer is American Robin! I even took the picture of the parent birds.
Find it useful, thanks for sharing.
https://www.totositerank.com
It is a great website.. The Design looks very good.. https://www.sportstotoking.com
This is a really good https://www.betsarang.com
That’s a great article! https://www.totorank.net
Thank’s you for any other informative blog.
https://www.badugisite.net/
Though It is not relevant to me but it is quite informative and many of my connections relate to it. I know how it works. 메이저사이트
Looking to business setup in sharjah mainland ? Our expert consultants offer top-notch services for business setup consultants in Dubai, licensing, visas and more.