This week, I used multiple ArcGIS tools to gather statistics for various layers in my map package and compile the data into an excel table. I also joined these statistics to the attribute table of the Geologic Units Layer in my map package, which was adapted from U.S. Geological Survey SIM Maps by Kuntz et. al. (2015), and Kuntz et. al. (2007) as well as an Idaho Geological Survey Geologic Map by Skipp and Kuntz (2009) by Stephanie O’Meara and Derek Witt (Colorado State University). More information on this map can be accessed here.
In ArcMAP, the first tool I used was the Zonal Statistics as Table tool. The Zonal Statistics as Table tool calculates statistics on values of a raster data set that are defined by ‘zones’ of another data set and then outputs them as a table that can then be joined to various map layers or exported as an excel table for further analysis. The types of statistics that can be calculated by the Zonal Statistics Tool are: mean, majority, maximum, median, minimum, minority, range, standard deviation, sum and variety. I used the Zonal Statistics as Table tool to calculate the statistics for five different radar data sets as well as emissivity, apparent thermal inertia, albedo and elevation data. I then created smaller tables containing just the mean and standard deviation values from each of the layers. In order to explain this more clearly and with images, I have used the emissivity map layer, which was created using ASTER data, as an example.
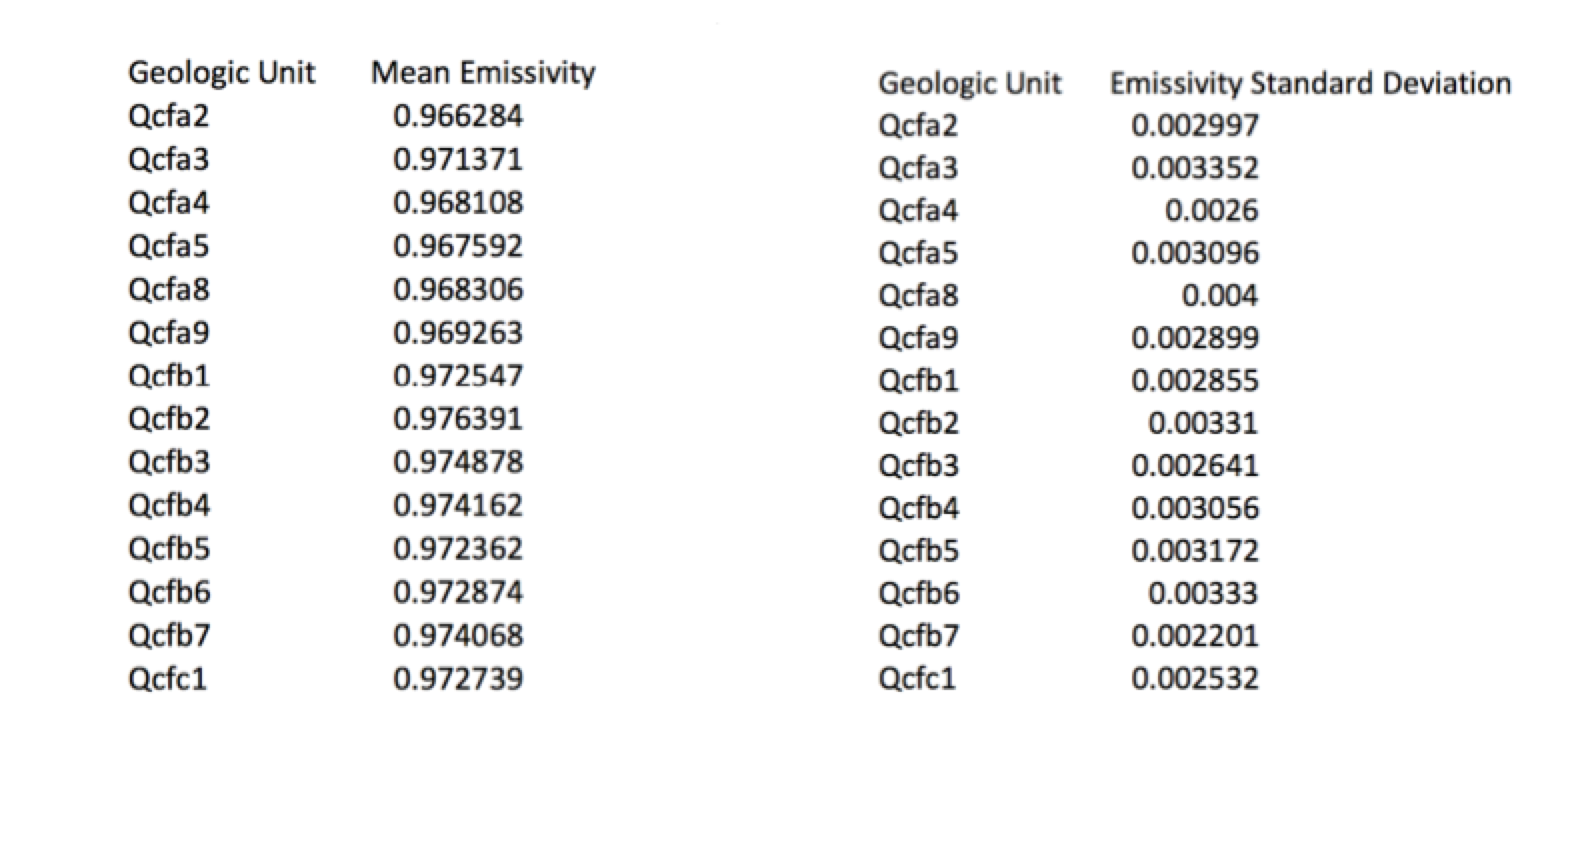
By using the Zonal Statistics as Table tool twice to first calculate the Mean and then the Standard deviation, I was able to export the data into separate tables, sections of the excel tables I created are below. The ‘zones’ I used were the different geologic units located within my study area.
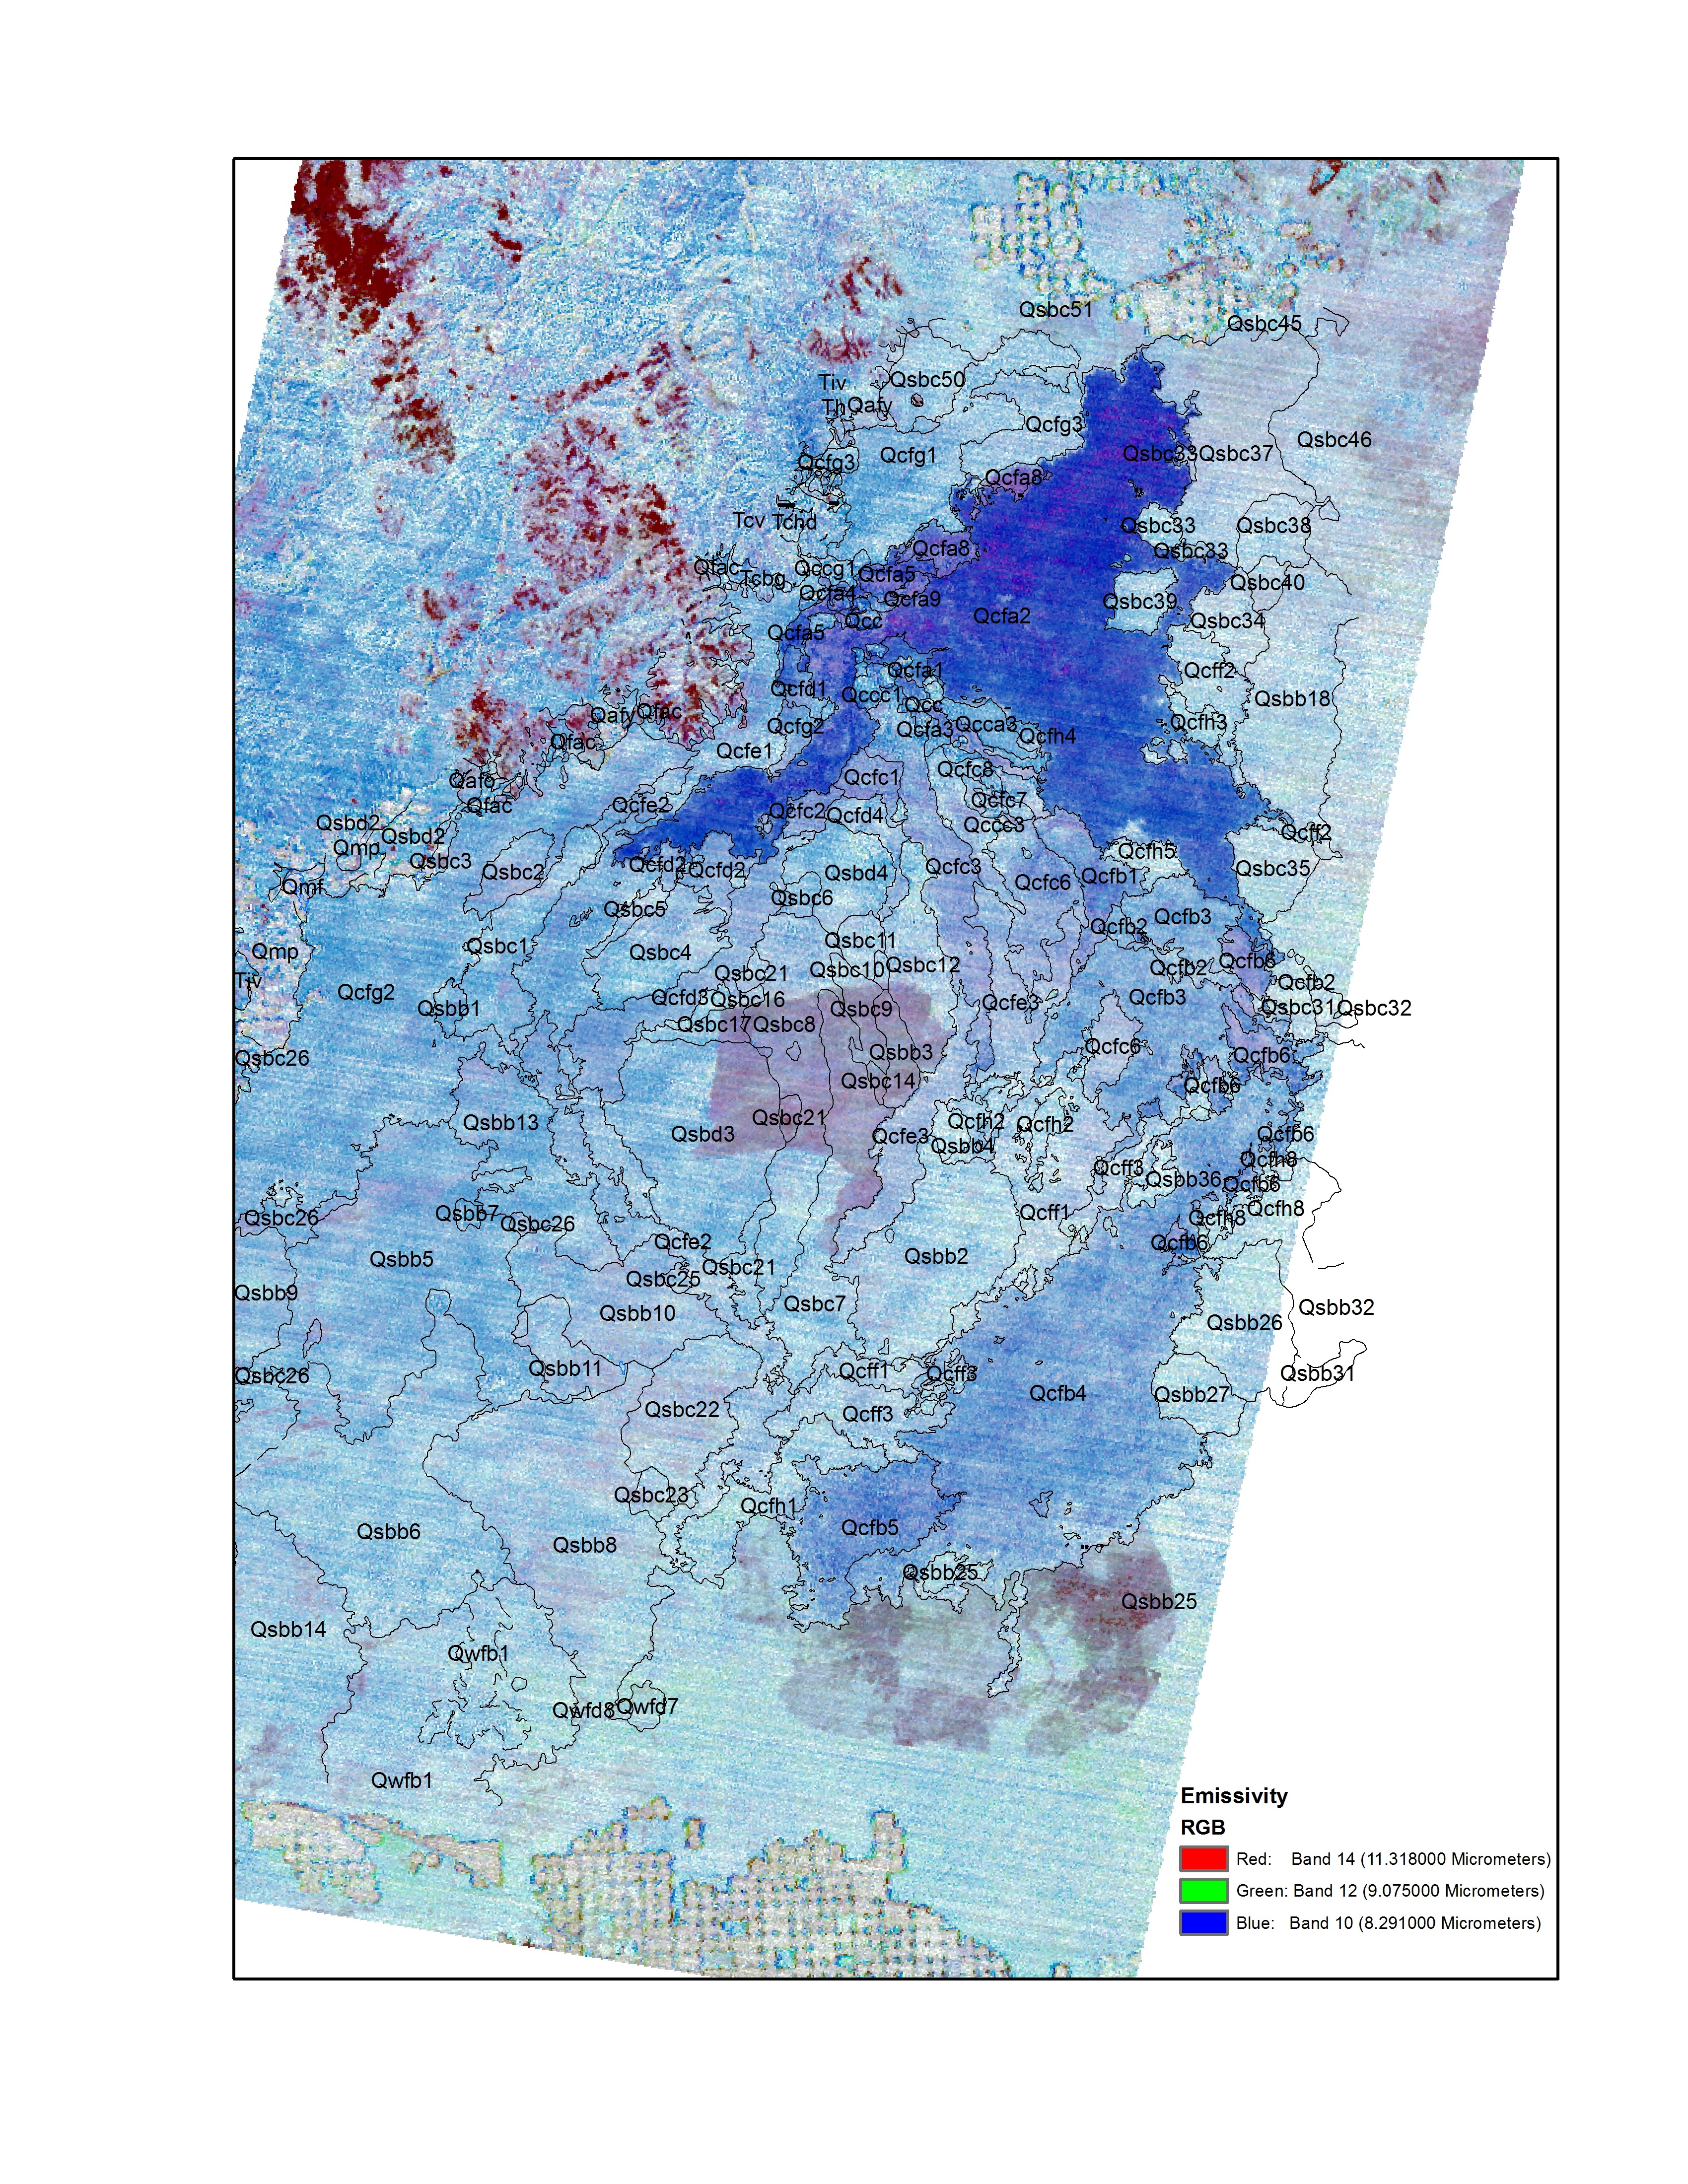
After I obtained this data, I connected it to the geologic map attribute table. Ensuring the mean and standard deviation values for the map layers listed in the second paragraph of this post are part of the attribute table of the geologic units layer of my map package will allow for further analysis and comparison of the various lava flows in our study area. A map of the geologic units overlaying the emissivity map is below:
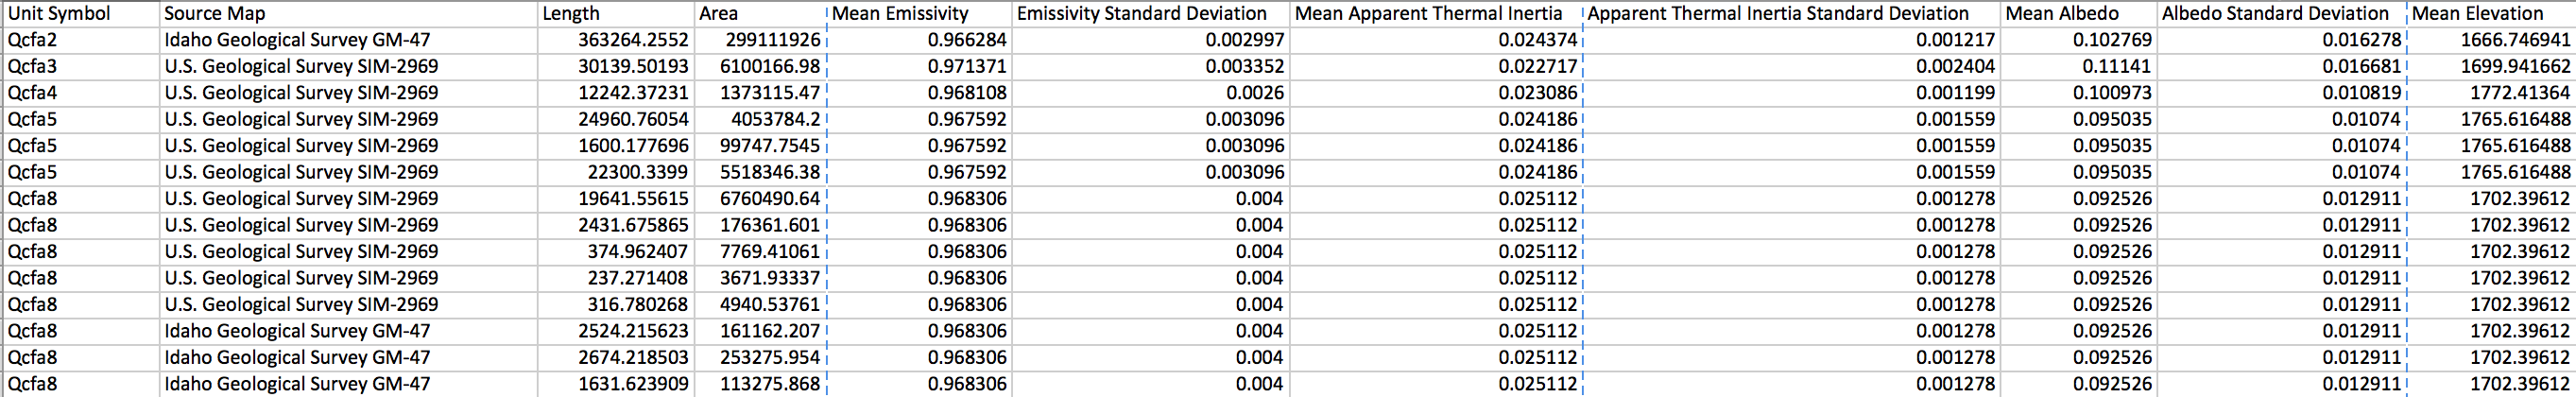
In order to join the mean and standard deviation emissivity data with the attribute table for the geologic units, I used the Add Join tool in ArcMAP. The Add Join tool connects data from a map layer to another layer or a table through a common attribute. A common attribute is generally an ‘ID’ field, it is used by the Add Join tool as a column of values from both disconnected tables that is exactly the same. Joining based on a common attribute ensures that data from one table that is being added to an existing attribute table is assigned to the same unit for direct comparison. In this example, I joined data from the tables I obtained through the Zonal Statistics Tool to the Geologic Units map layer using the common attribute contained in both tables of ‘Geologic Symbol’ (‘Unit Symbol’ in the table below). These values are the map symbol corresponding to the Geologic Unit that the polygon outlined. After I repeated this process with all the different map layers, I was left with a table containing attributes from the original layer as well as all of the added attributes, a sample screenshot from this table once it was exported to excel is below:
Using this table, I can easily compare the properties of the various geologic units. For example, if I wanted to know more about the very large dark blue unit from the emissivity map above, Qcfa2 (which the legend says consists of Blue Dragon pahoehoe and a’a basalt-hawaiite flows from the Holocene), I could refer to the table and see that it has a mean emissivity value of 0.966284, a mean albedo of 0.102769 and a mean apparent thermal inertia of 0.024374, as well as other information contained in the radar data.
Geologic Map Source: National Park Service (NPS) Geologic Resources Inventory (GRI) program, 20150804, Unpublished Digital Geologic Map of Craters of the Moon National Monument and Preserve, Idaho (NPS, GRD, GRI, CRMO, CRMO digital map) adapted from U.S. Geological Survey SIM Maps by Kuntz et. al. (2015), and Kuntz et. al. (2007), and a Idaho Geological Survey Geologic Map by Skipp and Kuntz (2009).
Elise
June 17, 2016 — 7:32 am
Zonal Statistics as Table is one of my favourite tools in ArcMAP.