Day and night ASTER data scenes from Craters of the Moon National Monument collected in June 2006 were used by Dr. Livio Tornabene to make an apparent thermal inertia (ATI) image using ENVI of a section containing many major lava flows. Apparent thermal inertia is the change in thermal emittance between day and night thermal images and is calculated using the formula ATI = (1-Albedo)/ΔT. Materials with high thermal inertia values do not experience drastic temperature changes, whereas materials with low thermal inertia values change notably from day to night. The ASTER data that was used to create this image includes: Surface Reflectance – Visible and Near Infrared & Short-wave Infrared, Surface Radiance Thermal Infrared and Surface Kinetic Temperature. The resulting image is below:
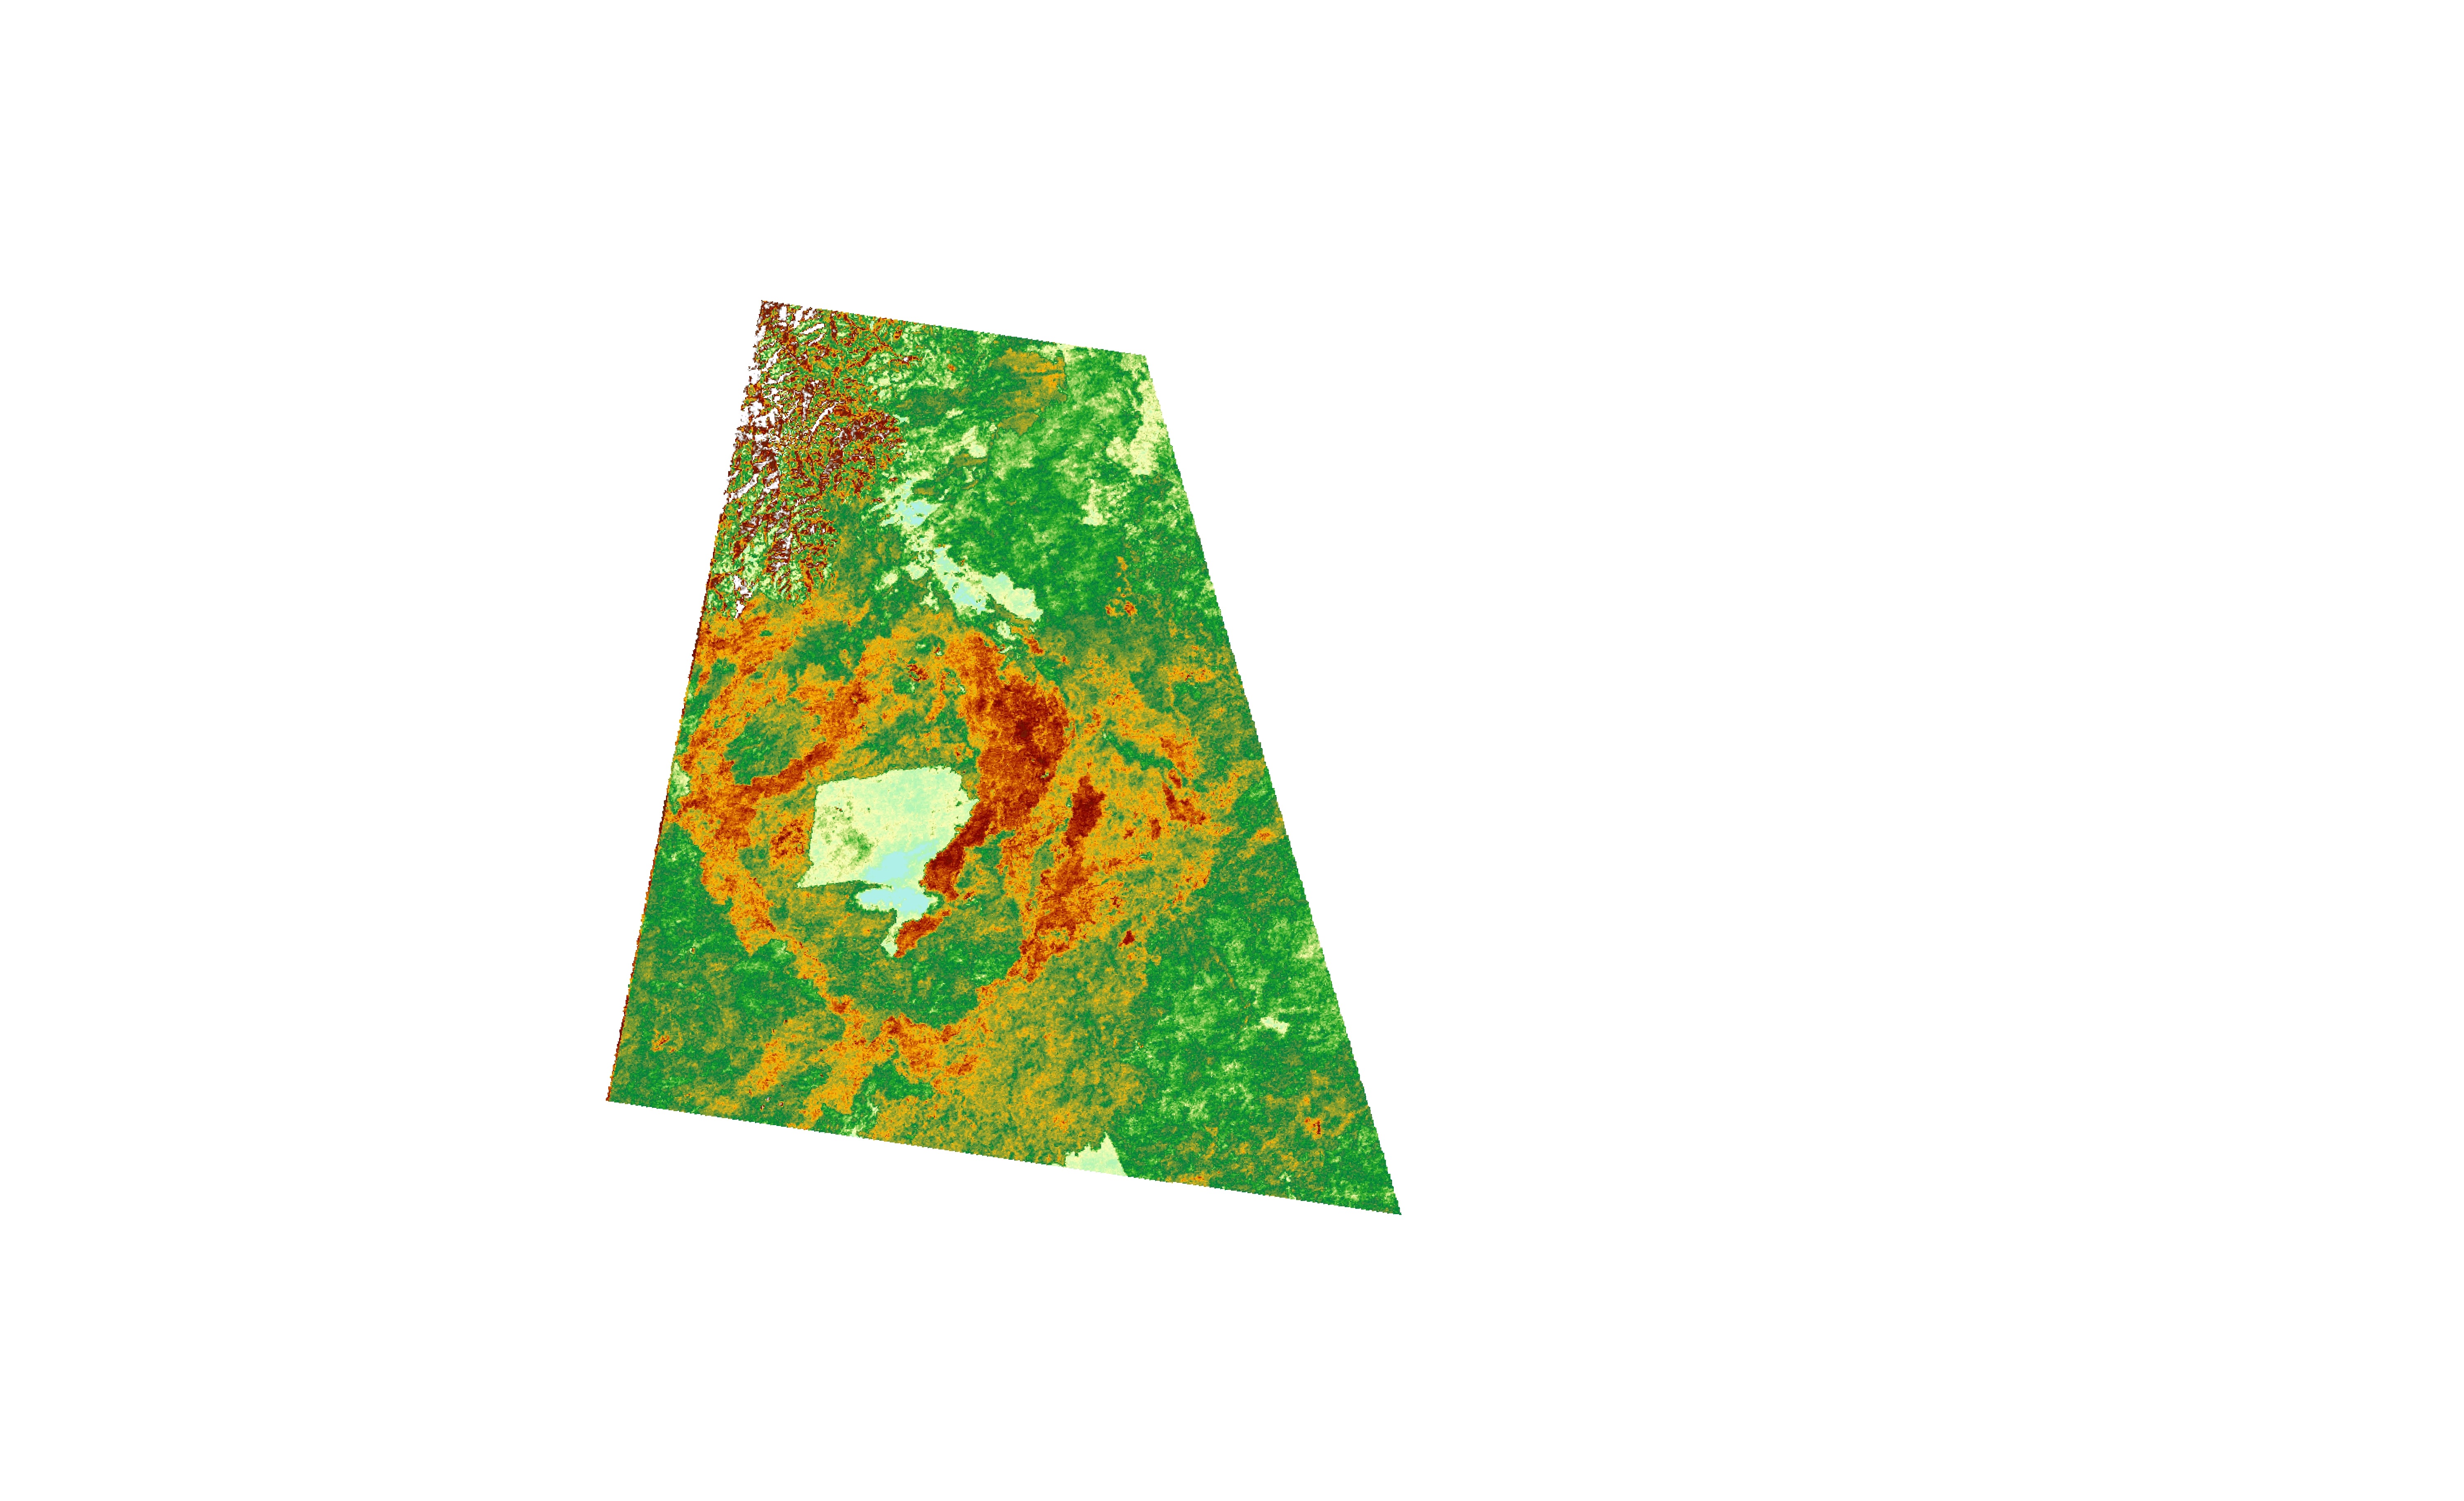
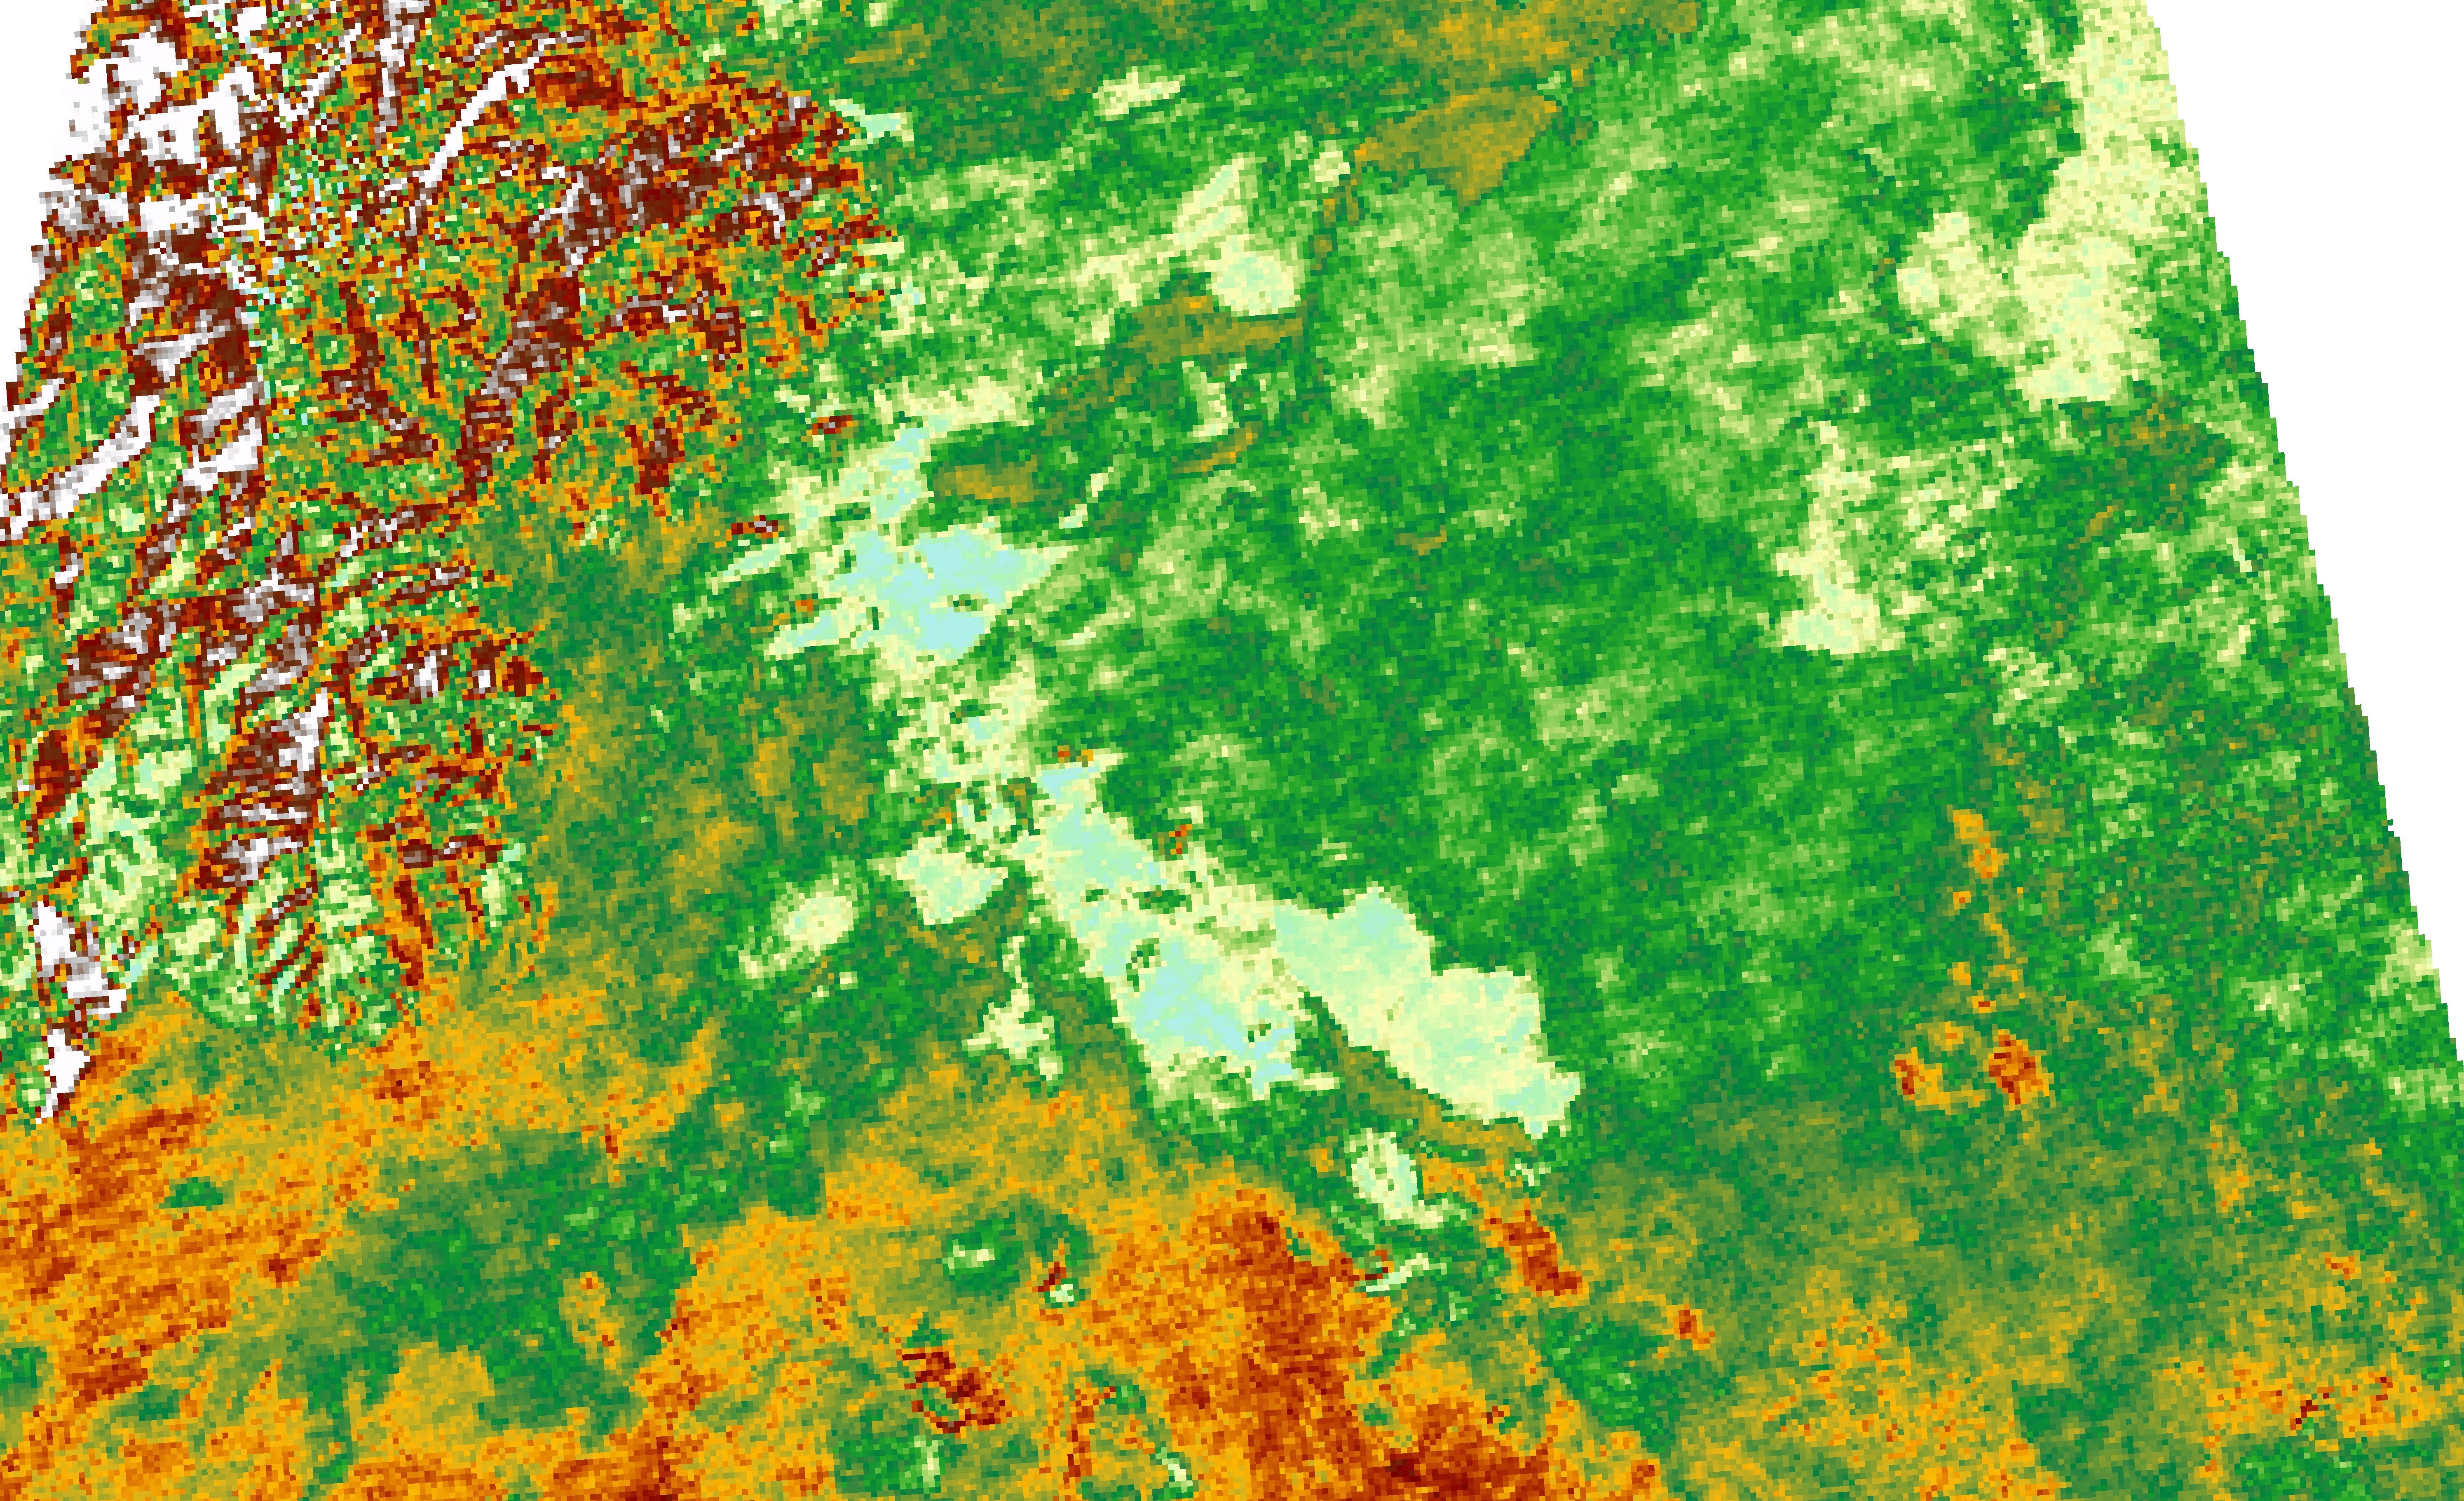
In this image, the areas with high apparent thermal inertia appear red and those with low apparent thermal inertia are blue. There is a cloud in the large blue area in the middle of the flows but in the blue areas on the top of the image there are no clouds, meaning this area experiences large temperature changes. Zooming in on this area produces this image:
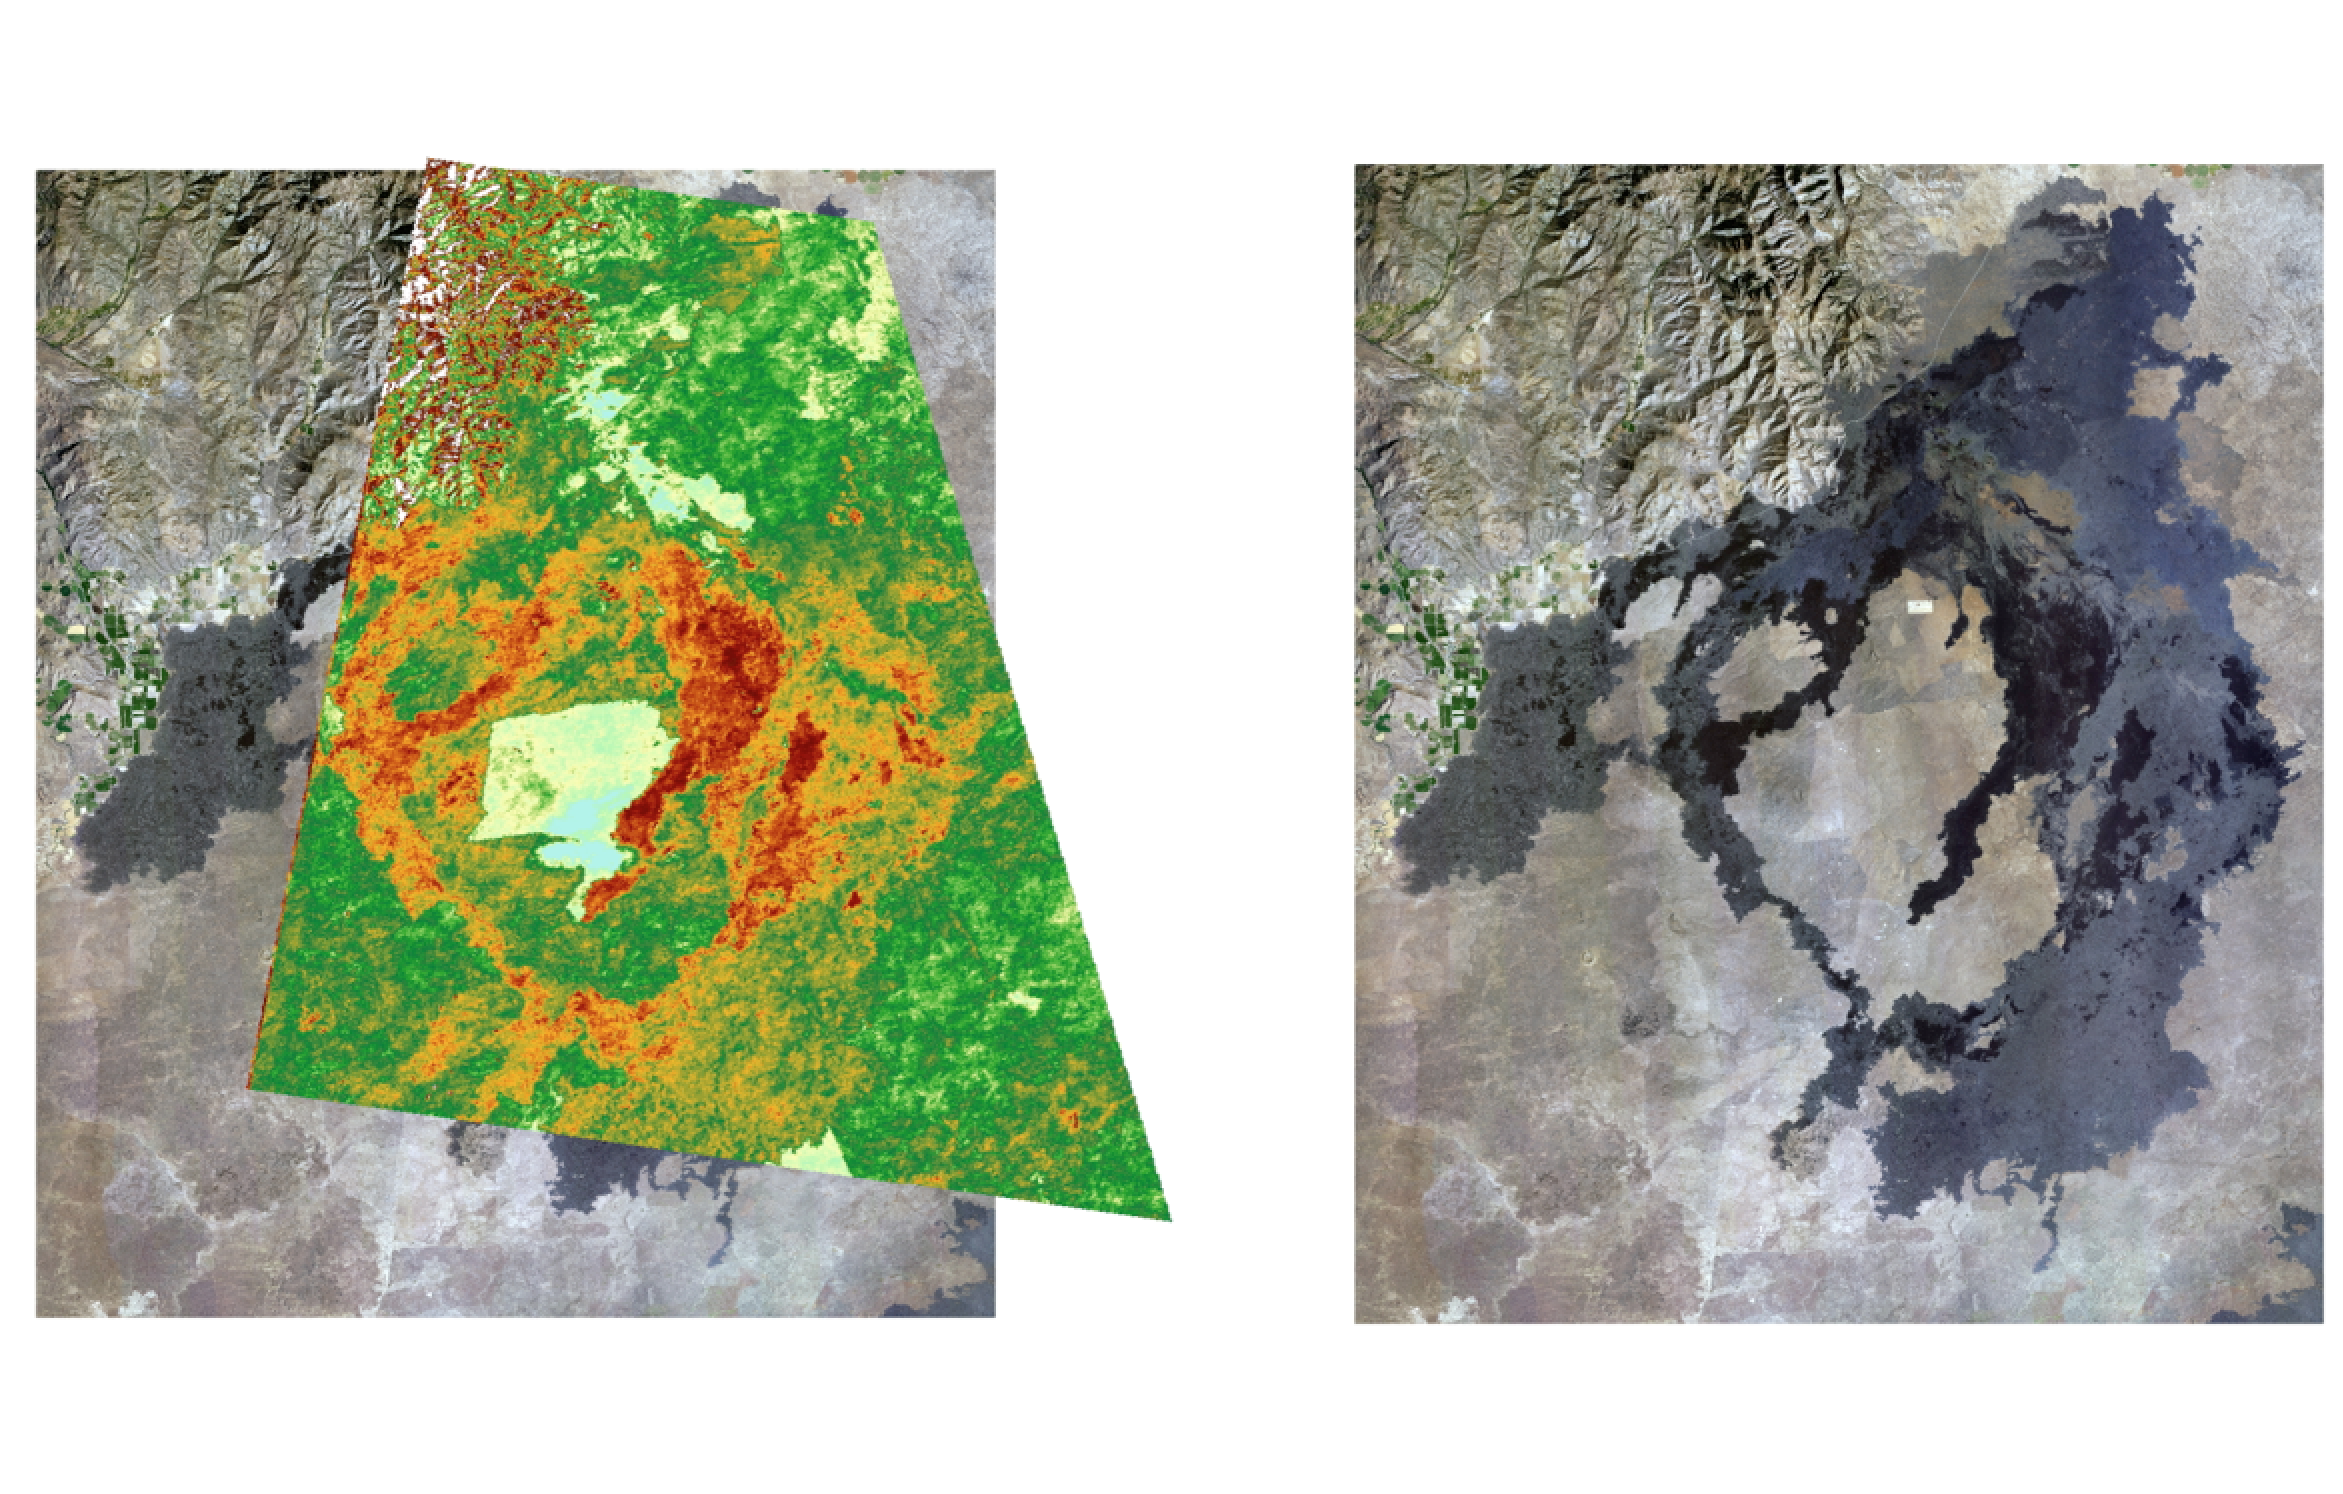
This area can then be compared to the image from National Agriculture Imagery Program (NAIP) data from 2015:
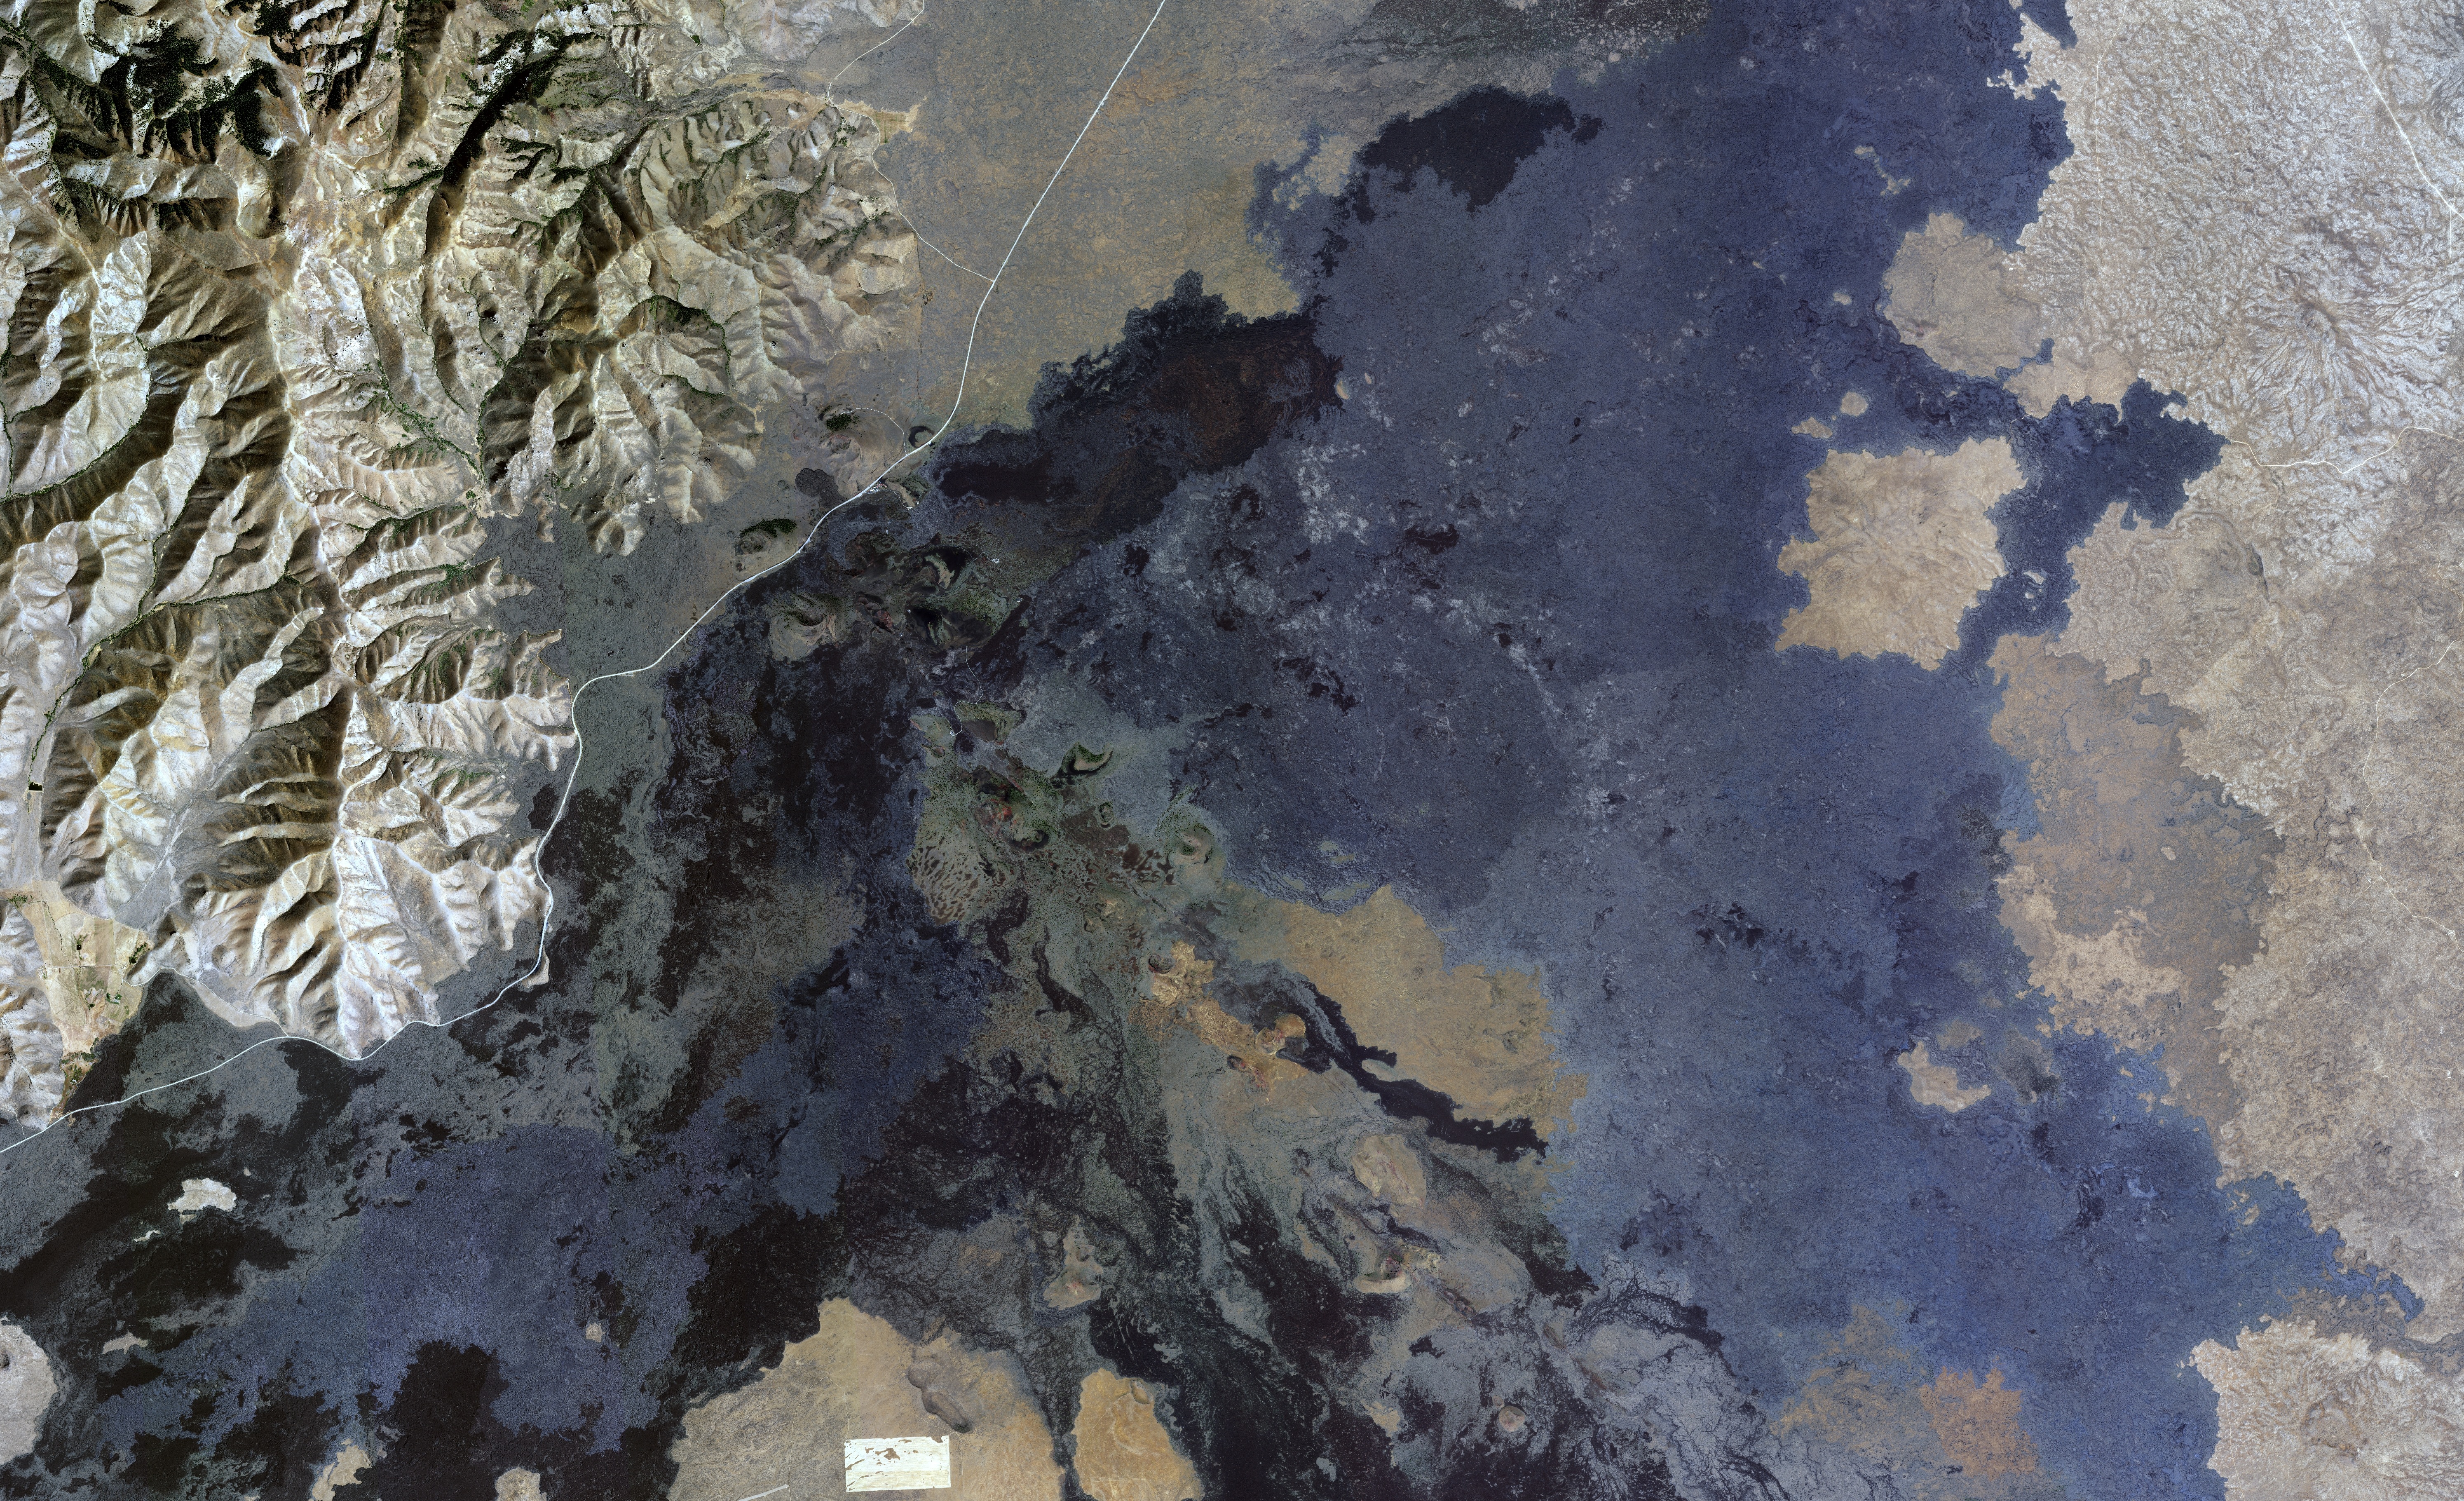
The blue colour in the apparent thermal inertia data following the shapes of the flows indicates that this is not another cloud. Based on field observations by Dr. Catherine Neish, the low thermal inertia is likely due to fine tephra blown to these areas by wind.