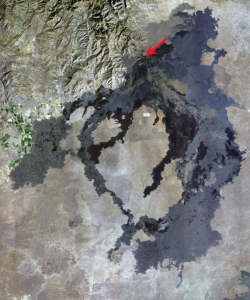
This week, I compared the accuracy of the high-resolution Digital Surface Models (DSMs) collected by Unmanned Aerial Vehicles (UAVs) at a lava pond within Craters of the Moon with GPS data collected on the ground. I received GPS data obtained in 2014 in the form of latitude and longitude coordinates and elevation in an excel spreadsheet for the transect along the lava pond, which is approximately located where the arrow points in the image below.
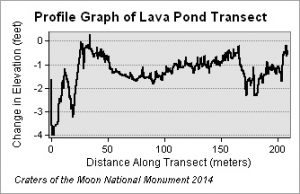
I added the coordinate and elevation data to my map package and used the Editing feature to digitize the points into a line in ArcMAP, which I then added as a new layer. Using the 3D Analyst feature, I was able to create a profile graph of the transect along the layer that included the high-resolution DSM to observe the change in elevation recorded in this layer. The result is the profile graph located below.
To compare this profile graph to the data collected with the GPS, I created a graph in excel using the original points collected along the transect with the GPS. The result is below.
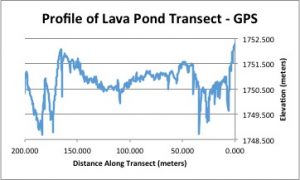
Though there are differences between the profiles, both follow the same general trend.
Catherine
June 2, 2016 — 6:10 am
Neat! It would be useful to overlay the two plots, and quantify the differences between them. We can repeat this procedure for all of the transects we have collected to determine the relative accuracy of the two approaches.