Written by Paul Cote
When compiling a set of geographic data from several sources, one is often faced with the problem that the coordinate systems used to describe the geometry of one data layer is not the same as the others. This section regards the simple case of rectangular coordinate systems in which x and y axes are perpendicular to each other (orthogonal), and the units on each axis are the same and constant. The issues arising from the fact that the earth is not flat will be tackled in the section on projection systems. Techniques for transformation of rectangular coordinate systems come into play when you have two maps that have been projected with the same method, or when the projection for one of the maps is unknown or irrelevant.
The 4 main techniques of transforming rectangular coordinates are:
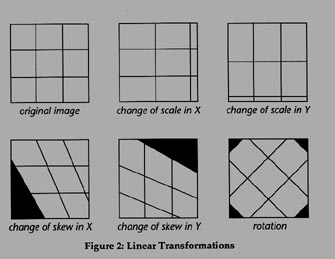
- Linear Transformations
- Translation
- Scaling
- Rotation
Higher Order Transforms:
Translation
Translation is a simple displacement of the entire map by a certain offset distance along one or both axes.
Coordinate systems for describing locations within large areas often extend to very large numbers. The State Plane Coordinate System for Massachusetts, when expressed in feet, extends into the hundreds of millions. When an entire dataset is located completely within a small part of of such a standard system (Boston, for example) an offset will be subtracted from the X and Y for each coordinate to keep the numbers small.
After translation the geometric relationships within the data remain exactly the same. Reducing the magnitude of coordinates can be an important issue in determining the efficiency that calculations can be made within the computer -- especially when decimal precision is required. In metadata, these shift parameters are given as False Northing and False Easting.
Scaling
Scaling is a simple multiplication of the X and Y units by some constant.
Scaling is the obvious solution when assimilating maps having the same projection, but different units (Massachusetts State Plane meters, vs. feet, for example.)
If scaling X and Y by the same constant, all geometric relationships remain proportional. Scaling X and Y by different constants can be done, and is sometimes useful when attempting to overlay a layer with an unknown projection onto another, as occurs when establishing a coordinate system for a scanned map (Georeferencing).
Rotation
Rotation of coordinate systems is simply illustrated as the pinning of the coordinate origin, and a radial motion of the axes while maintaining their orthogonal relationship. Technically, this is accomplished by computing the new X and Y as a trigonometric function of the old X and Y.
Rotation of coordinate systems is rarely required when dealing with data in known coordinate systems (owing to the convention that grid north is oriented to true north.) But rotation is almost always necessary when georeferencing a scanned map. Note that in most systems, the rotation of raster data requires resampling (and its associated effects on precision.)
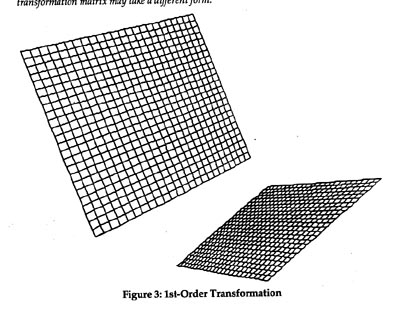
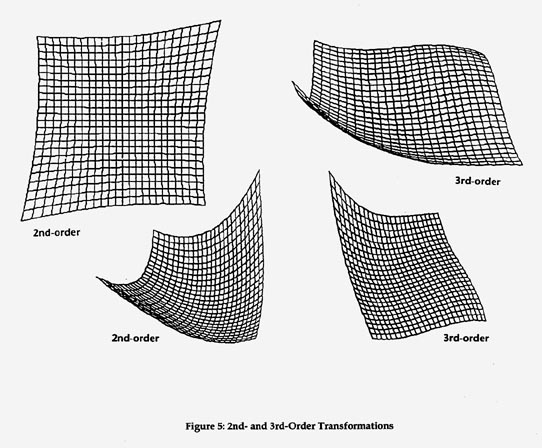
Warping
Warping is a category of coordinate transformation technique that includes all of the mathematical methods more complicated than the the three above.
The simplest form of warping -- Polynomial Transformation treats one of the coordinates as a polynomial function of the other. This method essentially transforms straight lines into curved ones. The higher order of the polynomial, the more curvy the result will be.
More complicated methods of warping can use one polynomial transform in one part of the map, and another polynomial in another part. Methods of this type are called Rubber Sheeting.
Software Interfaces for Coordinate Transformation
All of this math can seem pretty intimidating so it should be noted that many decent GIS systems provide a graphical interface for coordinate transformation. The simplest type of interface permits the user to enter the coordinates of several points from one map and the coordinates for the corresponding points in another map. Better software interfaces permit the set of control points to be graphically selected from the two maps on the computer screen. The software then determines a combination of translation, scaling, rotation, and warping that will produce a of best-fit.
Depending on the quality of the maps being transformed, the care taken in locating matching control points, and the order of the polynomial used in the transformation, complex transformations of coordinates almost always result in some error. Good software will provide an error report for each control point, and an error for the entire map. These error reports, along with a graphic overlay of the transformed map with the target map, will allow the user to discover and correct problems with particular control points until the fit is as good as is required.
Map Projections and their Transformation
The most standard coordinate system for describing the geometry of things on planets like Earth is Latitude and Longitude (lat-lon). This coordinate system cannot logically be treated with normal coordinate system transformations as described above, because the axes are not orthogonal, and the units are not constant. A degree of longitude at the equator is much larger that a degree near one of the poles. The area of mathematics that deals with calculating geometric relationships in spherical coordinate systems like lat-lon is Geodesy the calculations involved in geodesy (spherical trigonometry) are much more complex than the plane trigonometry involved in rectangular coordinate systems, and most GIS products will not treat spherical coordinates correctly (although, if the area of analysis is small enough, the error may be negligible.)
The problem of mapping the curved surface of the earth in a rectangular coordinate system has been explored for centuries. The process for doing this is called Map Projection. No map projection is perfect, the method used always involves distortion of some kind. Choosing the best projection for a particular application always involves a choice of which sort of distortion is going to represent the area of interest in the least harmful way.
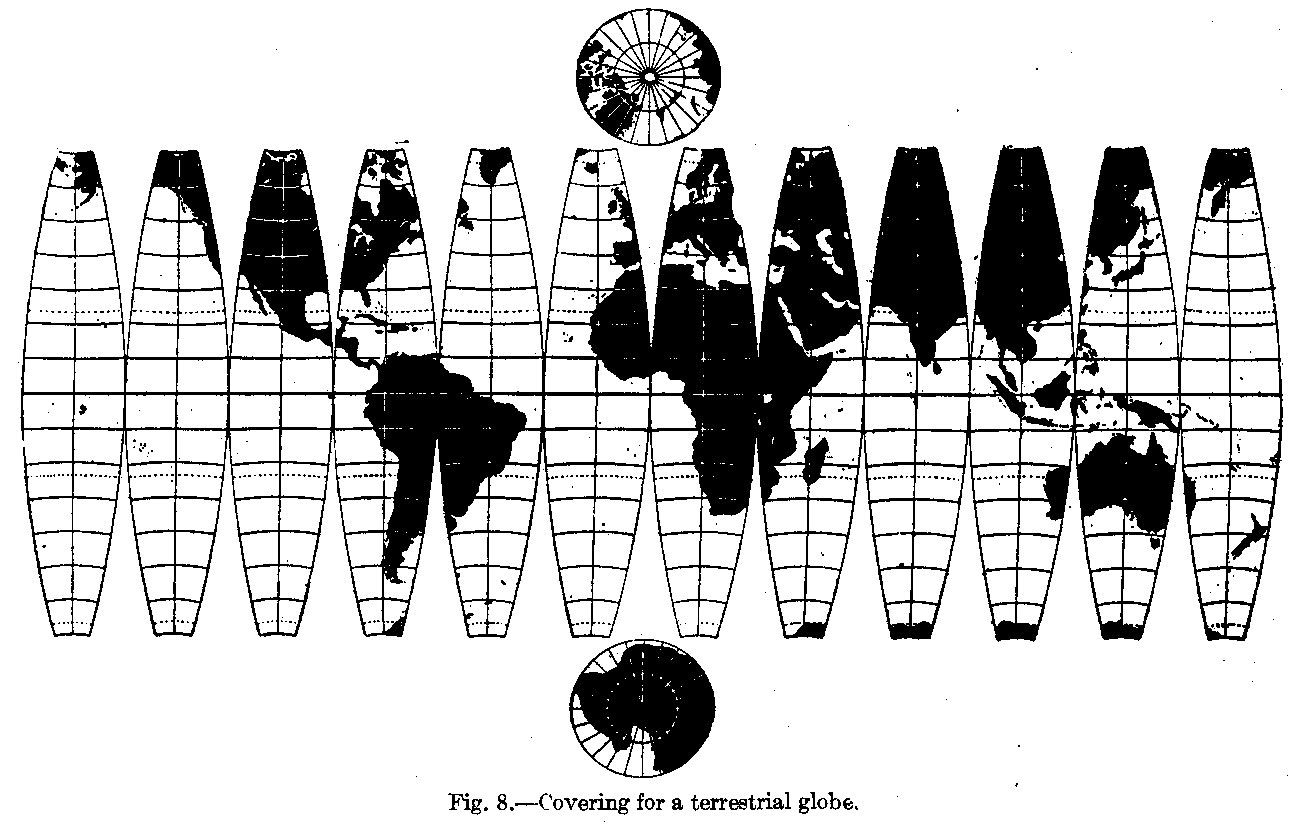
The term Projection derives directly from the concept that a silhouette of any sort of object can be projected onto a flat surface (as with a light source and screen.) In the case of (very simple) map projection, the object is a transparent globe with geographic features drawn on it. When projected on a flat surface, the outlines of features on the curved surface become transferred in a systematic fashion to the flat screen.
This illustration (taken from Principals of Cartography by Erwin Raisz, published by McGraw Hill) illustrates the concept behind the Orthographic projection.
We have now overcome the round-earth problem, and we can overlay a rectangular coordinate system on our map. However, we should note that the coordinate system misrepresents the size of shapes near the edges of the globe. To be most accurate, the center of this projection (it’s Point of Tangency) should always be at the center of our area of interest.
We could correct for the distortion in the size of objects represented near the edge by systematically widening the space between the meridians as we go out from the center — as in this example of Lambert’s Equal Area Projection.
In doing this we have ascended from our convenient analogy of a single light-source, to a process that is more difficult to diagram.
We now have two maps of one planet; each using a different projection system. We can lay the same coordinate grid on each of these projections, but we shouldn’t be surprised when we find that identical places on the globe have different coordinates on the two maps. This is the reason that projection conversion is important.
Given that the systematic distortions of each projection system are known, along with such important Projection Parameters such as (in the case of an orthographic projection) The Projection’s Center (its point of tangency), and coordinate system origin (its Datum,) are known, the locations differences in the coordinates between identical objects on the two maps can be described mathematically. Conversely, a map in one projection and coordinate system can be systematically transformed into another. Many good GIS products will convert among the hundreds of common projection systems provided the user can correctly specify the important projection parameters.
In GIS data, the use of orthographic projections is rare. The following illustration shows the three common variations on the concept of the flat projection screen.
A common variation on each of these takes off on the idea that the projection surface may intersect the surface of the globe (in technical parlance, the surface would be Secant, as opposed to tangent, with the sphere.)
The advantage of this, is that the area of nearly correct scale will be expanded. In the case of an orthographic projection a secant projection plane gives a circle of correct scale instead of a mere point. In cylindrical and conic projections, a secant projection surface yields 2 Standard Parallels instead of 1.
For each projection variant, a different set of projection parameters may be required in order to adequately specify a transformation method. Fortunately, cartographers have come to agreement on several standard projections that work best for different parts of the world. If you are lucky, or insightful enough to ask for it, data you obtain will come with the projection and coordinate system defined.
A Cylindrical Projection: The Mercator
The Mercator projection, invented by Gerardus Mercator (aka Gerardus Kremer) in 1569, is probably the most famous projection of all time. It is indisputably the best map projection for navigators because of its unique quality that an earth-bound traveler, following a line of constant compass direction, can chart her course on the mercator projection with a Straight Line. This quality was not accidental, Gerardus was a mathematics buff who used a logarithmic displacement of the parallels of latitude to obtain this effect as a service to navigators. It is said that Mercator was the first person to call a book an Atlas. In 1544 he was imprisoned for heresy, but released for lack of evidence.
Because the standard Mercator map is tangent to the Earth at the Equator, it represents size and scale only in lower latitudes, and grossly overestimates them near the poles. Consider that the north pole is actually a point, but in cylindrical projections it explodes to a line.
font size=3>The Universal Transverse Mercator Projection System
The most standard projection system for large-scale mapping projects (like the national map series produced by the U.S. Geological Survey, and the Ordinance Surveys of Britain and France) is a variation on the Mercator called the Universal Transverse Mercator (UTM. This projection overcomes the distortion problem inherent in the standard Mercator by simply putting the tangent line of the projection surface near the center of the area of interest.
The UTM system uses a Transverse version of the projection which is tangent along a meridian instead of the equator. There are 60 positions for this projection, dividing the planet into 60 zones. These zones guarantee that any place on earth can be no further than 3 degrees of longitude from a standard meridian. The UTM projection maintains the navigational convenience of the original design.
The Importance Metadata for Coordinate System and Projection Identification
The reconciliation of coordinate systems between maps and digital geographic data can at times involve a lot of guess-work, and can result in an unpredictable spatial mismatch of data that will impact the quality of your analysis, and could render all of your findings indefensible. There are ways of defending yourself against the insidious mystery of coordinate systems, however. The solution is metadata! If you are working with quality geographic information, and If you have foreseen the inevitable problems, you will have obtained, demanded, information about the coordinate system and projection used.