We put a lot of trees into the ground. What trees should they be?
Sally breaks down what our lab does and why it matters in this video from Research2Reality.
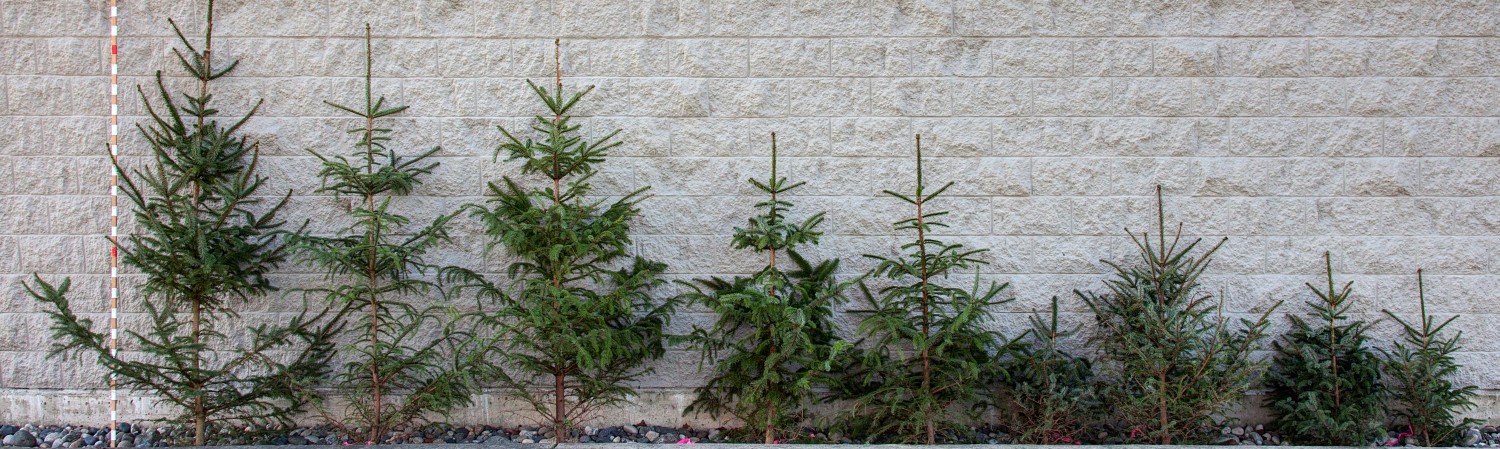
Sally breaks down what our lab does and why it matters in this video from Research2Reality.

If you want to know more about the hotter droughts mentioned in Colin Mahony’s post a few weeks ago on forest management strategies under climate change mega-disturbances, you might be interested in this recent paper from Allen, Breshears, and McDowell on expectations for forest drought mortality.
Craig D. Allen, David D. Breshears, and Nate G. McDowell 2015. On underestimation of global vulnerability to tree mortality and forest die-off from hotter drought in the Anthropocene. Ecosphere 6:art129. http://dx.doi.org/10.1890/ES15-00203.1
What does an expanding forest look like?
How hard is it to tell how old a natural forest is?
At what stage during the afforestation of a landscape can we say: “This is a forest.”?
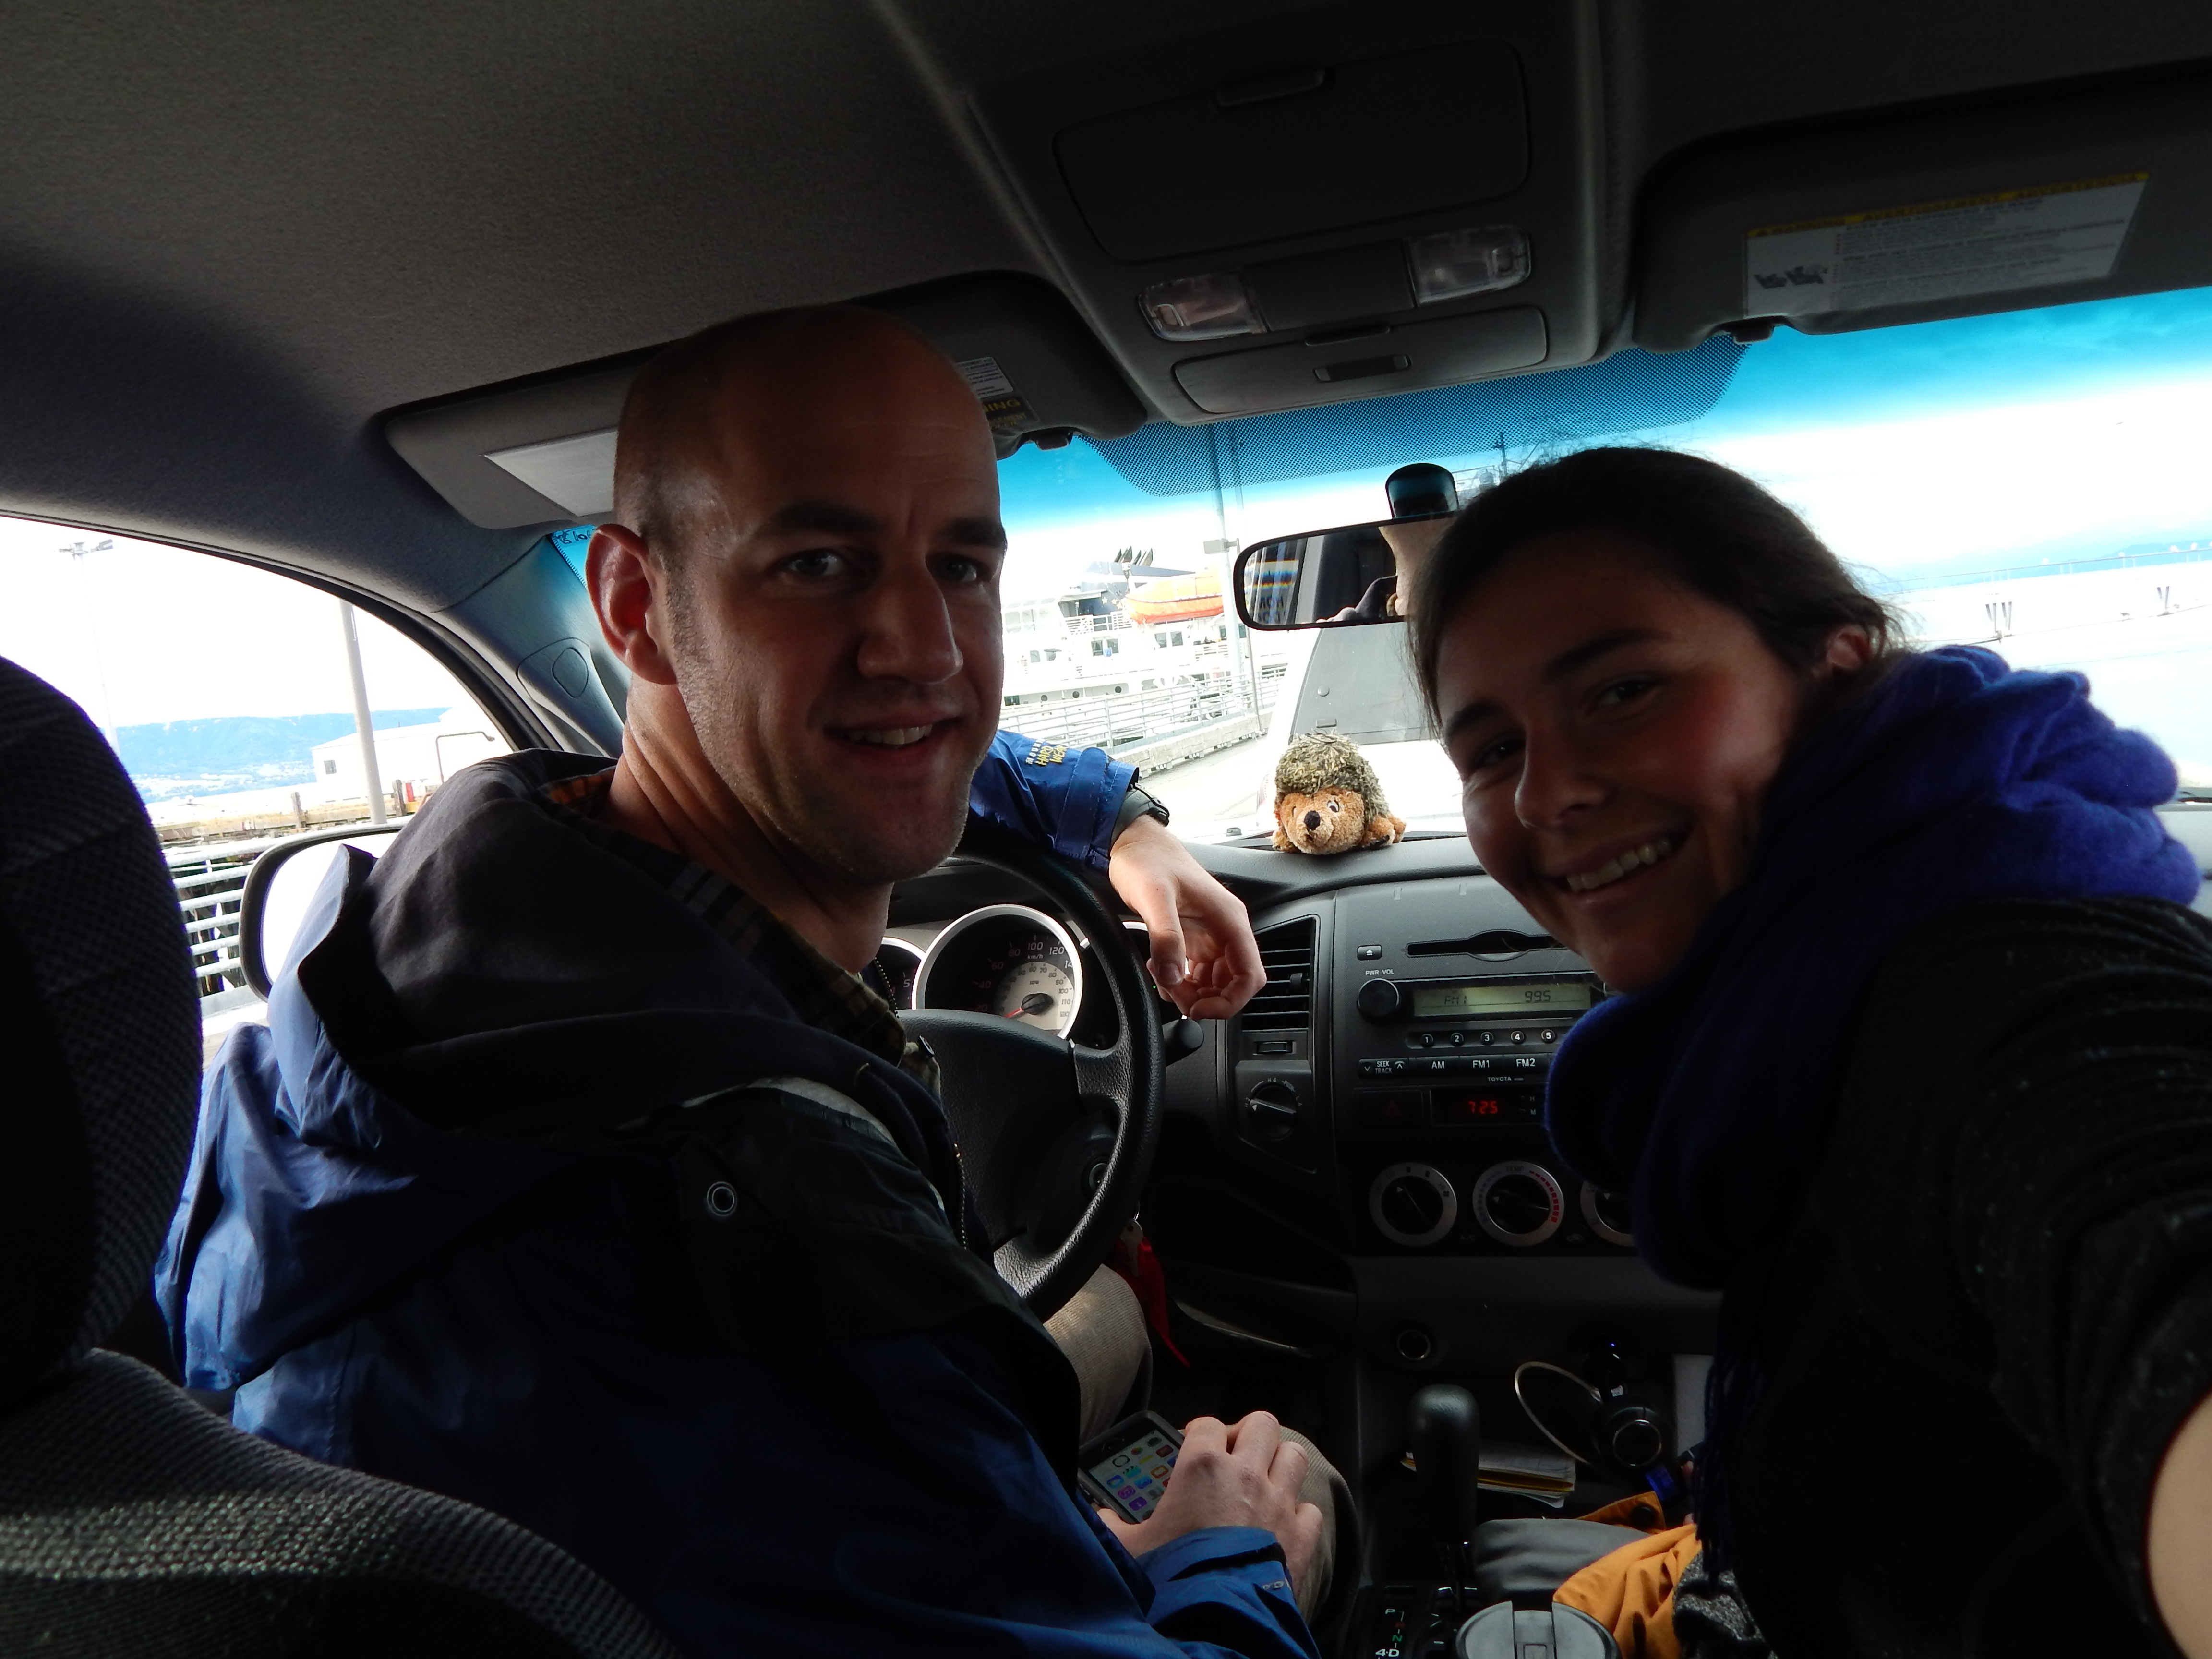
These are some of the questions I had in mind when I started the 4000-km long road trip to Alaska, with my friend and labmate Ian, also member of the Aitken group, Bean, the famous and beloved Aitkenlab truck, and Jethro the rescued dog toy that has become our mascot over the years.
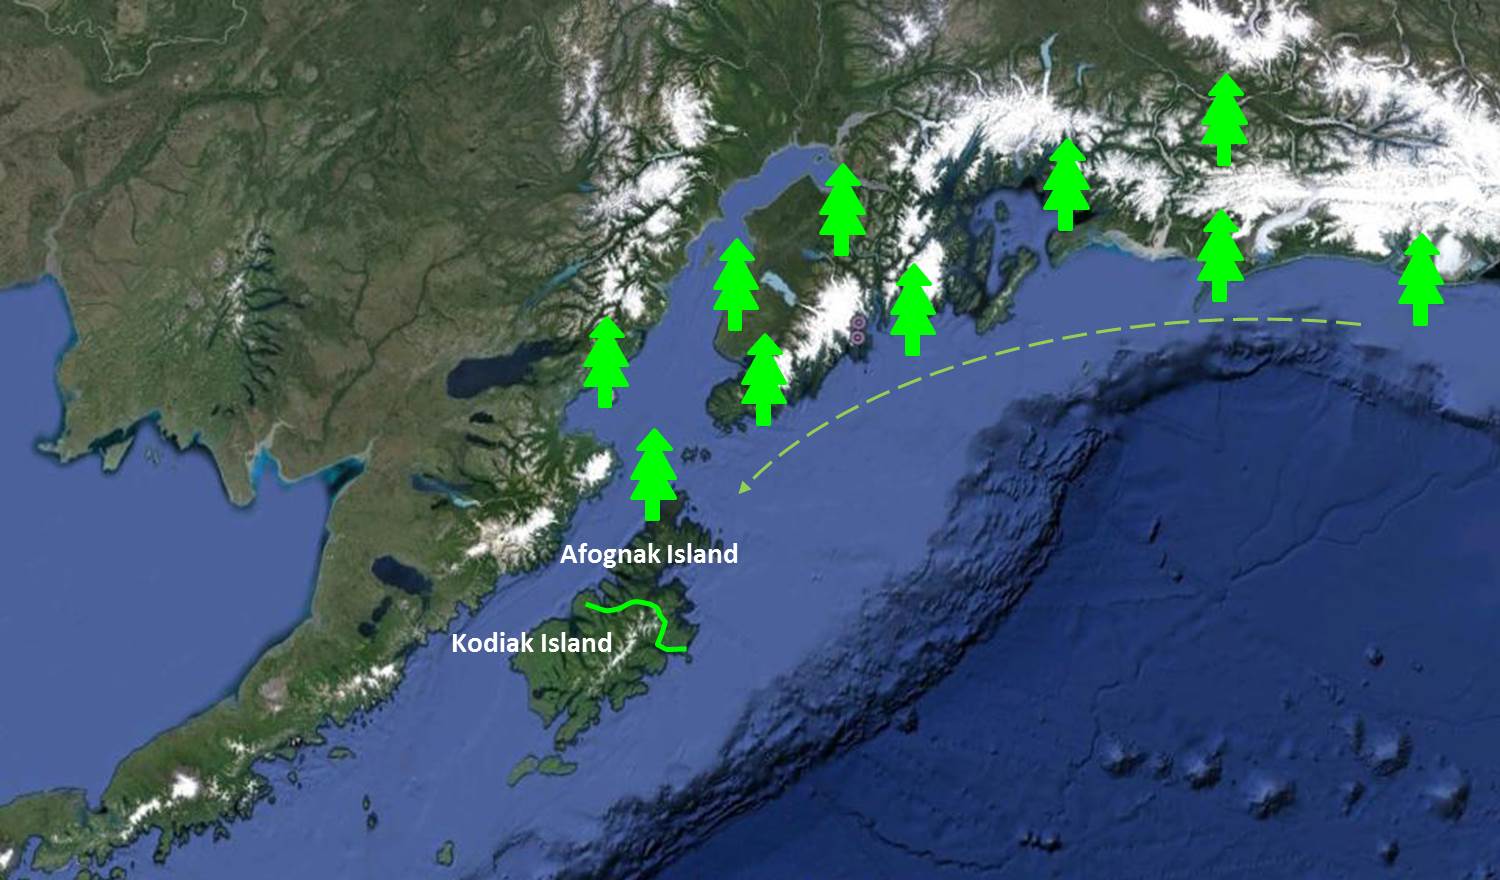
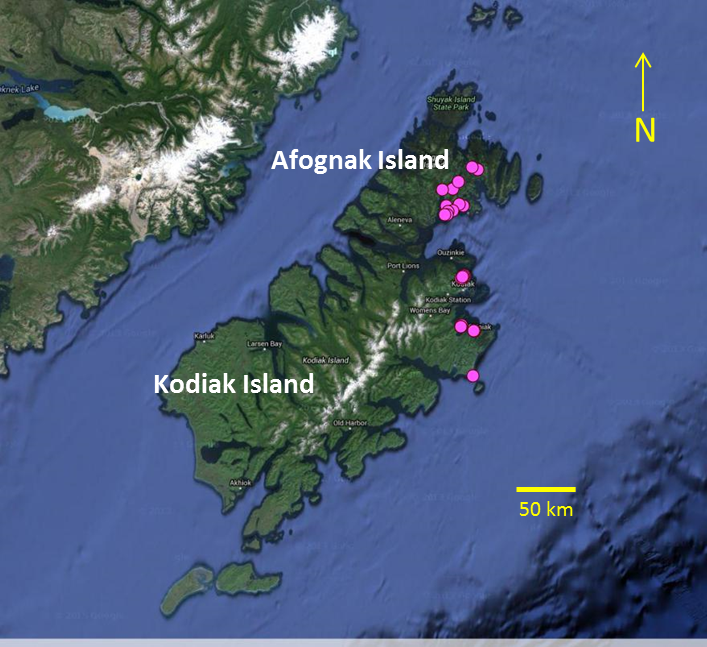
My goal: reaching the edge of the coastal Sitka spruce forest on the Kodiak Archipelago, and sampling several stands at different distances from the front of expansion. Below is a map showing the Alaskan range of Sitka spruce forest. The arrow indicates the historical route of migration of spruces after the last ice age. Beyond the green line, You’ll have to look very hard to find any conifer tree, or even any tree taller than you.
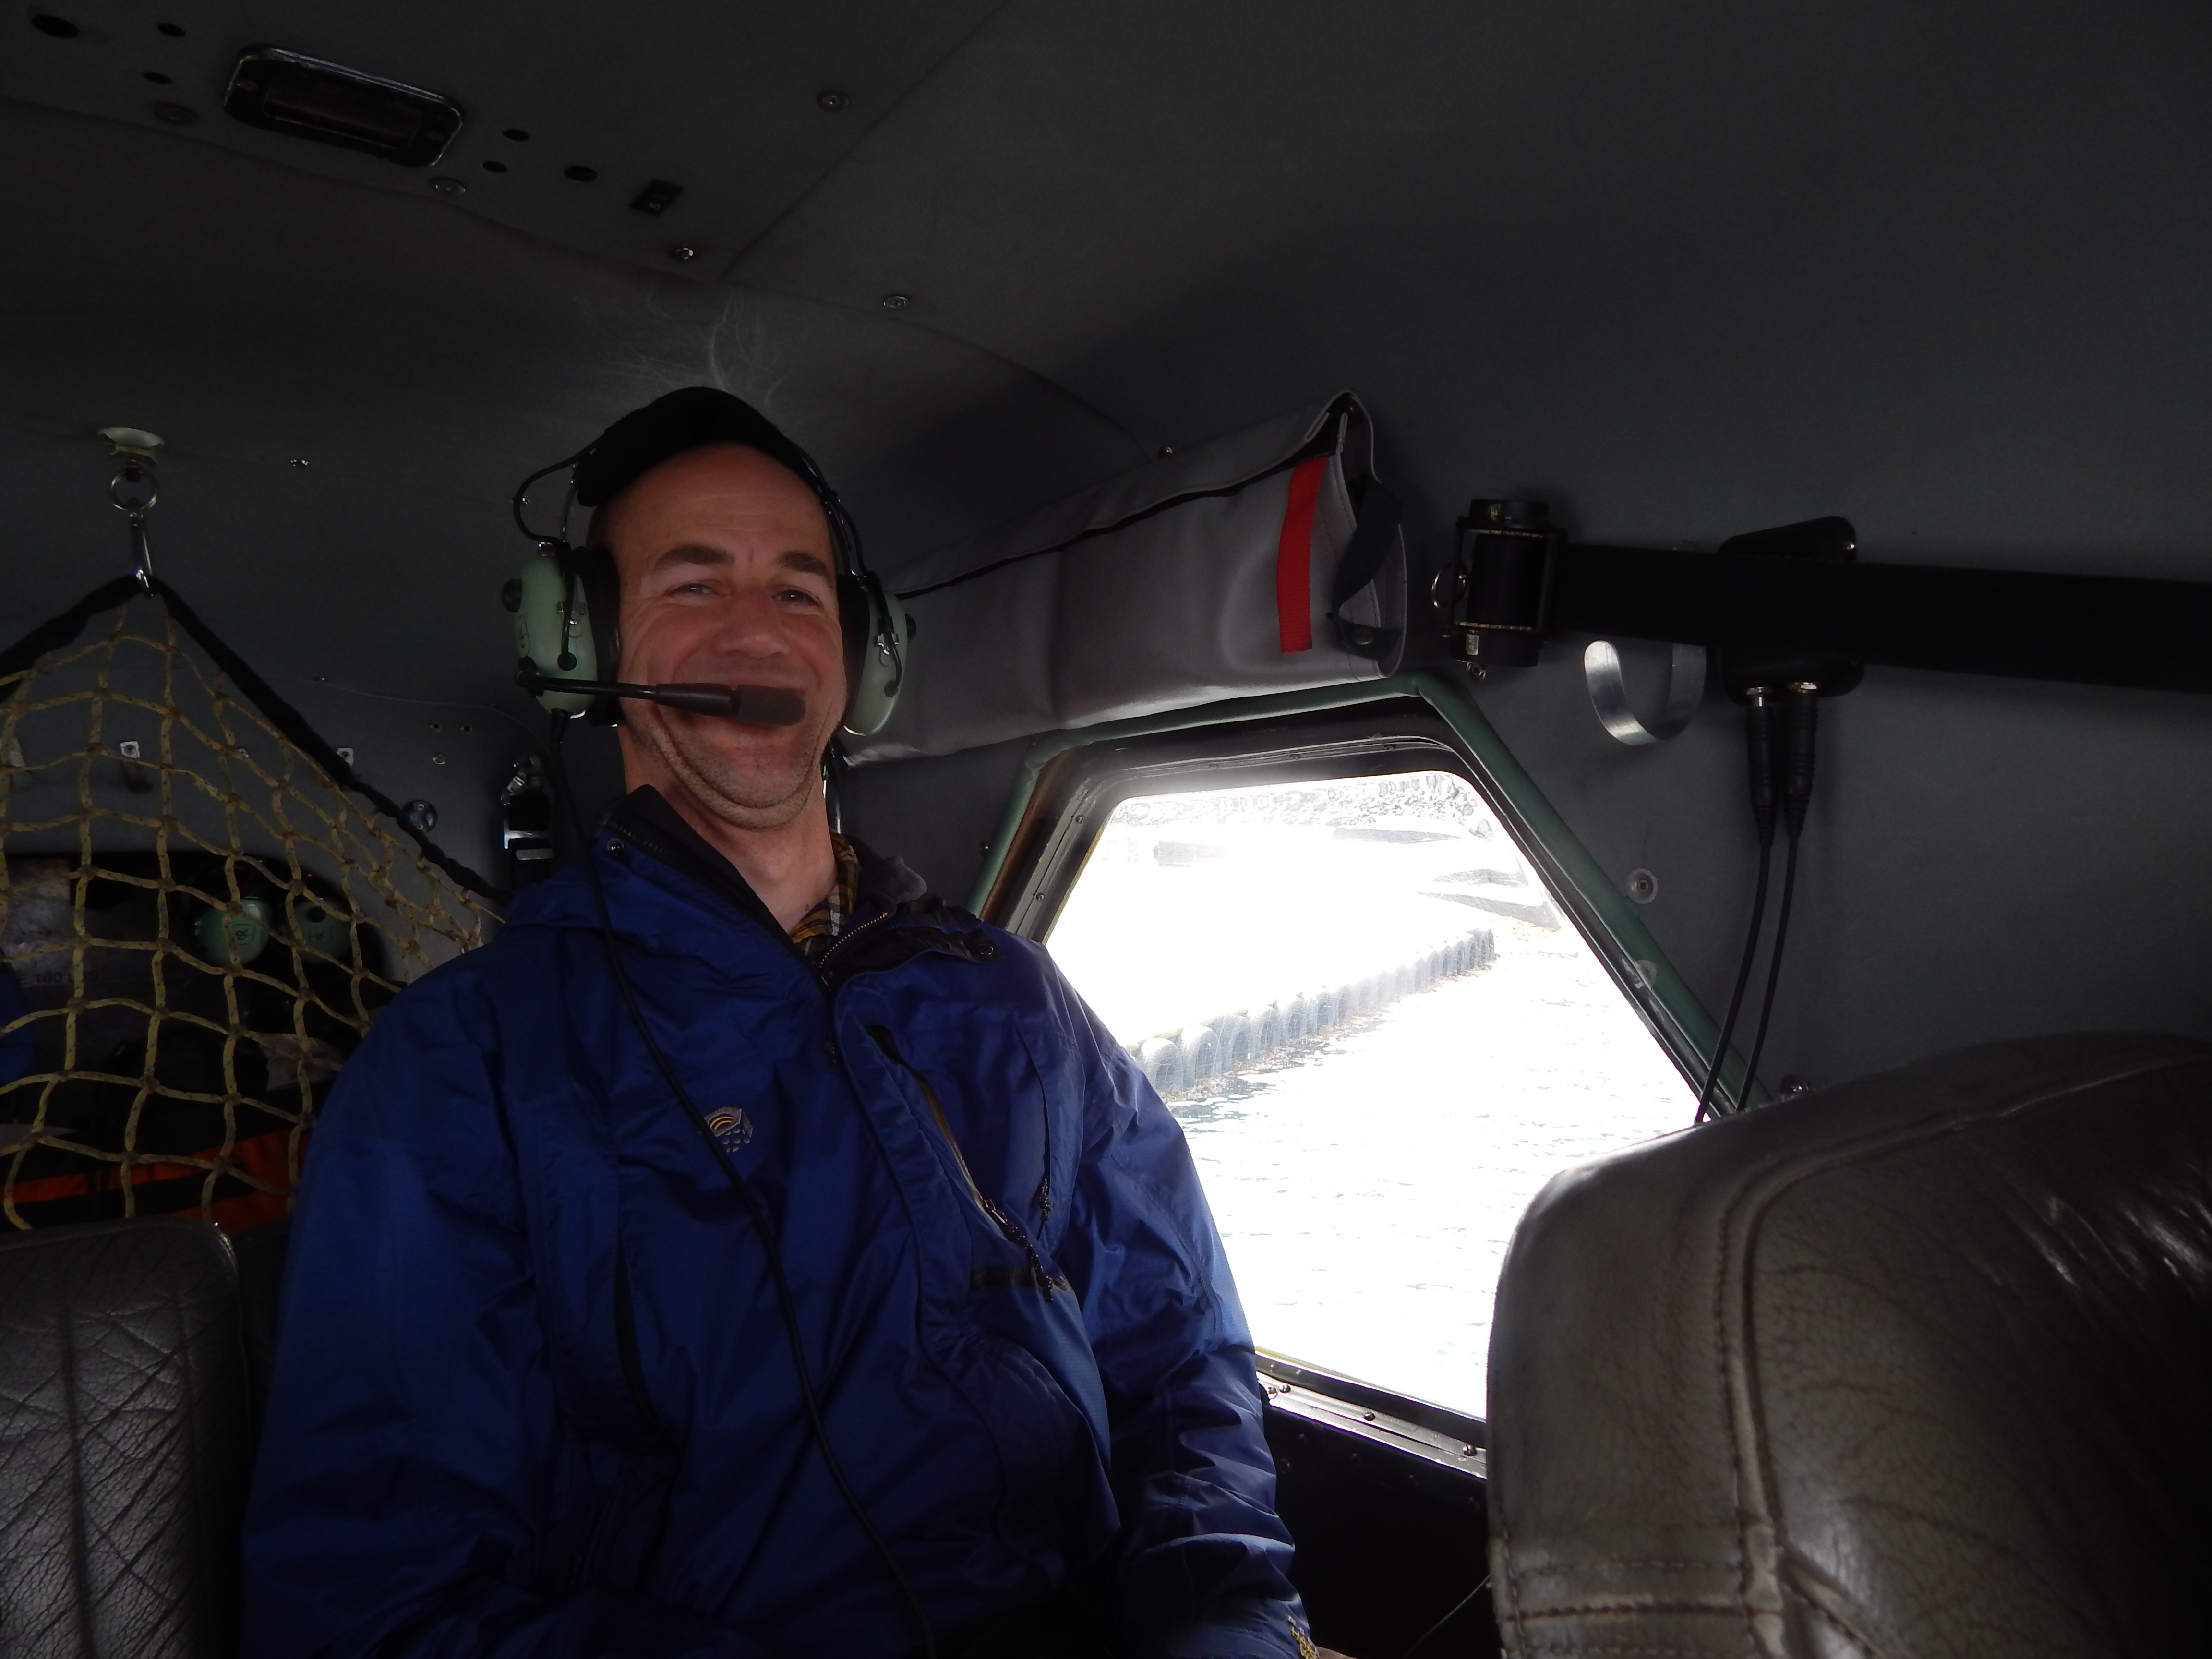
Once arrived in Kodiak city, the journey is not over. The forest stands we want to work in require an additional floatplane ride and several miles of dangerous driving on dirtroads. And a dive into welcoming devil’s club bushes.

On the plus side, the forests are stunning!
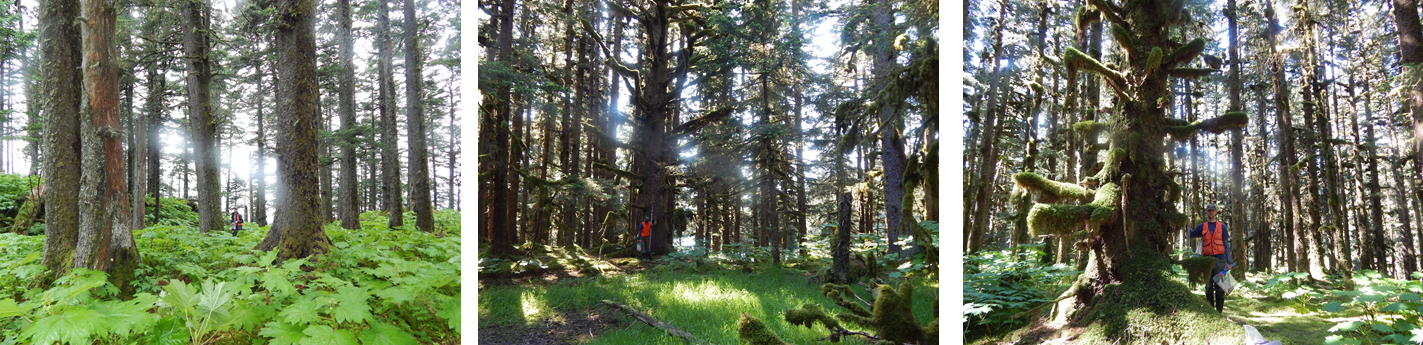
There we are, finally. We can start sampling! But wait… sampling what? and how?
Here is what I decided to do:
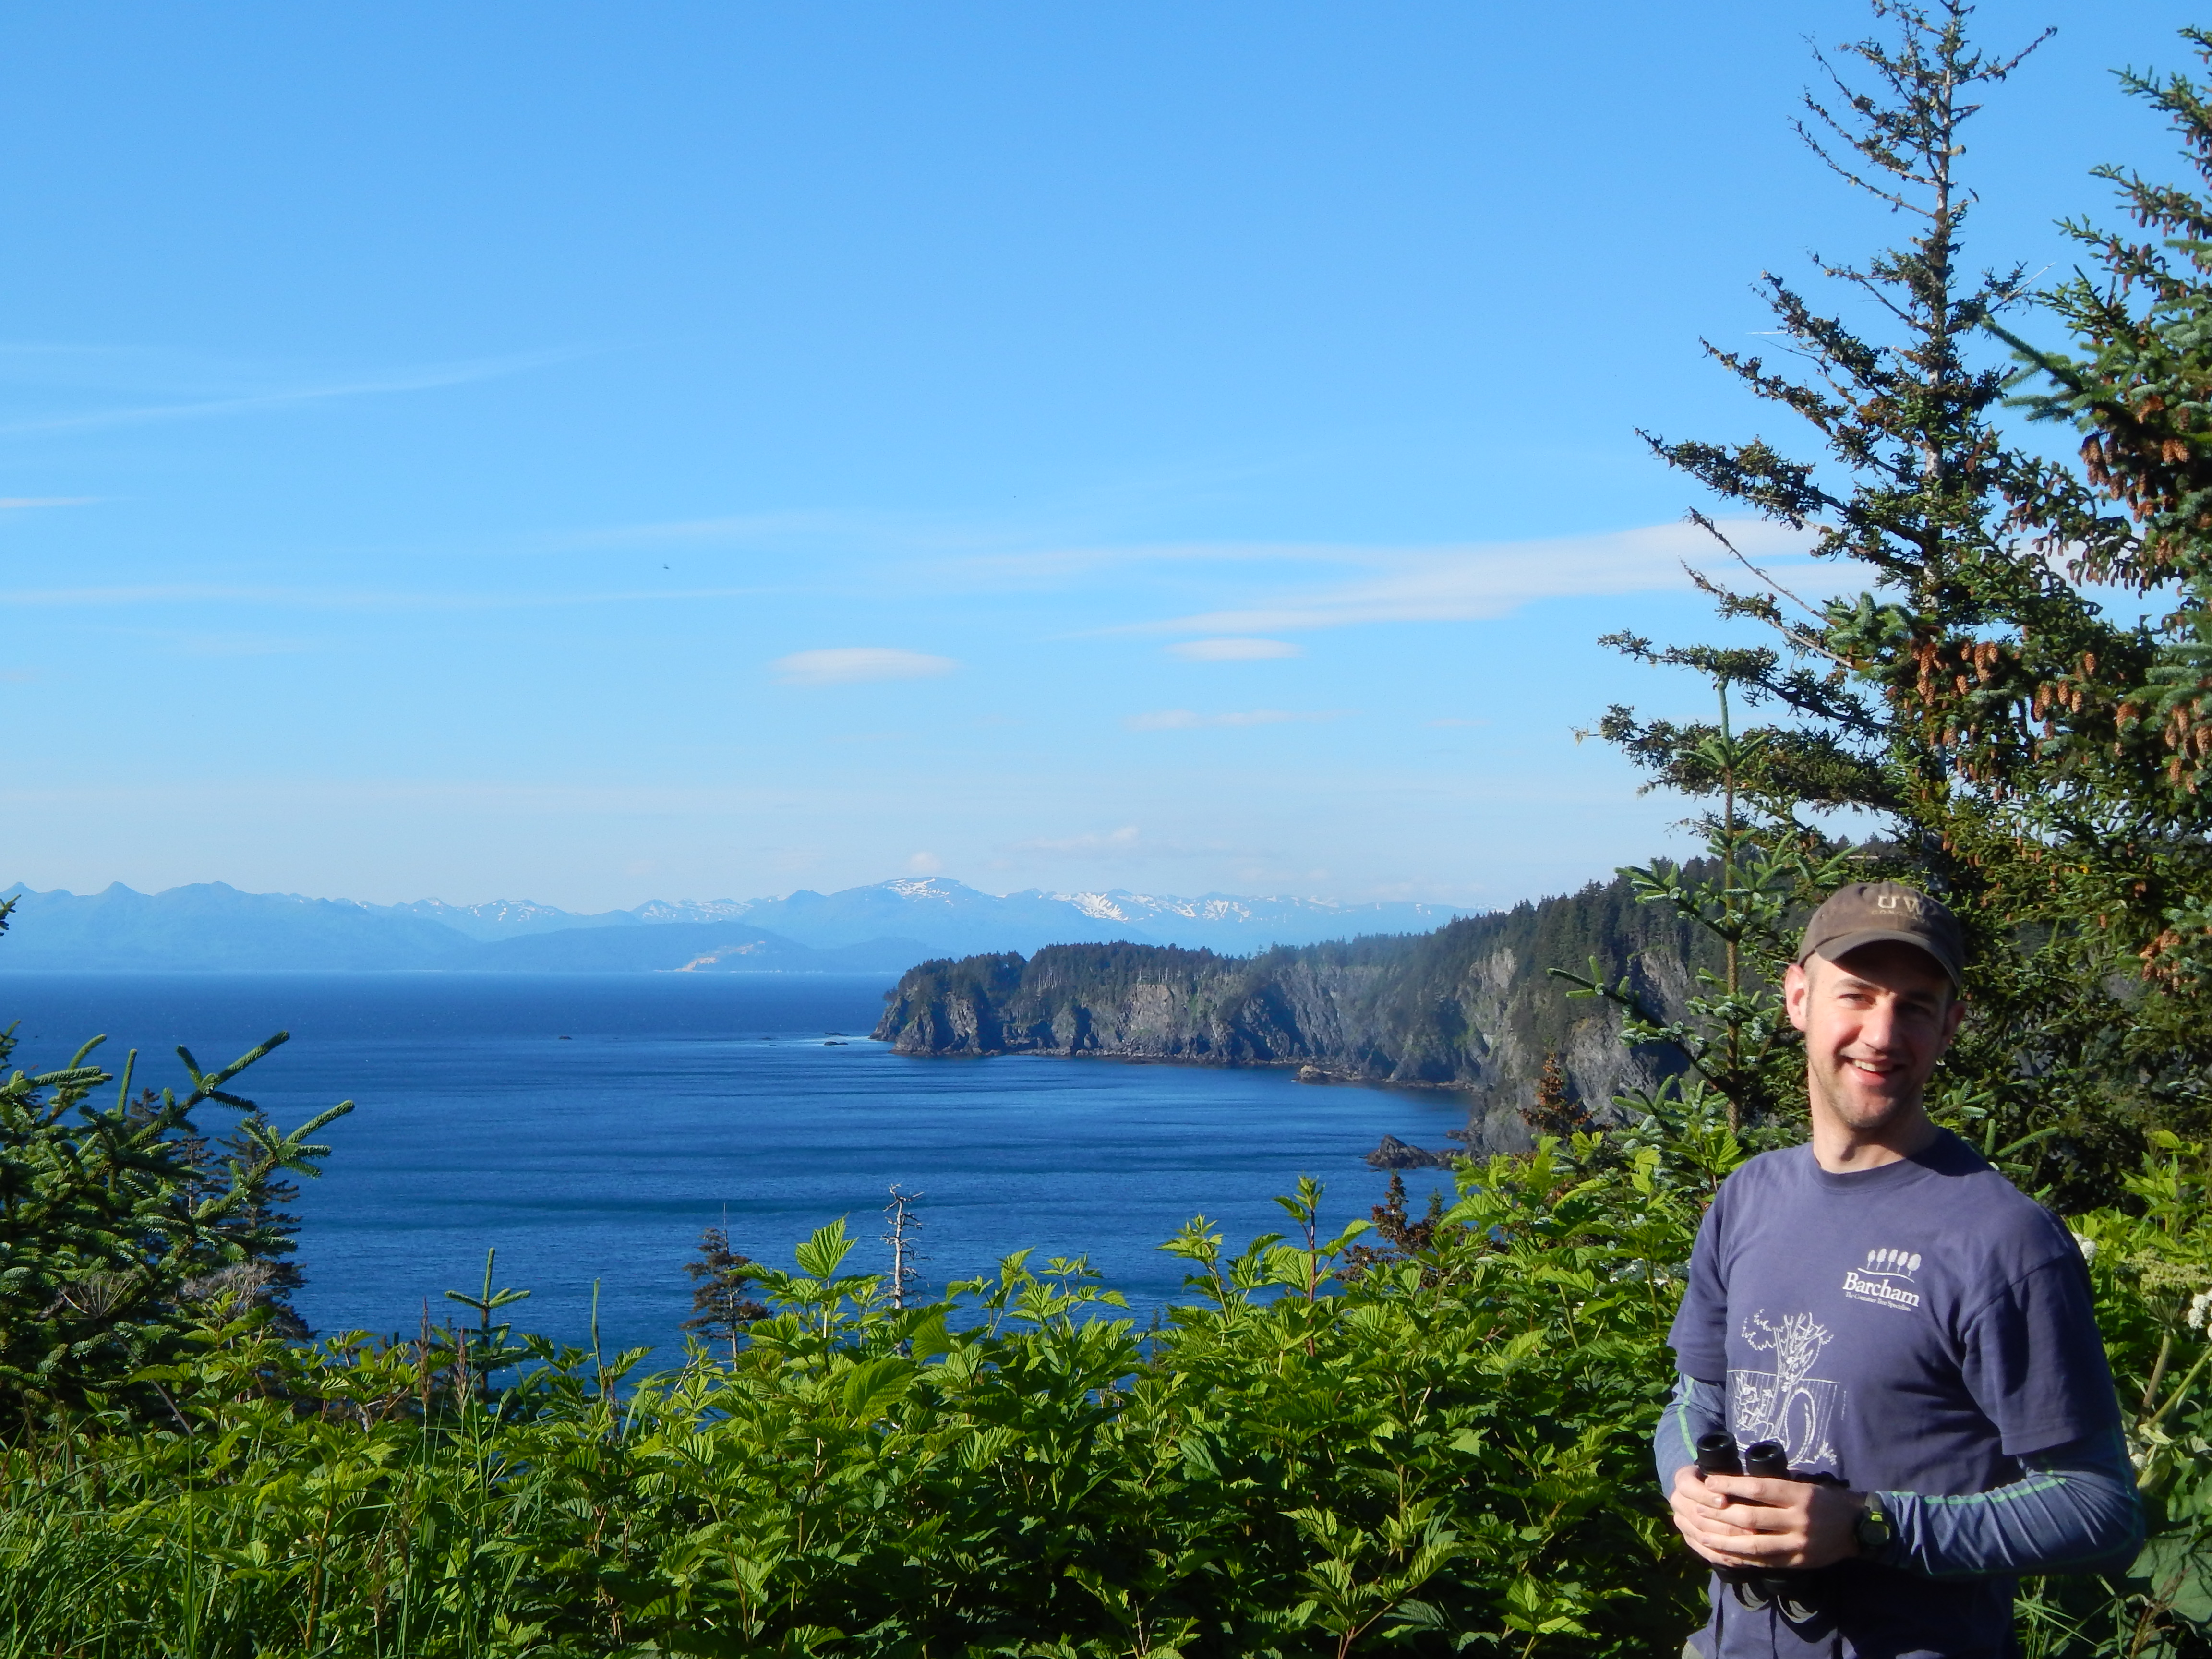
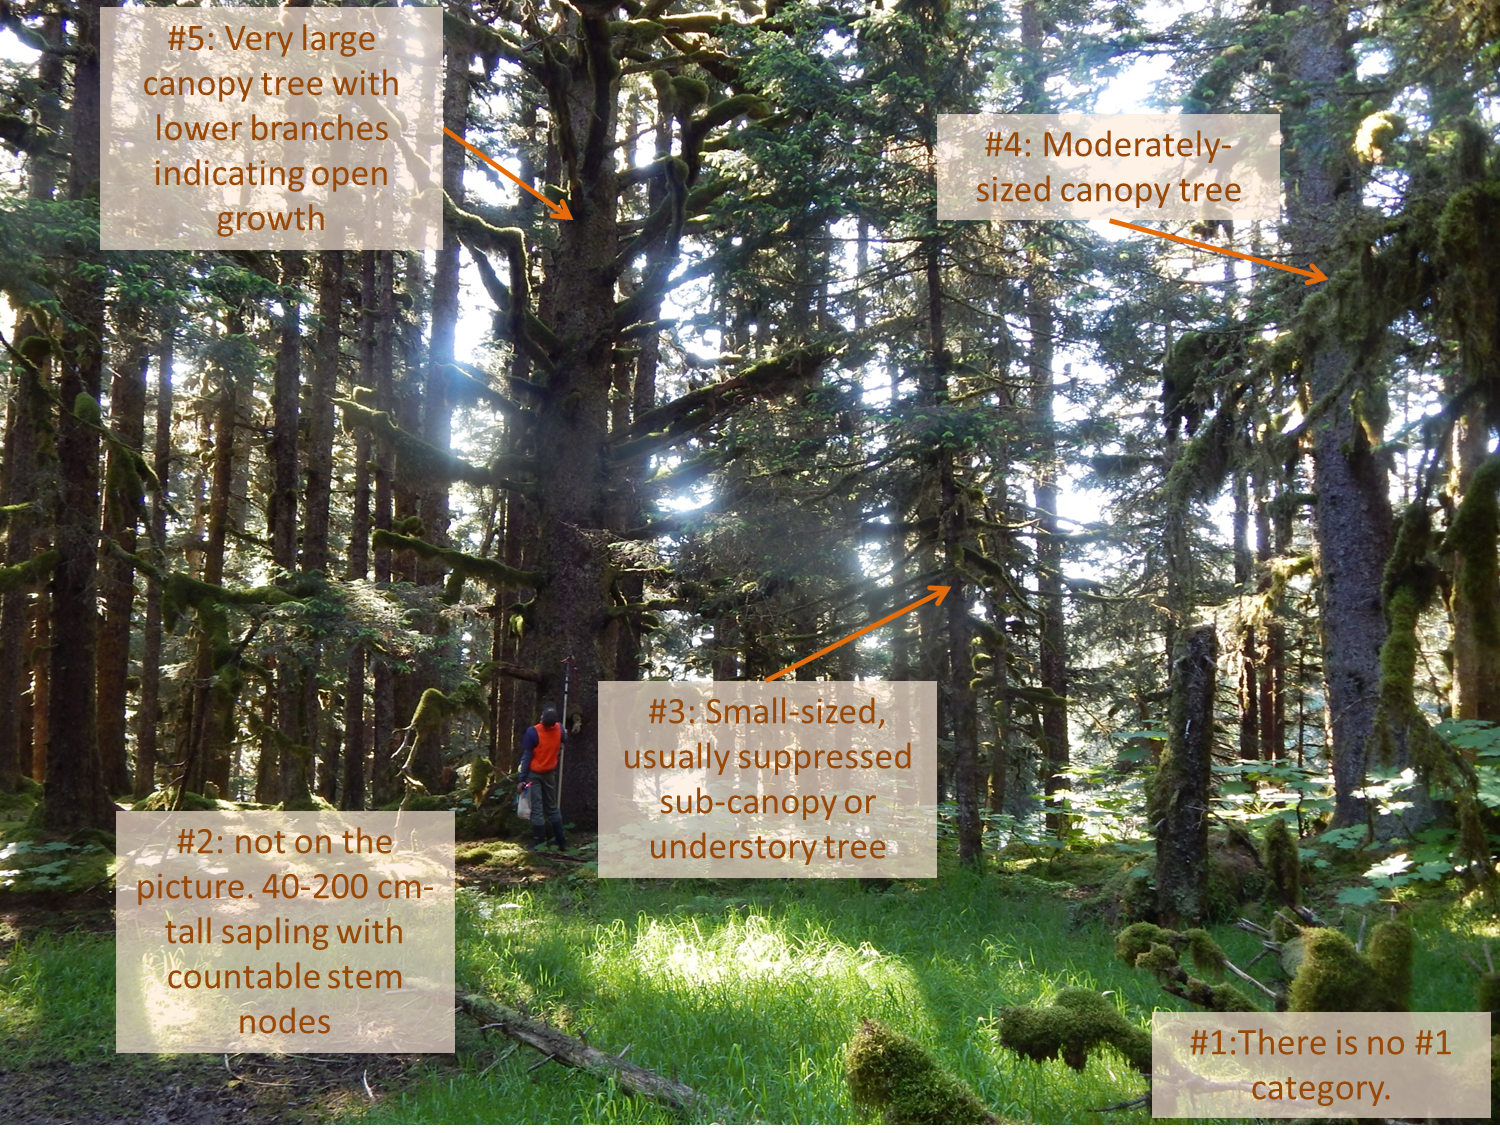
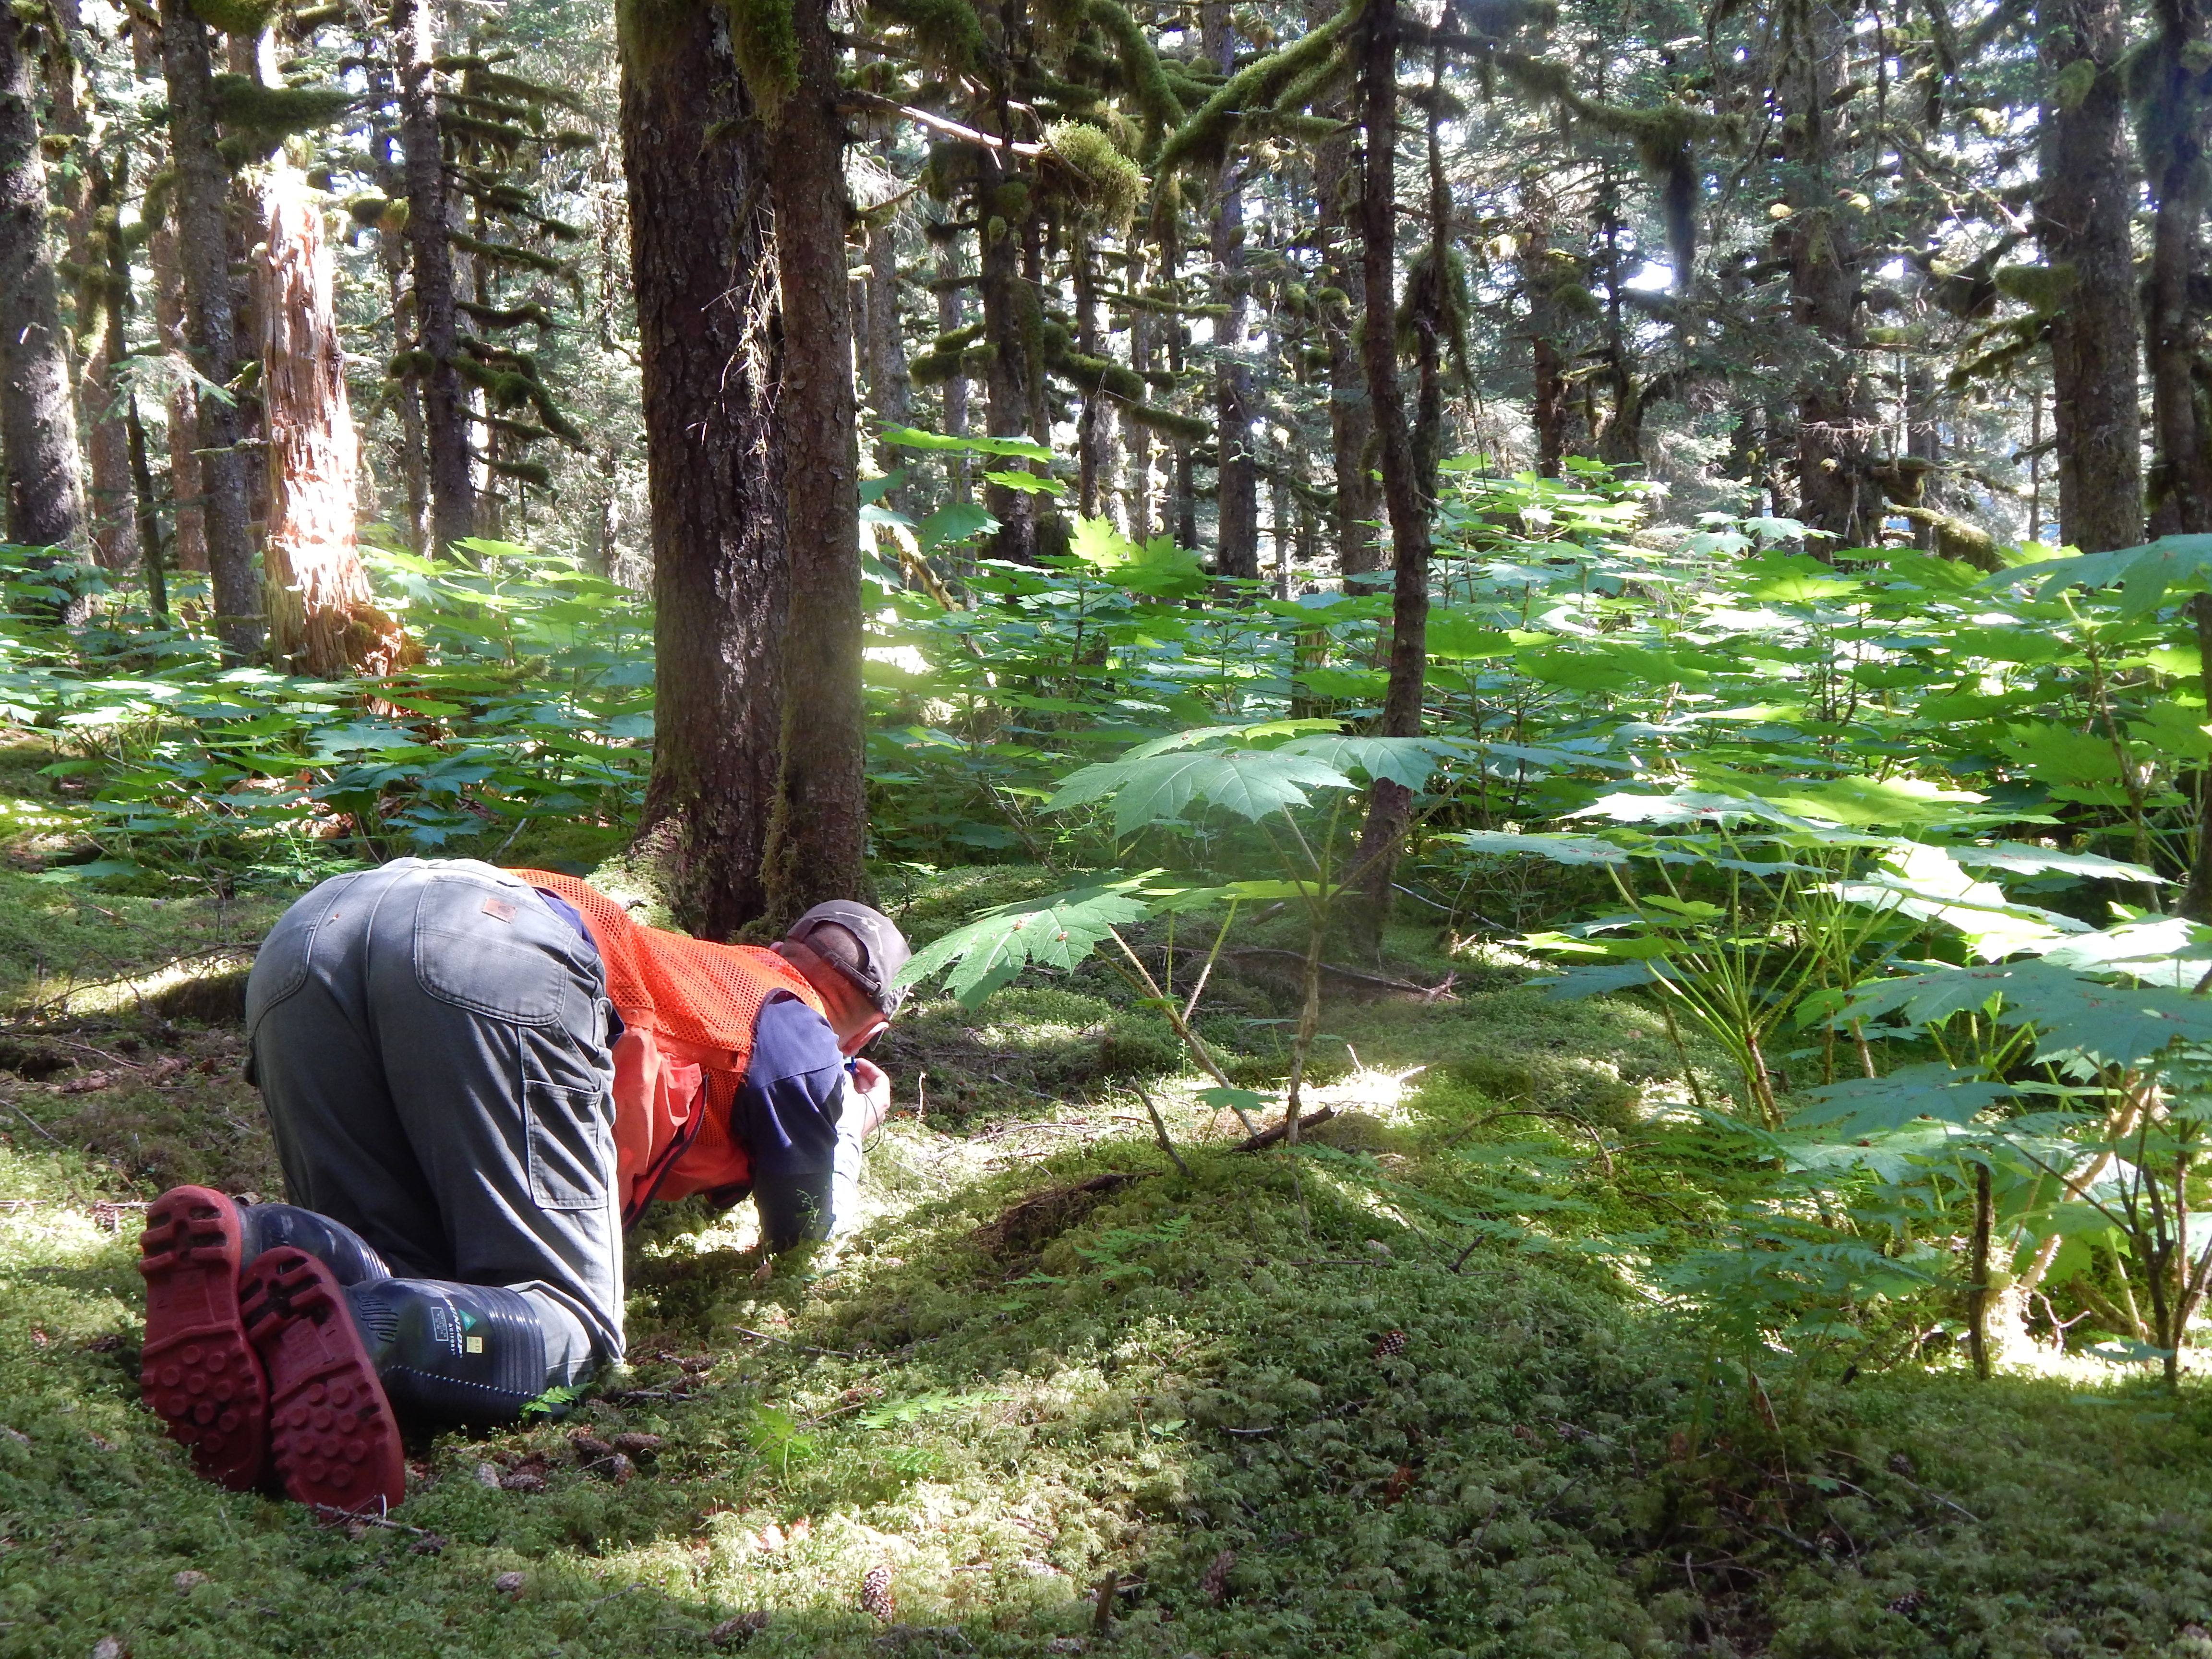
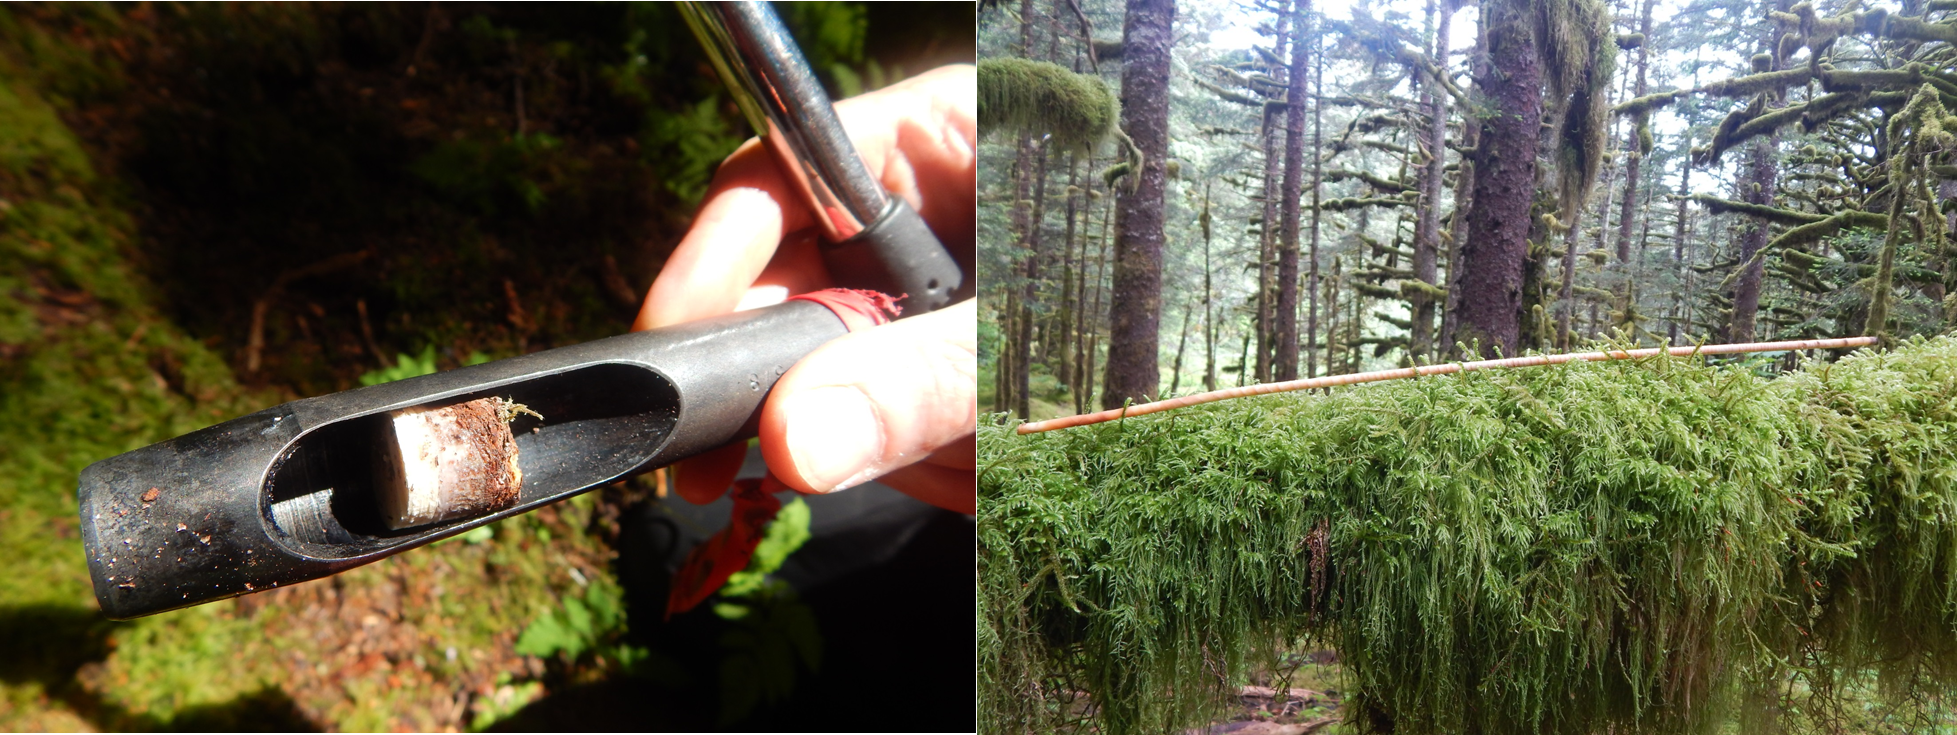
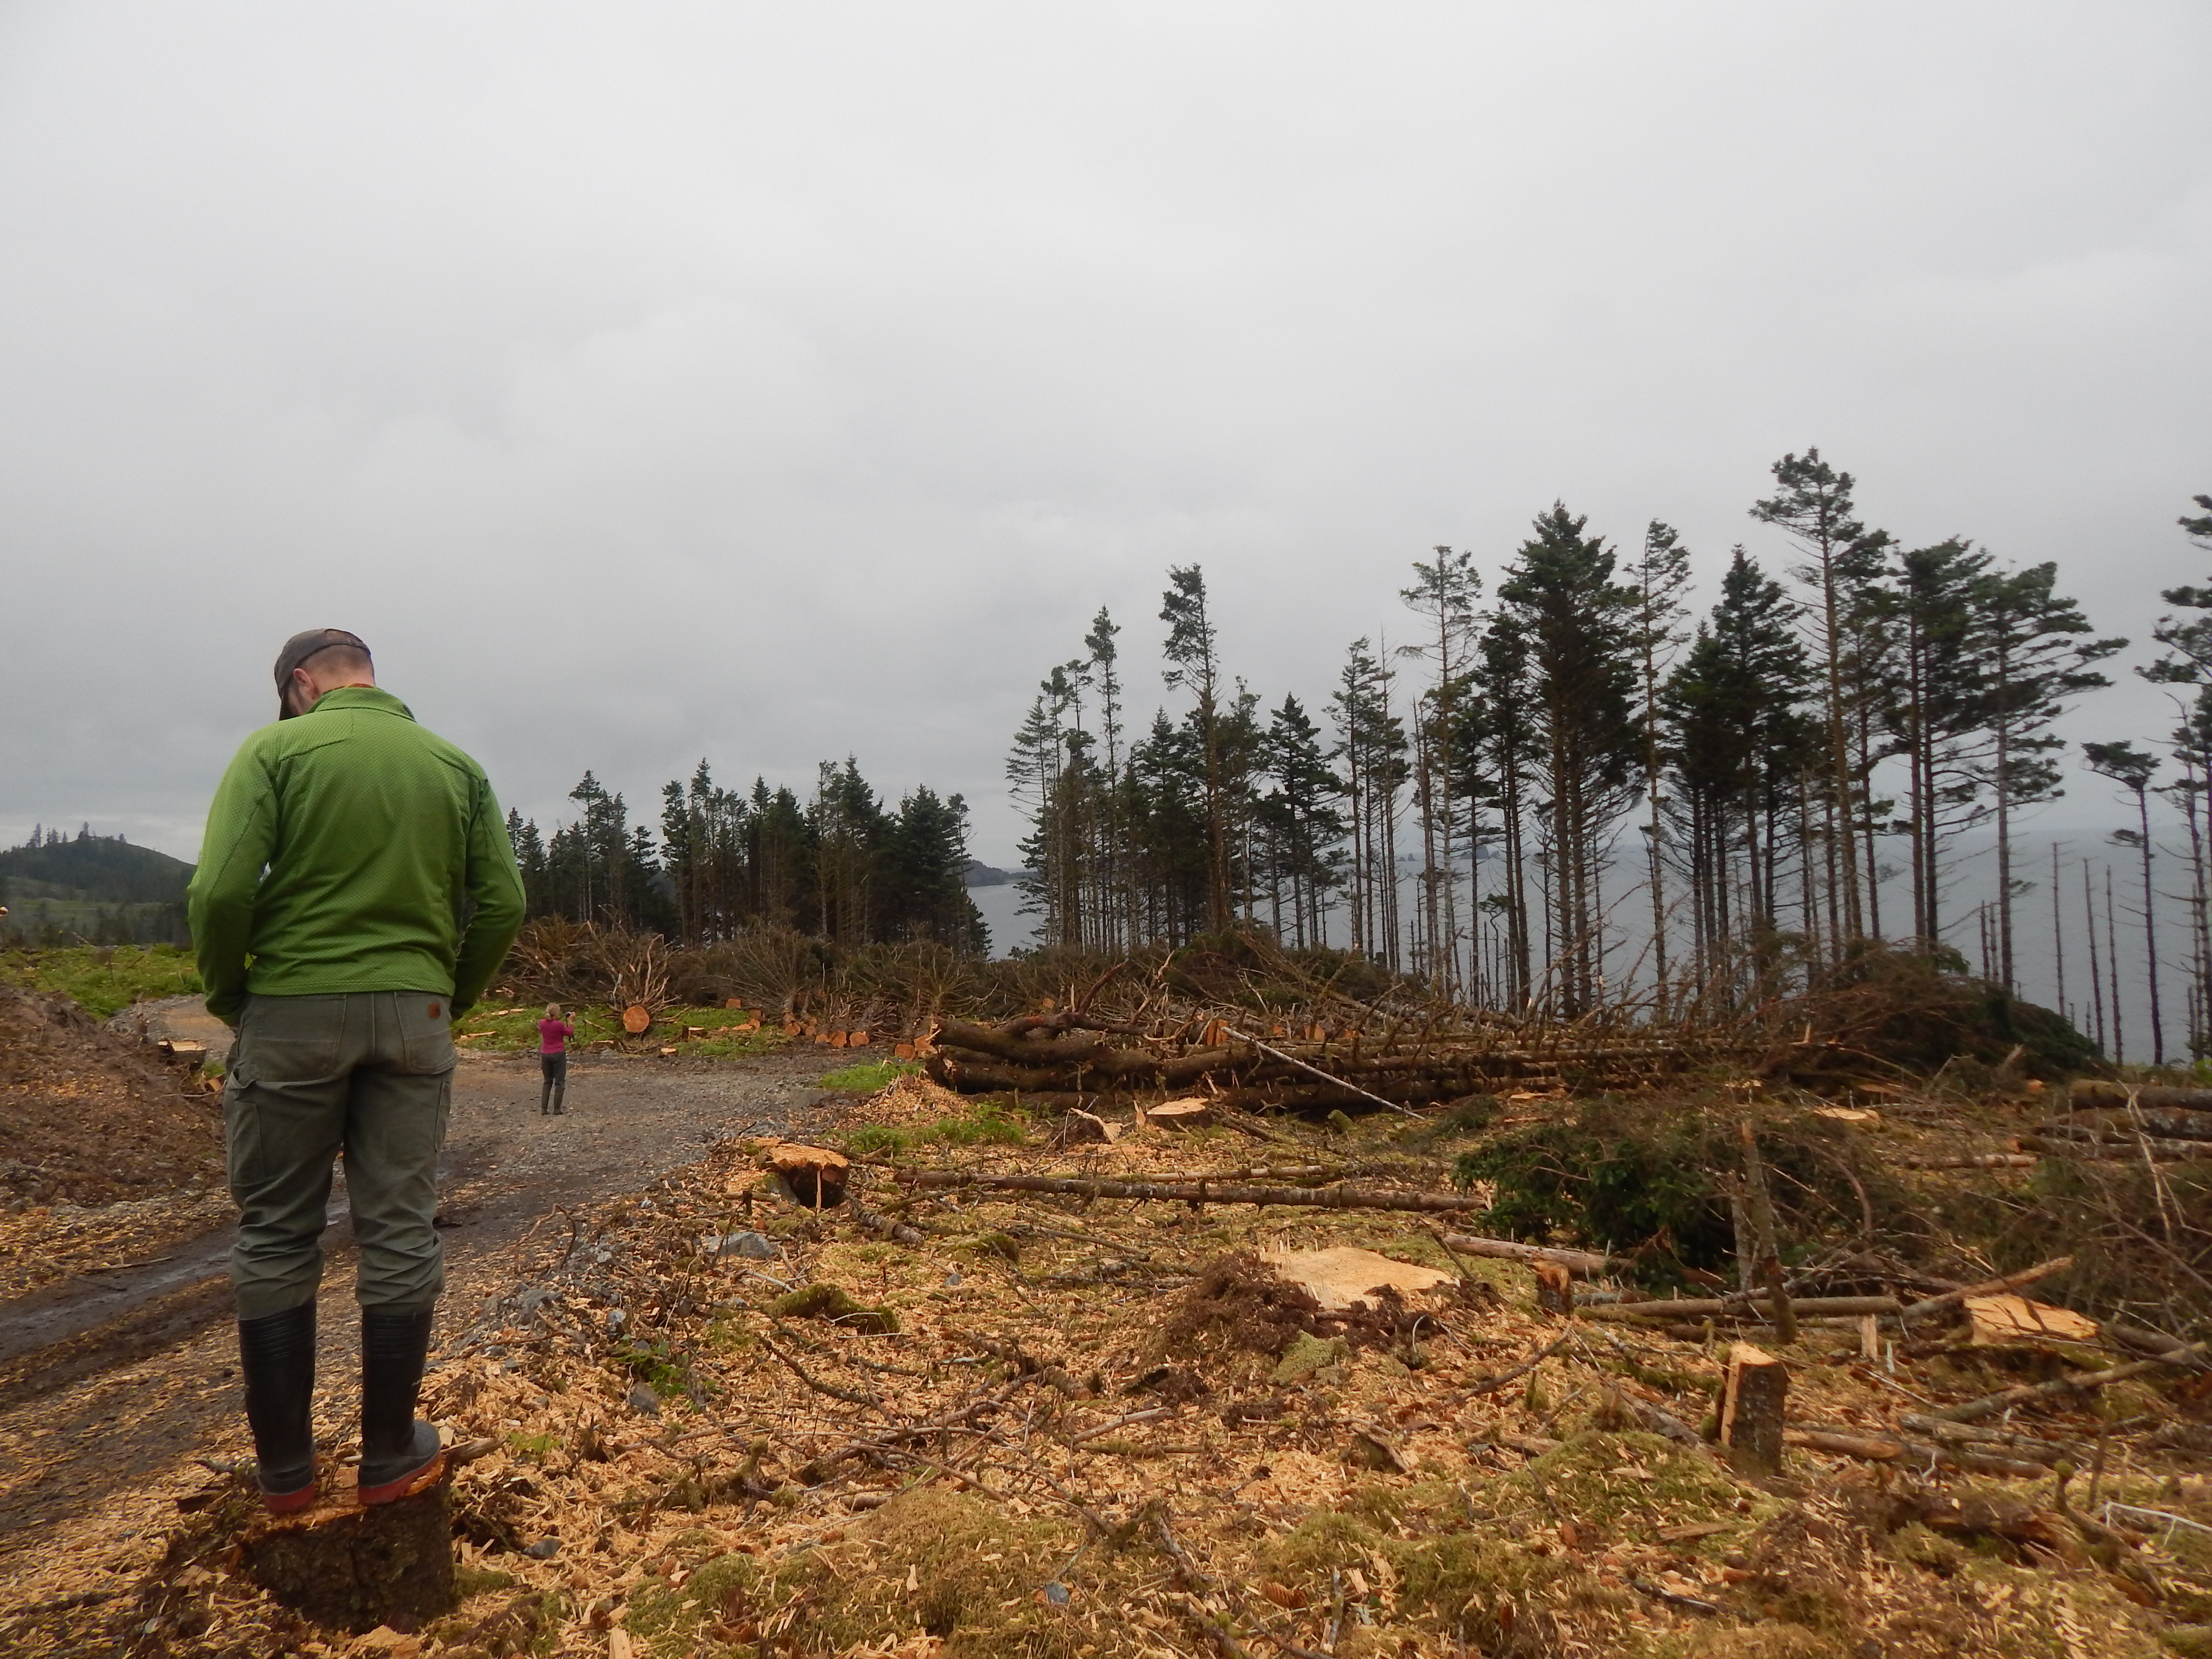
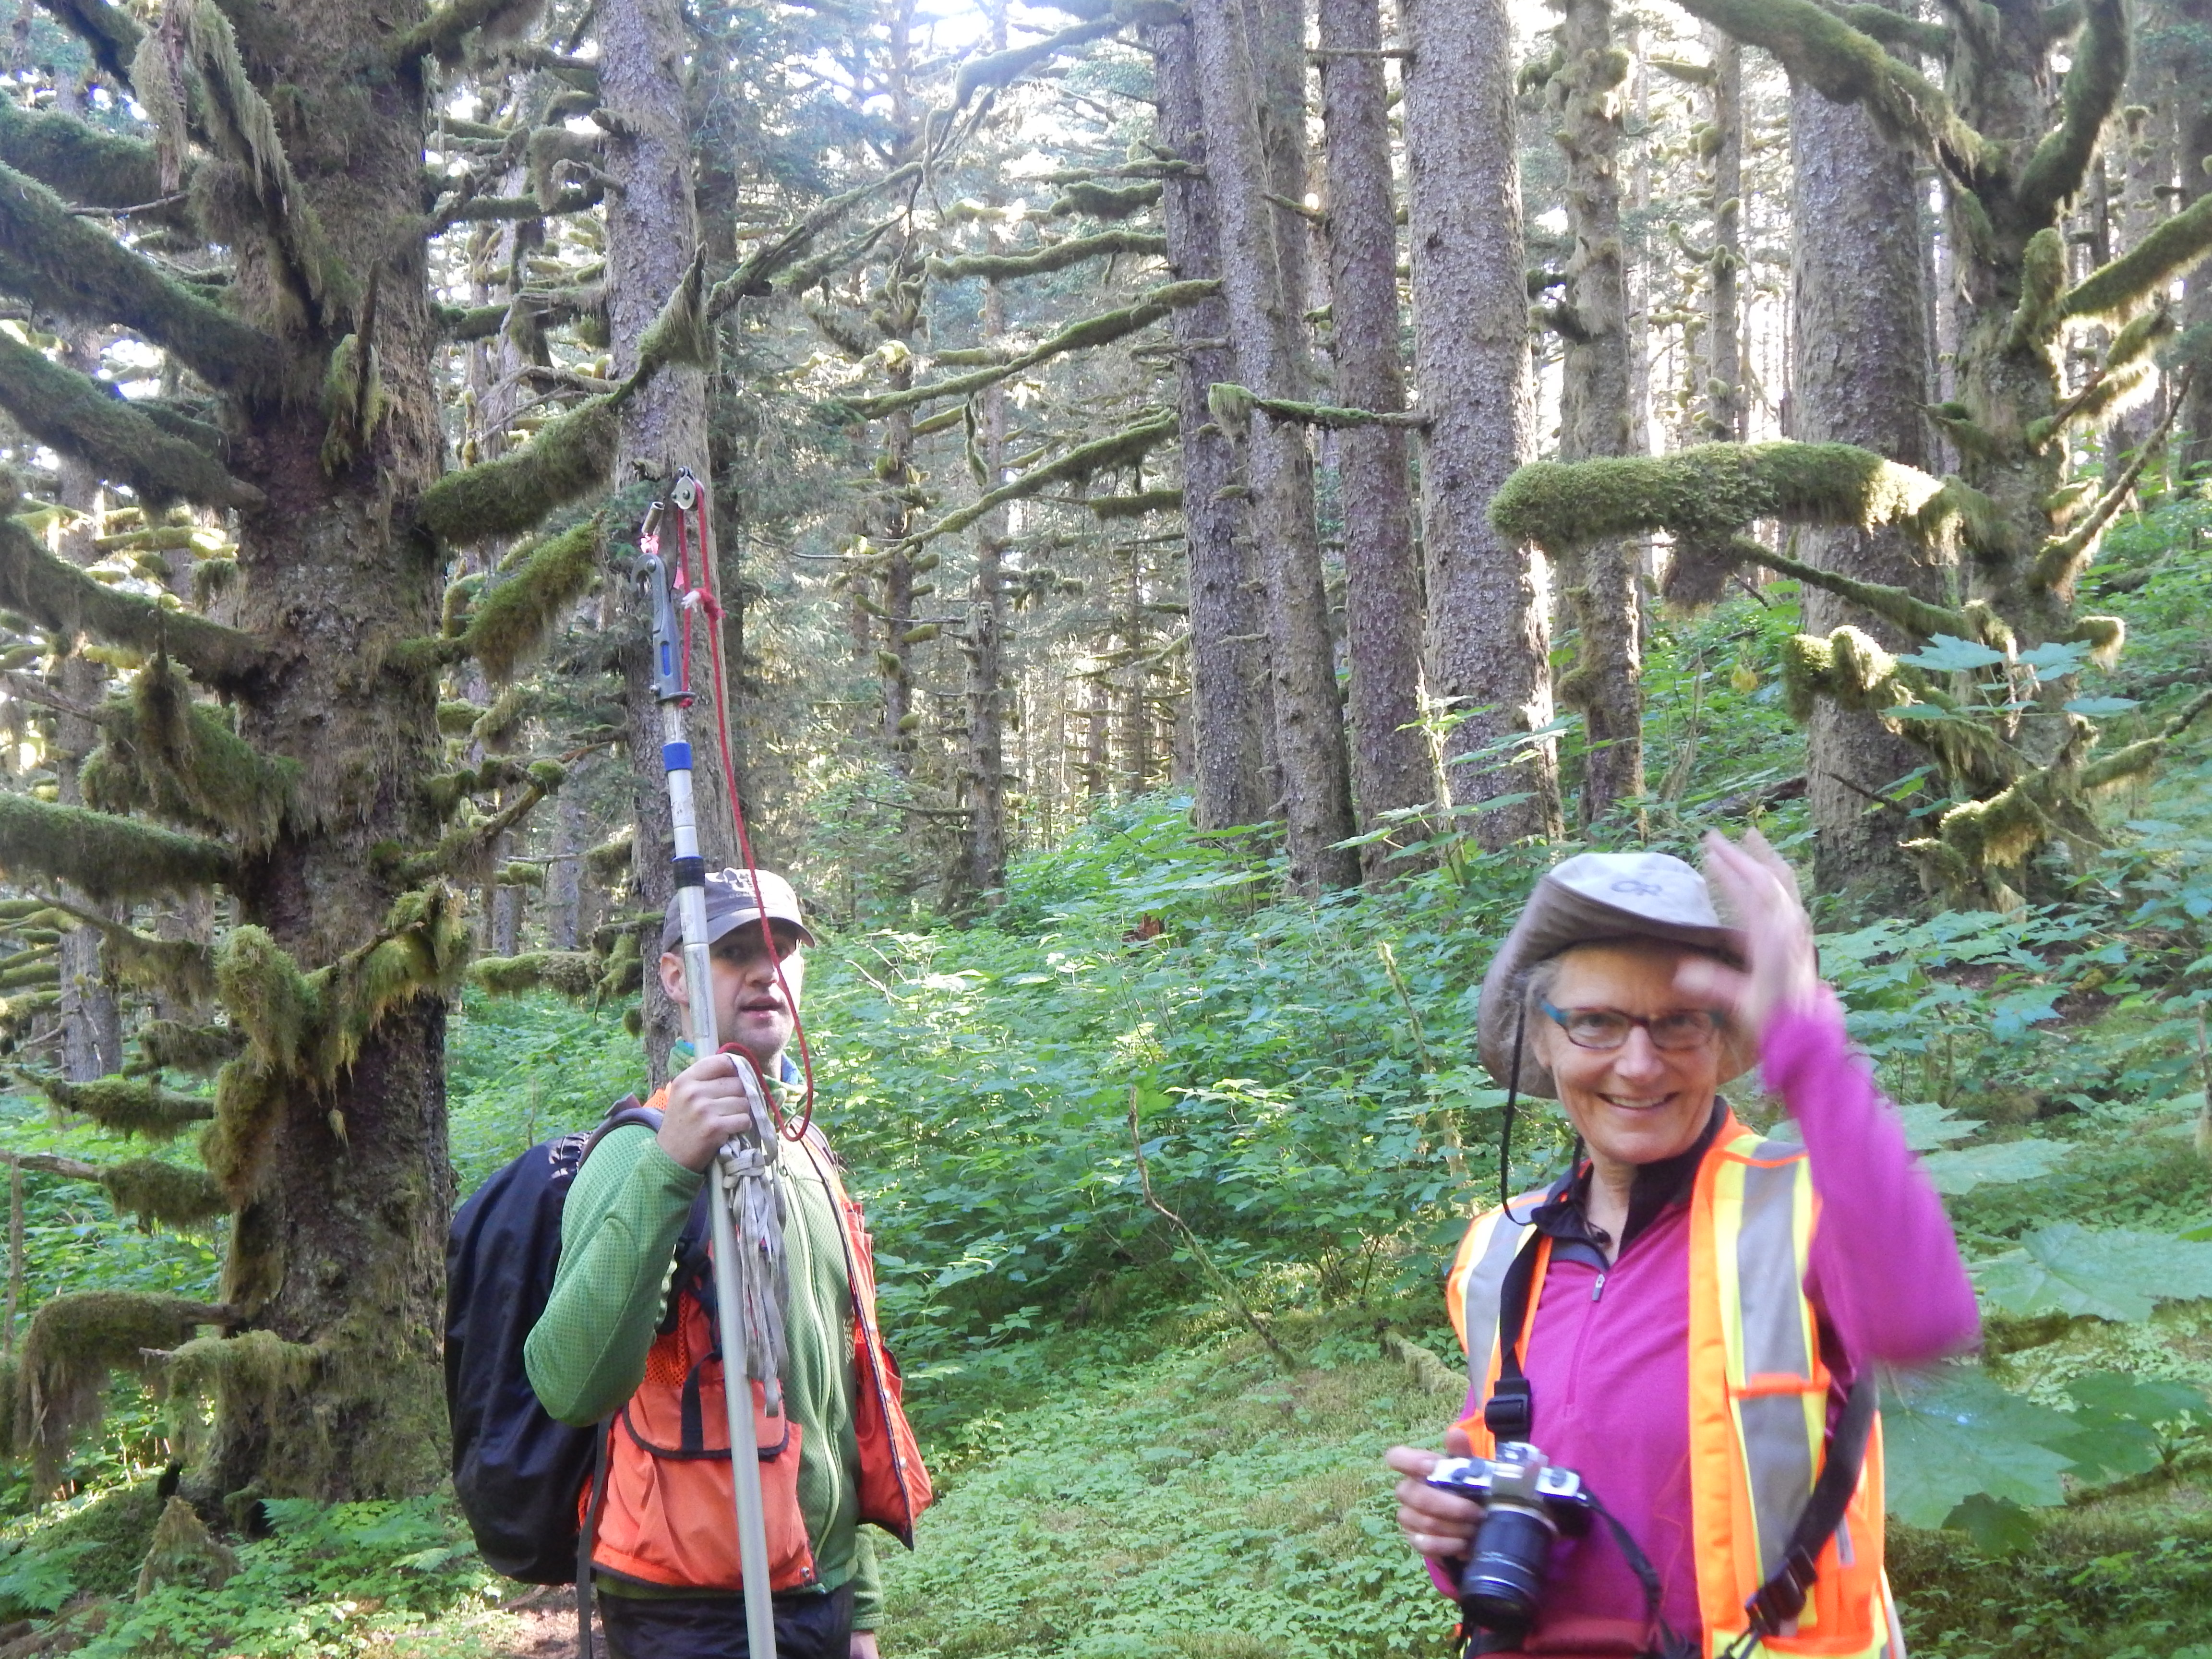
I ended up with a slightly structured distribution of stands (Mother Nature wasn’t told about the statistical advantages of spatial uniformity)…
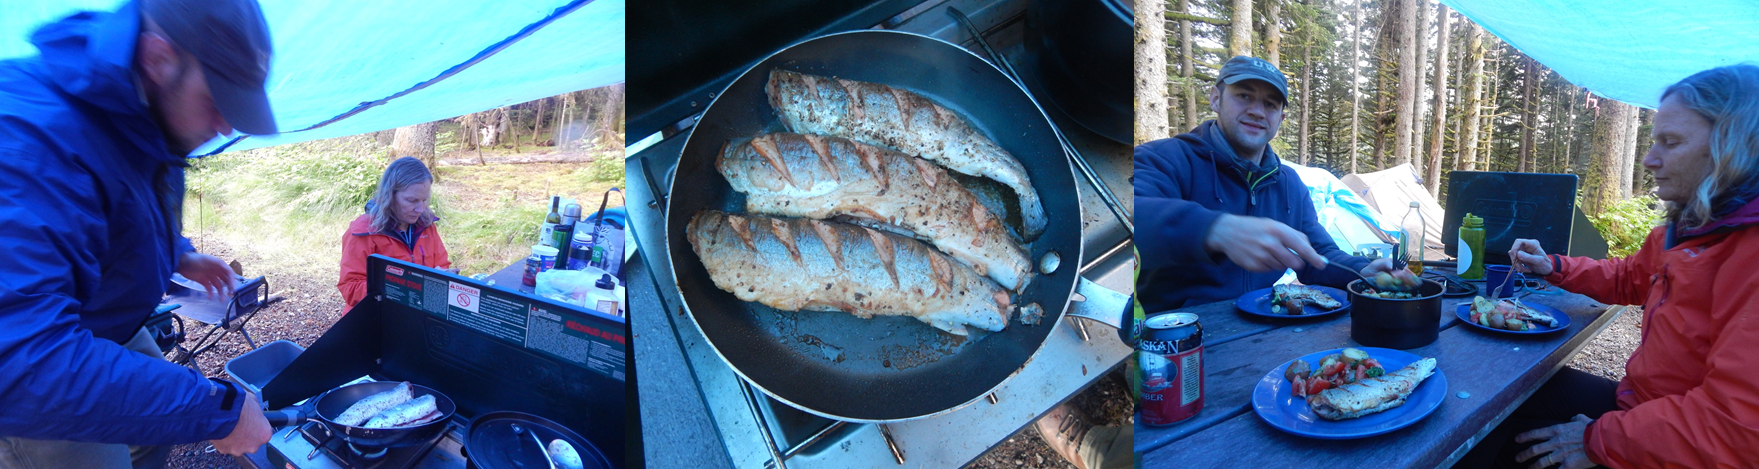
…and occasionally, some fresh fish for dinner (thank you Ian)
By matching the age of sampled trees with their genotype across several stands , I will be able to directly monitor the evolution of the genetic makeup of the forest and answer the following questions:
How quickly do newly formed forests accumulate genetic diversity?
How many trees colonised the area, and from where?
Does relatedness among trees increase or decrease as we approach the front of expansion?
However, to properly answer these questions, I also need at least one “reference” Sitka spruce population that established a long time ago and can be considered to be in an equilibrium state in terms of genetic structure and diversity. The closest Sitka spruce forest that matches these requirements is on the Kenai Peninsula. That’s where the trip continues! Different landscapes, different challenges, different team, and so, very logically,…. different blogpost.
